. 2015 Oct 20;112(42):13027-32.
doi: 10.1073/pnas.1509534112. Epub 2015 Oct 5.

Population genomic structure and adaptation in the zoonotic malaria parasite Plasmodium knowlesi

Affiliations

Population genomic structure and adaptation in the zoonotic malaria parasite Plasmodium knowlesi

Samuel Assefa et al. Proc Natl Acad Sci U S A. .

Abstract

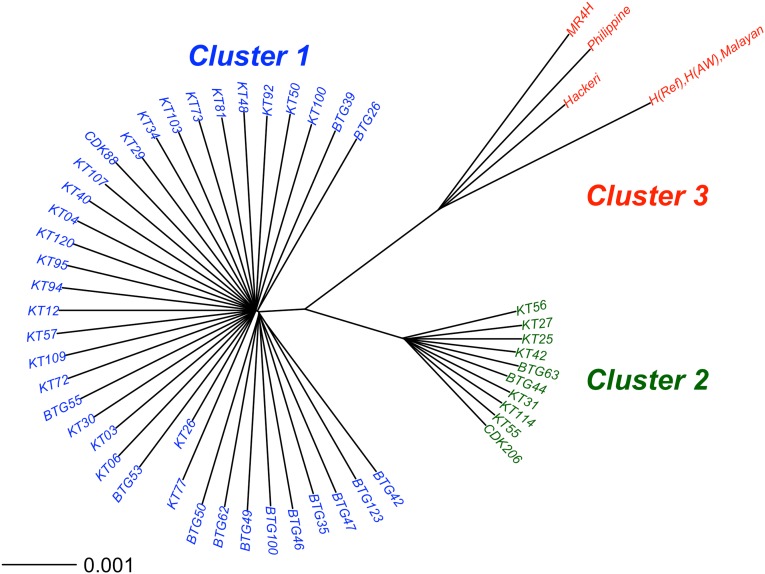
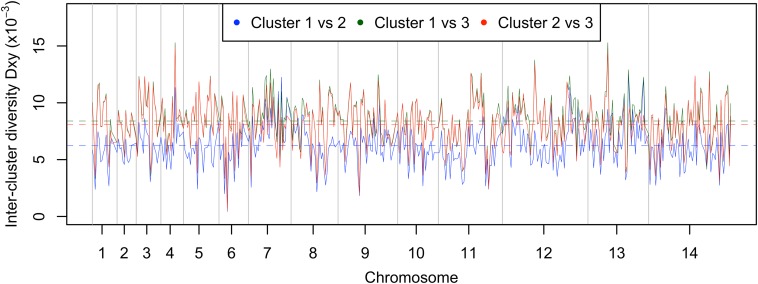
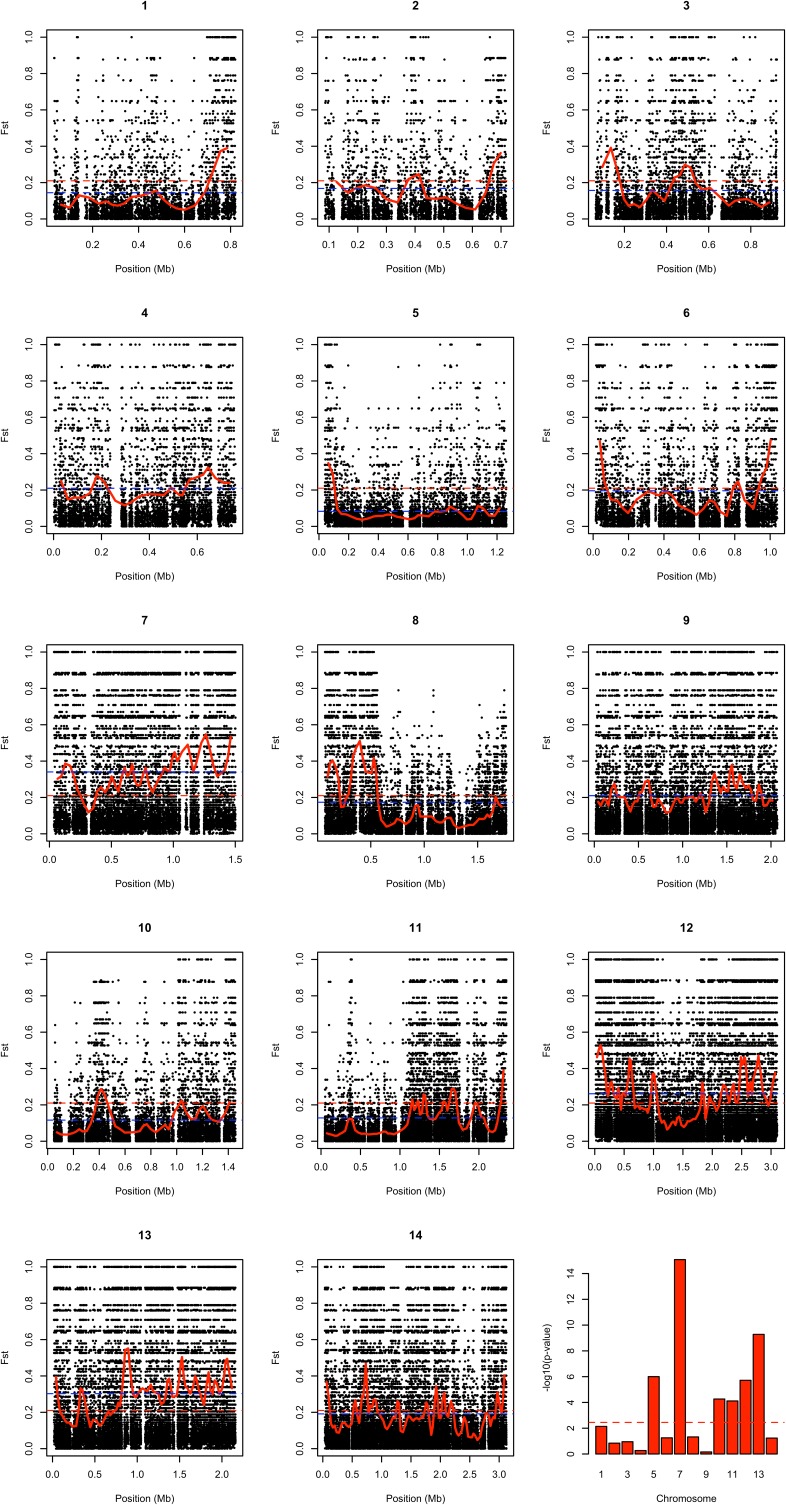
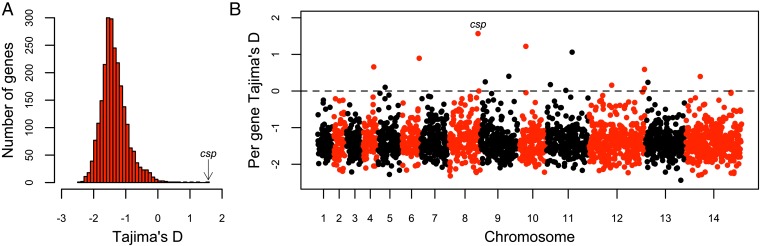
Malaria cases caused by the zoonotic parasite Plasmodium knowlesi are being increasingly reported throughout Southeast Asia and in travelers returning from the region. To test for evidence of signatures of selection or unusual population structure in this parasite, we surveyed genome sequence diversity in 48 clinical isolates recently sampled from Malaysian Borneo and in five lines maintained in laboratory rhesus macaques after isolation in the 1960s from Peninsular Malaysia and the Philippines. Overall genomewide nucleotide diversity (π = 6.03 × 10(-3)) was much higher than has been seen in worldwide samples of either of the major endemic malaria parasite species Plasmodium falciparum and Plasmodium vivax. A remarkable substructure is revealed within P. knowlesi, consisting of two major sympatric clusters of the clinical isolates and a third cluster comprising the laboratory isolates. There was deep differentiation between the two clusters of clinical isolates [mean genomewide fixation index (FST) = 0.21, with 9,293 SNPs having fixed differences of FST = 1.0]. This differentiation showed marked heterogeneity across the genome, with mean FST values of different chromosomes ranging from 0.08 to 0.34 and with further significant variation across regions within several chromosomes. Analysis of the largest cluster (cluster 1, 38 isolates) indicated long-term population growth, with negatively skewed allele frequency distributions (genomewide average Tajima's D = -1.35). Against this background there was evidence of balancing selection on particular genes, including the circumsporozoite protein (csp) gene, which had the top Tajima's D value (1.57), and scans of haplotype homozygosity implicate several genomic regions as being under recent positive selection.

Keywords: Plasmodium diversity; adaptation; population genomics; reproductive isolation; zoonosis.


Conflict of interest statement

The authors declare no conflict of interest.

Figures

Fig. 1.
Fig. 1.
Deep genomic population substructure in P. knowlesi. Neighbor-joining tree based on pairwise nucleotide diversity (π) between isolates using high-quality SNPs from 53 samples (48 clinical isolates from human patients and five laboratory samples maintained in rhesus macaques). This tree shows three major clusters representing two subgroups of clinical isolates (cluster 1, n = 38; cluster 2, n = 10) and a third cluster of laboratory isolates (cluster 3, n = 5) together with the reference genome sequence H(Ref). Clusters 1 and 2 occurred sympatrically at both of the sampling sites (in Kapit, 25 and 8 in each cluster respectively; in Betong, 13 and 2 respectively). Two of the cluster 3 laboratory isolates, labeled “H(AW)” and “Malayan,” were nearly identical to each other and to the reference genome sequence. The isolate labeled here as “MR4H” was received from the MR4 reagent repository labeled as the “H” strain.
Fig. S1.
Fig. S1.
Identifying the population structure using PCA. A PCA of SNPs from all 53 sequenced P. knowlesi samples reveals three main subgroups representing two clusters of the clinical isolates and a third cluster of laboratory samples. These subgroups correspond exactly to the three clusters shown in Fig. 1. Samples from Kapit (n = 33) and Betong (n = 15) are both distributed evenly in the two major clusters (overlapping points on the plot have obscured the visibility of two isolates from Betong within cluster 2). The first two principal components shown here account for a large proportion (26%) of the total variation in the data.
Fig. S2.
Fig. S2.
Divergence (DXY) between each of the three major P. knowlesi clusters in sliding windows of 50 kb (with a step size of 25 kb) across the genome. The average DXY values (differences per nucleotide × 10−3) for the 14 chromosomes were 5.44, 5.61, 6.25, 6.38, 5.71, 5.54, 7.64, 6.25, 6.20, 5.83, 5.62, 6.64, 7.08, and 5.87, respectively.
Fig. S3.
Fig. S3.
The concordance of cluster assignment based on sequence data of 40 clinical isolates analyzed here with the previous assignment of these isolates based on a previously published STRUCTURE analysis of 10-locus microsatellite genotypes (18).
Fig. 2.
Fig. 2.
Distribution of the average nucleotide diversity (π) for sliding windows of 50-kb regions within the three main P. knowlesi subpopulation clusters: cluster 1 (n = 38, blue line), cluster 2 (n = 10, green line), and cluster 3 (n = 4, red line). The dotted lines represent the genomewide mean values for the three respective clusters. The solid black line represents the overall nucleotide diversity across all samples.
Fig. 3.
Fig. 3.
Genomewide FST scans between the cluster 1 and 2 subpopulations of P. knowlesi clinical isolates. (A) Sliding window plot of mean FST scores for windows of 500 consecutive SNPs shows within-chromosome variation of FST scores. The blue and gray shades represent alternating chromosomes. The dashed red lines show the genomewide mean FST value of 0.21. (B) Heterogeneity within individual chromosomes illustrated by plots of FST values for chromosomes 8, 11, and 12. Black dots show values for individual SNPs, and red lines show mean FST values for consecutive windows of 500 SNPs. Dashed blue lines represent chromosome-wide mean FST values, and dashed red lines show the genomewide mean FST value of 0.21.
Fig. S4.
Fig. S4.
Plots of FST values indicating differentiation in SNP allele frequencies between P. knowlesi cluster 1 (38 isolates) and cluster 2 (10 isolates) throughout the genome. The panels show widespread distribution of high-FST SNPs (black dots) as well as extended low-FST regions. The solid red lines show mean FST values for sliding windows of 500 consecutive SNPs. The dashed red lines represent the genomewide average FST score of 0.21, and the dashed blue lines represent the mean FST score for each chromosome (chromosomes 1–14 having values of 0.14, 0.17, 0.16, 0.21, 0.08, 0.2, 0.34, 0.17, 0.21, 0.12, 0.13, 0.26, 0.3, and 0.19, respectively). The bar plot in the bottom right panel shows significance values as −log10 P values of Fisher’s exact test statistics for the 14 chromosomes. In testing the number of windows with mean FST values greater or less than the genomewide mean, chromosomes 5, 10, and 11 were found to have a significantly greater number of low-FST windows, and high-FST windows were significantly overrepresented on chromosomes 7, 12, and 13. In addition, positive Moran’s I indices indicated nonrandom intrachromosomal clustering of FST values, particularly for chromosomes 7, 8, 11, 12, and 13 (with Moran’s I indices of 0.41, 0.48, 0.39, 0.42, and 0.40, respectively).
Fig. 4.
Fig. 4.
Scan of Tajima’s D values for 2,381 genes with a minimum of three SNPs within the major P. knowlesi subpopulation cluster 1 (n = 38 isolates). (A) Frequency distribution of Tajima’s D values shows a highly negative skew genomewide and only a minority of genes with positive values (the gene with the highest value was csp, encoding the circumsporozoite protein). (B) Tajima’s D values for 2,381 genes with a minimum of three SNPs plotted according to their chromosomal positions (black and red colors indicate consecutive chromosomes numbered from the smallest upwards). Tajima’s D values for each of the individual genes are listed in Dataset S1.
Fig. 5.
Fig. 5.
Scan for evidence of recent positive selection in the main P. knowlesi subpopulation cluster 1. Plot of genomewide |iHS| scores shows regions of the genome that have windows of elevated values, consistent with the operation of recent positive directional selection. The dashed lines represent values of 4.89 (blue) and 6 (red), used to define nine windows containing SNPs with overlapping regions of extended haplotype homozygosity, as described in Materials and Methods. The coordinates of these windows and the genes within them are listed in Tables S4 and S5.

References

    1. William T, et al. Severe Plasmodium knowlesi malaria in a tertiary care hospital, Sabah, Malaysia. Emerg Infect Dis. 2011;17(7):1248–1255. - PMC - PubMed
    1. Singh B, Daneshvar C. Human infections and detection of Plasmodium knowlesi. Clin Microbiol Rev. 2013;26(2):165–184. - PMC - PubMed
    1. Daneshvar C, et al. Clinical and laboratory features of human Plasmodium knowlesi infection. Clin Infect Dis. 2009;49(6):852–860. - PMC - PubMed
    1. Cox-Singh J, et al. Plasmodium knowlesi malaria in humans is widely distributed and potentially life threatening. Clin Infect Dis. 2008;46(2):165–171. - PMC - PubMed
    1. Garnham P. Malaria Parasites and Other Haemosporidia. Blackwell Scientific Publications Ltd.; Oxford, UK: 1966.

Publication types

LinkOut - more resources