. 2015 Oct 6;11(10):e1004408.
doi: 10.1371/journal.pcbi.1004408. eCollection 2015 Oct.

Detecting Horizontal Gene Transfer between Closely Related Taxa

Affiliations

Detecting Horizontal Gene Transfer between Closely Related Taxa

Orit Adato et al. PLoS Comput Biol. .

Abstract

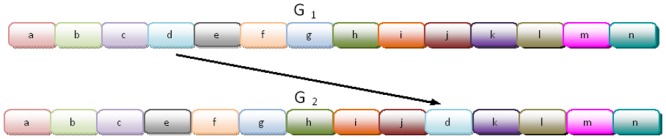
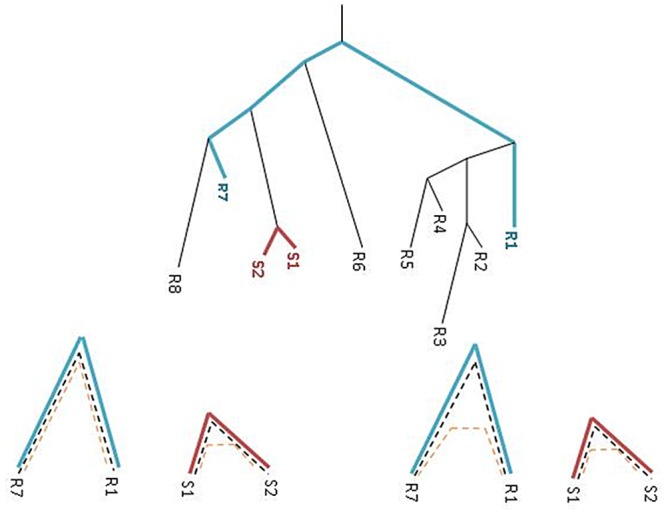
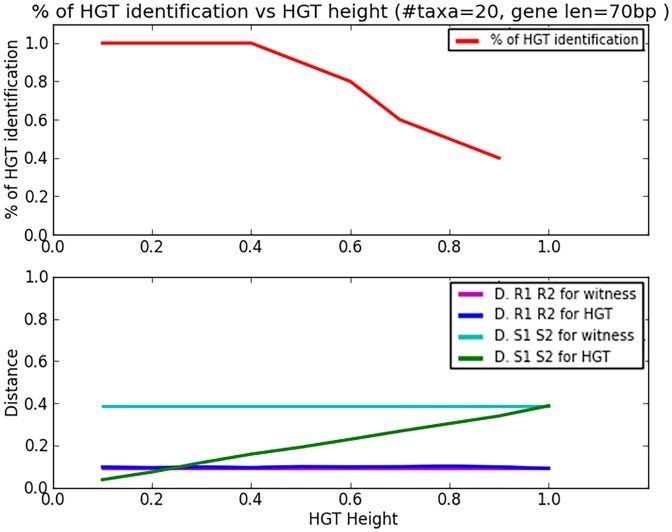
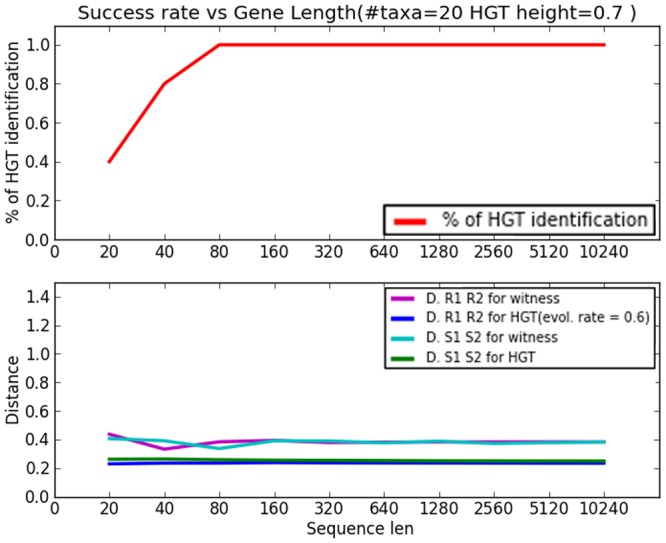
Horizontal gene transfer (HGT), the transfer of genetic material between organisms, is crucial for genetic innovation and the evolution of genome architecture. Existing HGT detection algorithms rely on a strong phylogenetic signal distinguishing the transferred sequence from ancestral (vertically derived) genes in its recipient genome. Detecting HGT between closely related species or strains is challenging, as the phylogenetic signal is usually weak and the nucleotide composition is normally nearly identical. Nevertheless, there is a great importance in detecting HGT between congeneric species or strains, especially in clinical microbiology, where understanding the emergence of new virulent and drug-resistant strains is crucial, and often time-sensitive. We developed a novel, self-contained technique named Near HGT, based on the synteny index, to measure the divergence of a gene from its native genomic environment and used it to identify candidate HGT events between closely related strains. The method confirms candidate transferred genes based on the constant relative mutability (CRM). Using CRM, the algorithm assigns a confidence score based on "unusual" sequence divergence. A gene exhibiting exceptional deviations according to both synteny and mutability criteria, is considered a validated HGT product. We first employed the technique to a set of three E. coli strains and detected several highly probable horizontally acquired genes. We then compared the method to existing HGT detection tools using a larger strain data set. When combined with additional approaches our new algorithm provides richer picture and brings us closer to the goal of detecting all newly acquired genes in a particular strain.


Conflict of interest statement

The authors have declared that no competing interests exist.

Figures

Fig 1
Fig 1. Gene d was transferred from donor species G 1 to recipient species G 2.
Fig 2
Fig 2
Top: The phylogeny over a group of organisms with branch lengths proportional to distances of gene g h. g h has undergone HGT between the two strains S 1 and S 2 and hence their distance is very short compared with two reference organisms R 1 and R 7. Bottom: The reference gene (blue, dashed line) must be a gene that accumulates mutations ever since the divergence of both the strains and reference organisms. There are two cases in which the suspicious gene evolves at the reference organism. (A) No HGT and then the constant relative conserveness is maintained (black dashed). (B) HGT of the SI suspicious gene at the reference organisms and the constant relative conservation is not maintained (yellow dashed).
Fig 3
Fig 3. The HGT simulation study: HGT identification rate as a a function of HGT height.
Gene length is 70bp.
Fig 4
Fig 4. The HGT simulation study: HGT identification rate as a function of transferred fragment length.
HGT event occurs at 0.7 of the height to the donor/recipient LCA. # taxa = 20 in both cases.
Fig 5
Fig 5. The simulation study of rate of false positive HGT detection: Rate of false positive HGT detection as a function of sequence length.
Organism distance is 0.2.
Fig 6
Fig 6. The simulation study of rate of false positive HGT detection: Rate of false positive HGT as a function of organism distance for four gene lengths—40, 640, 2.5k, and 10k bp.
Fig 7
Fig 7. The histogram of genes’ SI values among the three pairs of E. coli strains.
Most of the genes share the same neighborhood in all pairs, reflected by the high abundance of genes with SI = 17–20. The notable peak at SI = 0 corresponds to genes that have undergone.
Fig 8
Fig 8. A phylogenetic tree of the three strains based on the 16S rRNA gene.
CFT073 and MG1655 are sister taxa while EDL933 is an out group.
Fig 9
Fig 9. Genes with significant probability to be the product of HGT.
For each significant gene, there are three bars corresponding to each pair of strains. The height of the bar represents the number of times (i.e. number of witness genes in reference species) that the gene was found with significant support (in log scale) to be derived from HGT. The value -1 indicates that this gene is not an SI-based HGT candidate between these two strains (including cases where the gene is simply not present in both strains). Zero means we did not find any significant witness for that gene.
Fig 10
Fig 10. HGT events detected per strain pair.
Near HGT was applied to 8 E. coli strains. As a result 28 pairs of strains were generated and HGT events were detected for each pair. Each piece of the pie represents two strains (e.g. 536&MG1655) and the number of identified HGT events (e.g. 432).
Fig 11
Fig 11. Comparison of HGT events detected by the Near HGT and RIATA-HGT methods for the genes valS and speG: valS based tree with HGT events marked by broken arrows.
Blue—HGT detected by RIATA, orange—HGT detected by Near HGT.
Fig 12
Fig 12. Comparison of HGT events detected by the Near HGT and RIATA-HGT methods for the genes valS and speG: speG based tree with HGT events marked by broken arrows.
Red—HGT detected by RIATA, green—HGT detect by Near HGT.
Fig 13
Fig 13. A genome is viewed as a sequence of genes while a gene is a sequence of nucleotides.
Fig 14
Fig 14. Comparing G 1 with G 2 for k = 3: SI(g, G 1, G 2) = 3, SI(x, G 1, G 2) = 0, SI(ℓ, G 1, G 2) = 0.

References

    1. Koonin E. V. and Galperin M. Y., Sequence—Evolution—Function. Computational Approaches in Comparative Genomics. Springer, 2002. - PubMed
    1. Gogarten J. and Townsend J., “Horizontal gene transfer, genome innovation and evolution,” Nat Rev Microbiol., vol. 3, no. 9, pp. 679–87, 2005. - PubMed
    1. Doolittle W. F., “Phylogenetic classification and the universal tree,” Science, vol. 284, no. 5423, pp. 2124–9, 1999. - PubMed
    1. Koonin E. V., Makarova K. S., and Aravind L., “Horizontal gene transfer in prokaryotes: quantification and classification,” Annu Rev Microbiol, vol. 55, pp. 709–42, 2001. - PMC - PubMed
    1. Nakamura Y., Itoh T., Matsuda H., and Gojobori T., “Biased biological functions of horizontally transferred genes in prokaryotic genomes,” Nat Genet, vol. 36, no. 7, pp. 760–6, 2004. - PubMed

Publication types

LinkOut - more resources