. 2015 Oct 6;11(10):e1004517.
doi: 10.1371/journal.pcbi.1004517. eCollection 2015 Oct.

A Generative Statistical Algorithm for Automatic Detection of Complex Postures

Affiliations

A Generative Statistical Algorithm for Automatic Detection of Complex Postures

Stanislav Nagy et al. PLoS Comput Biol. .

Abstract

This paper presents a method for automated detection of complex (non-self-avoiding) postures of the nematode Caenorhabditis elegans and its application to analyses of locomotion defects. Our approach is based on progressively detailed statistical models that enable detection of the head and the body even in cases of severe coilers, where data from traditional trackers is limited. We restrict the input available to the algorithm to a single digitized frame, such that manual initialization is not required and the detection problem becomes embarrassingly parallel. Consequently, the proposed algorithm does not propagate detection errors and naturally integrates in a "big data" workflow used for large-scale analyses. Using this framework, we analyzed the dynamics of postures and locomotion of wild-type animals and mutants that exhibit severe coiling phenotypes. Our approach can readily be extended to additional automated tracking tasks such as tracking pairs of animals (e.g., for mating assays) or different species.


Conflict of interest statement

The authors have declared that no competing interests exist.

Figures

Fig 1
Fig 1
(A) Left: detected edges in an image of a wild-type animal exhibiting a (rare) coiled posture. The red/blue colors indicate the two possible edge polarities. Right: Detected body (yellow) and head (cyan) features with indicators of the corresponding orientations. (B) Graphical representations of the four head features and the four body features. Each feature corresponds to a spatial arrangement of areas with elevated probabilities for specific edge types. The red and blue shade colors represent areas with increased probabilities for positive and negative polarity edges, respectively. Green areas represent an overlap of red and blue areas. Red and blue dashed lines represent the orientation of positive and negative polarity edges, respectively. These masks introduce invariance to the exact location of the edges and are hence robust to variations in the width of the worm. (C) Left: a detected subinstantiation at an intermediate search step. The magenta blocks indicate which coarse locations have been visited so far during the search for the body. Right: Final detection of the posture using the coarse detection algorithm. Scale bars represent 100 μm.
Fig 2
Fig 2
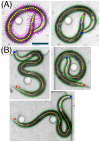
(A) Left: a smoothed midline and admissible regions (magenta) for the fine detection of the posture of a wild-type animal. Right: the corresponding fine instantiation. (B) Additional examples of detected non-self-avoiding postures, rarely exhibited by wild-type animals. The midline and edges of the animal are depicted in yellow and green, respectively. The head and the tail of the animal are depicted in blue and red, respectively. Scale bar represents 100 μm.
Fig 3
Fig 3
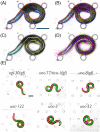
(A) Head (cyan) and body (yellow) features of an egl-30 mutant, as determined by the basic algorithm. (B) Same as (A) with added double-body (magenta) features, as determined by the improved algorithm. (C) Coarse detection of the posture of the egl-30 mutant using the improved algorithm. (D) Fine detection of the posture of the egl-30 mutant. (E) Examples of non-self-avoiding postures detected in six mutants that exhibit coiler phenotypes. The midline and edges of the animal are depicted in green and red, respectively. Scale bars represent 100 μm.
Fig 4
Fig 4
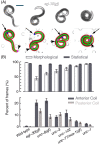
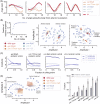
(A) Anterior coils and posterior coils exhibited by an animal carrying the egl-30(gf) allele. Arrows and arrow-heads point to the head (blue) and tail (magenta) of the animals, respectively. (B) Top: the percentage of frames in which posture was successfully identified in wild-type animals and coiler mutants using morphological operations or a generative statistical model. Bottom: the percentage of frames in which a coiled posture was detected. In panel (B), 9–12 L4 larvae of each genotype were imaged at 10 frames per second for 2–4 hours, yielding a total of approximately 105 images. Error bars and thin lines depict animal-to-animal variation (mean ± s.e.m).
Fig 5
Fig 5
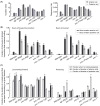
(A) The characteristic duration (left) and frequency (right) of continuous periods of coiling. (B) The fraction of bouts of forward (left) and backward (right) locomotion that contained coiled postures. The majority of bouts of directed locomotion of egl-30(gf) and unc-8(gf) mutants involved coiled postures. (C) A continuous period during which the animal was coiled, termed a coiling event, could contain sub-periods of forward or backward locomotion in addition to dwelling. Filled bars depict the fractions of the durations of coiling events that were spent exhibiting locomotion in a given direction. The mean propensities for directed locomotion when the animal was not coiling (empty bars) were measured as a baseline for comparisons. Asterisks denote that the propensity during coiling of the locomotion state in question was higher than its corresponding baseline (p<0.01). In all panels, 9–12 L4 larvae of each genotype were imaged at 10 frames per second for 2–4 hours, yielding a total of approximately 105 images. Error bars and thin lines depict animal-to-animal variation (mean ± s.e.m).
Fig 6
Fig 6
(A) The leading four PCA modes for individual coiler mutants (thin lines) and for the combined coiler dataset (thick lines). (B) Left: the variance explained by the modes of the combined coiler dataset in order of their significance. Dashed line represents 95%. Middle/right: centroids of posture clusters were projected onto the plane of the two leading modes. Typical coiling postures were reconstructed from centroids. The intuitive interpretation of the two leading modes is demonstrated by the separation between ventral (positive amplitudes) and dorsal (negative amplitudes) coiling. (C) The dynamics of the amplitudes of the three leading modes during continuous periods of coiling. The duration of individual coiling events were normalized such that the horizontal axis depicts the fraction of duration of the coiling event (mean durations for each strain can be seen in Fig 5A). (D) Left: for each strain shown, the 10 most populated cluster centroids for spools (coiled postures for which a 1·a 2 > 1) were projected onto the plane of the two leading modes and their convex hull was calculated. These convex hulls for wild-type animals (red), static coilers (blue shades) and loopy movers (orange shades) are shown in the plane of the two leading modes. Example postures were reconstructed from the cluster centroids (blue curves). Dotted lines point from the position of a cluster centroid to the reconstruction of its respective body posture. Grey circles at edges of reconstructed postures denote the position of the head. Right: the fraction of severe spools exhibited by wild-type animals and coiler mutants in our assays. Error bars and thin lines depict animal-to-animal variation (mean ± s.e.m). Eigenworms are represented using angle differences (49) as opposed to angles with a fixed axis (7) (see Materials and Methods).
Fig 7
Fig 7
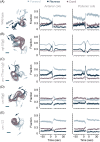
(A) Left: an overlay of postures before, during, and after coiling of a wild-type animal. Arrows depict the direction of locomotion and the scale bar represents 100 μm. Middle: the probabilities of forward locomotion, reversals, and non-directional dwelling before and after a detected period of anterior coiling. Right: locomotion probabilities before and after a period of posterior coiling. In the case of wild-type animals, most coiling events occur during Ω–turns. The horizontal time axis depicts the time leading to and immediately following a continuous period of coiling, i.e., the entry into and exit from a coiling event. The gaps signify that locomotion during the (variable) time of the coiling events themselves is not plotted. (B)-(E) The same as (A) for mutants exhibiting coiling phenotypes. In all panels, 9–12 L4 larvae of each genotype were imaged at 10 frames per second for 2–4 hours. Thin lines depict animal-to-animal variation (mean ± s.e.m).
Fig 8
Fig 8
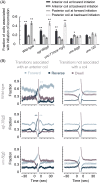
(A) The fraction of coiling events that were detected within 5 sec of the initiation of directed locomotion. Loopy movers exhibit increased probabilities of anterior or posterior coiling upon initiating forward or backward locomotion, respectively. (B) Left: the probabilities of forward locomotion, reversals, and non-directional dwelling before and after a period of dwelling, after the onset of which anterior coiling was detected. Right: the probabilities of locomotion states before and after a period of dwelling, after the onset of which coiling was not detected. The horizontal time axis depicts the time leading to and immediately following a continuous period of dwelling, i.e., the entry into and exit from a dwelling event. The gaps signify that locomotion during the (variable) time of the coiling events themselves is not plotted. In all panels, 9–12 L4 larvae of each genotype were assayed for 2–4 hours. Error bars and thin lines depict animal-to-animal variation (mean ± s.e.m).
Fig 9
Fig 9
(A) The probabilities of forward locomotion, reversals, and non-directional dwelling of wild-type animals before and after a detected period of anterior coiling. The data was plotted separately for ventral and dorsal coils. The signature of Ω-turns is only apparent in the case of ventral coils. (B) The fraction of the total number of detected coils that were initiated in a given direction. A dorsal preference for posterior coils was only observed in the case of unc-77/nca-1(gf) mutants. (C) The posterior relative body angle, i.e., the angle between the most posterior next nearest neighbor intervals out of a total of 20 intervals along the body. Dorsal hyper-bending was more pronounced in unc-77/nca-1(gf) (but not egl-30(gf) mutants).

References

    1. Brenner S (1974) The genetics of Caenorhabditis elegans. Genetics 77: 71–94. Available: http://eutils.ncbi.nlm.nih.gov/entrez/eutils/elink.fcgi?dbfrom=pubmed&id.... - PMC - PubMed
    1. White JG, Southgate E, Thomson JN, Brenner S (1986) The structure of the nervous system of the nematode Caenorhabditis elegans. Philos Trans R Soc London Ser B, Biol Sci 314: 1–340. Available: http://eutils.ncbi.nlm.nih.gov/entrez/eutils/elink.fcgi?dbfrom=pubmed&id.... - PubMed
    1. Bargmann CI, Marder E (2013) From the connectome to brain function. Nat Methods 10: 483–490. Available: http://eutils.ncbi.nlm.nih.gov/entrez/eutils/elink.fcgi?dbfrom=pubmed&id.... - PubMed
    1. Feng Z, Cronin CJ, Wittig JH, Sternberg PW, Schafer WR (2004) An imaging system for standardized quantitative analysis of C. elegans behavior. BMC Bioinformatics 5: 115 Available: http://eutils.ncbi.nlm.nih.gov/entrez/eutils/elink.fcgi?dbfrom=pubmed&id.... - PMC - PubMed
    1. Geng W, Cosman P, Berry CC, Feng Z, Schafer WR (2004) Automatic tracking, feature extraction and classification of C elegans phenotypes. IEEE Trans Biomed Eng 51: 1811–1820. Available: http://eutils.ncbi.nlm.nih.gov/entrez/eutils/elink.fcgi?dbfrom=pubmed&id.... - PubMed

Publication types

MeSH terms