. 2016 Jan;147(1):30-40.
doi: 10.1111/imm.12539. Epub 2015 Nov 16.

Comparative analysis of mediastinal fat-associated lymphoid cluster development and lung cellular infiltration in murine autoimmune disease models and the corresponding normal control strains

Affiliations

Comparative analysis of mediastinal fat-associated lymphoid cluster development and lung cellular infiltration in murine autoimmune disease models and the corresponding normal control strains

Yaser Hosny Ali Elewa et al. Immunology. 2016 Jan.

Abstract

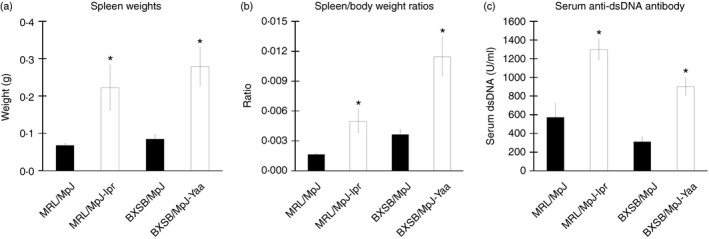
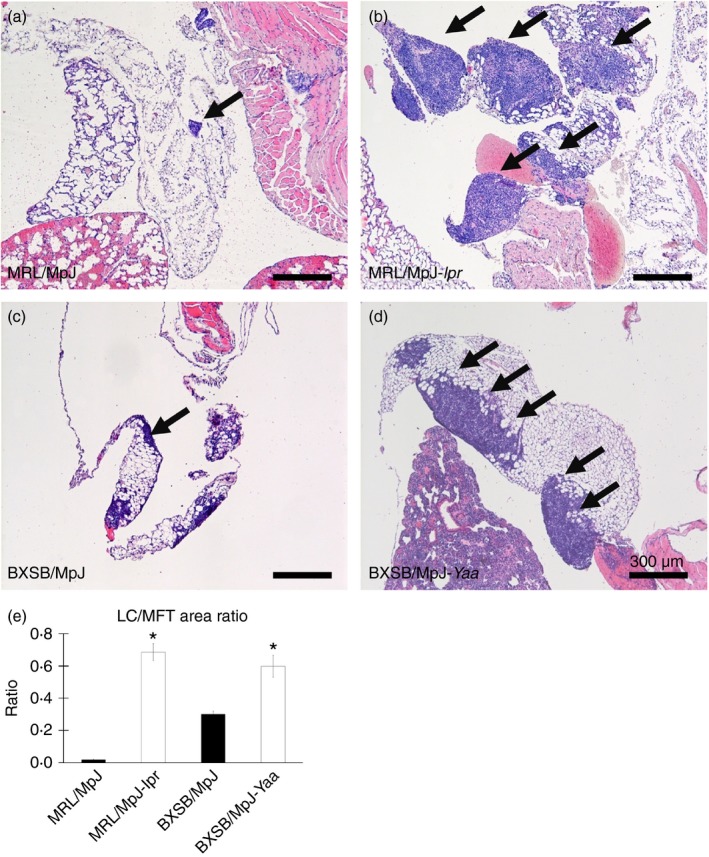
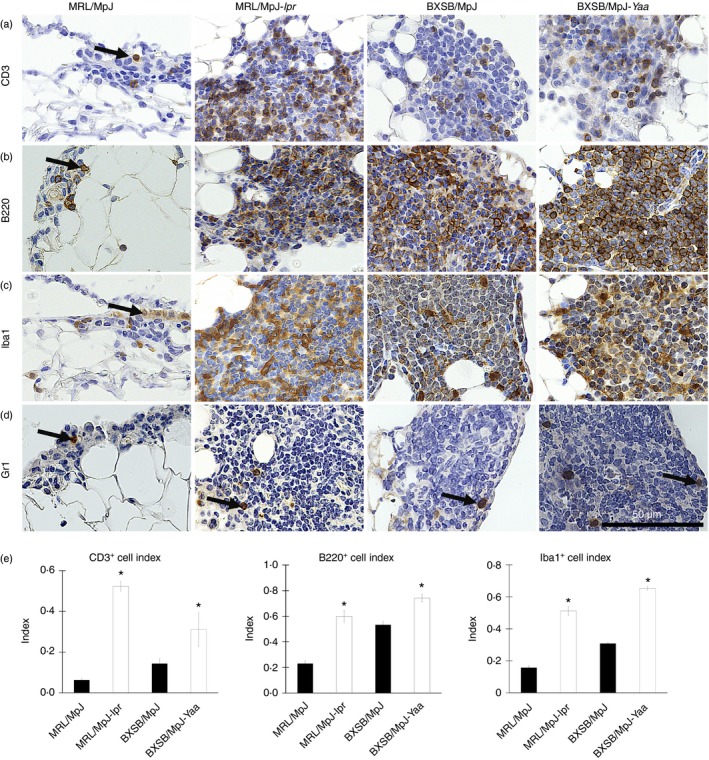
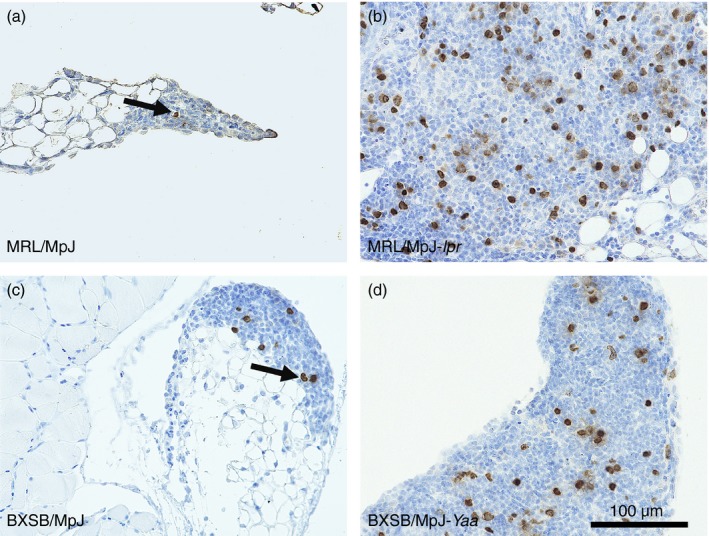
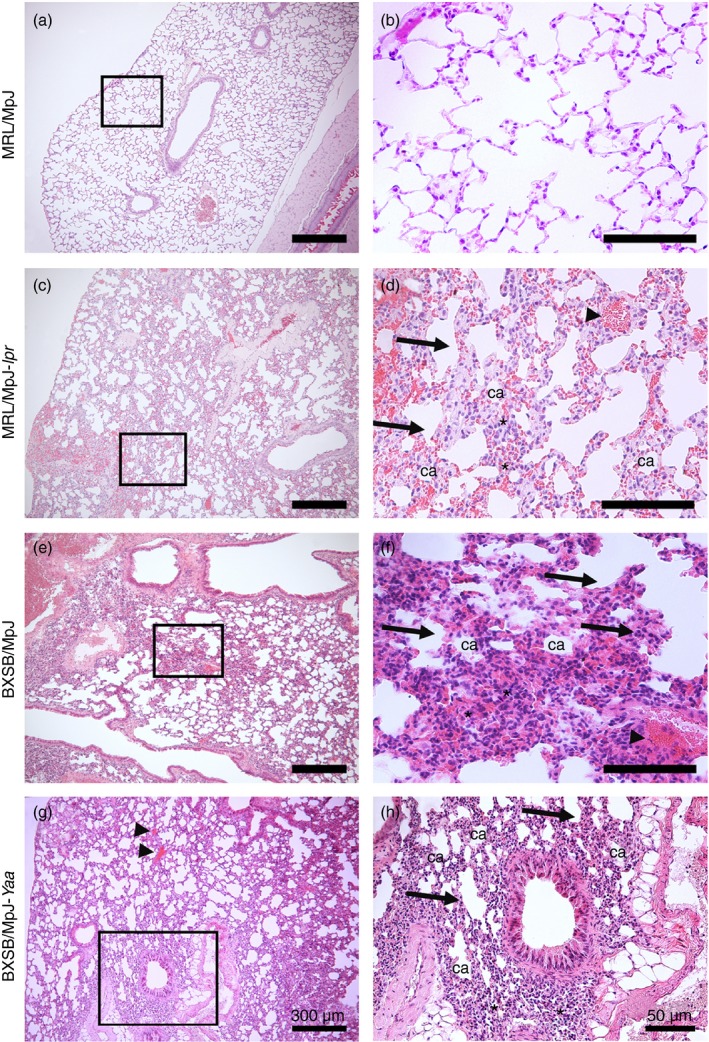
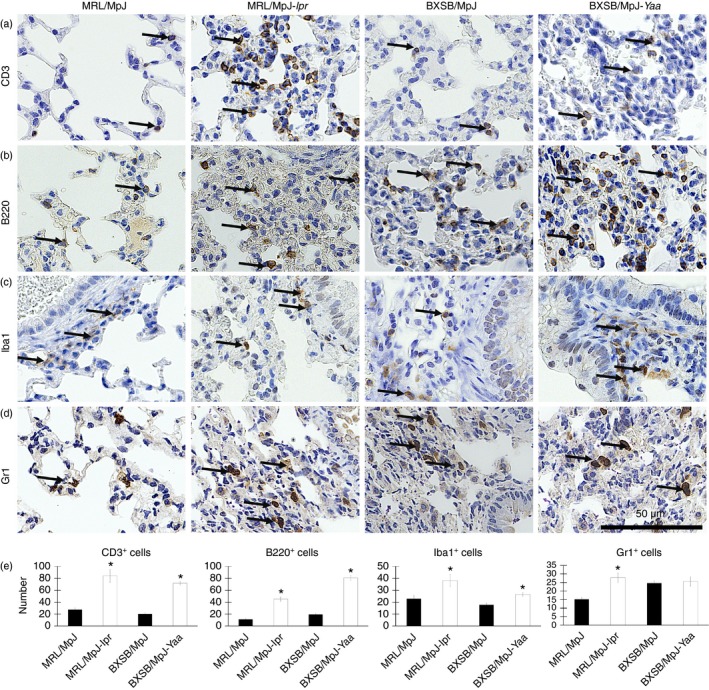
We previously discovered mediastinal fat-associated lymphoid clusters (MFALCs) as novel lymphoid clusters associated with mediastinal fat tissue in healthy mice. However, no data about their morphology in immune-associated disease conditions, and their relationship with lung infiltration, is available to date. In the present study, we compared the morphological features of MFALCs in 4-month-old male murine autoimmune disease models (MRL/MpJ-lpr mice and BXSB/MpJ-Yaa mice) with those of the corresponding control strains (MRL/MpJ and BXSB/MpJ, respectively). In addition, we analysed their correlation with lung infiltration. Furthermore, immunohistochemistry for CD3, B220, Iba1, Gr1 and BrdU was performed to detect T cells and B cells, macrophages, granulocytes and proliferating cells, respectively. The spleen weight to body weight ratios and anti-double-stranded DNA autoantibody titres were found to be significantly higher in the autoimmune models than in the control strains. Furthermore, the autoimmune model presented prominent MFALCs, with a significantly greater ratio of lymphoid cluster area to total mediastinal fat tissue area, and more apparent diffused cellular infiltration into the lung lobes than the other studied strains. Higher numbers of T and B cells, macrophages and proliferating cells, but fewer granulocytes, were observed in the autoimmune models than in the control strains. Interestingly, a significant positive Pearson's correlation between the size of the MFALCs and the density of CD3-, B220- and Iba1-positive cells in the lung was observed. Therefore, our data suggest a potentially important role for MFALCs in the progression of lung disease. However, further investigation is required to clarify the pathological role of MFALCs in lung disease, especially in inflammatory disorders.

Keywords: autoimmune disease model; lymphoid cluster; mediastinal adipose tissue.


Figures

Figure 1
Figure 1
Indices of autoimmune disease onset in mice. Graph showing the spleen weight (n = 5 mice for each strain) (a), spleen weight to body weight ratio (n = 5 mice for each strain) (b), and serum anti‐double‐stranded DNA (anti‐dsDNA) level (n = 4 mice for each strain) (c). Statistically significant difference, as determined using the Mann–Whitney U‐test (P < 0·05), between autoimmune disease models (MRL/MpJ‐lpr and BXSB/MpJ‐Yaa) and the control strains (MRL/MpJ, BXSB/MpJ), respectively, is indicated, *P < 0·05. Values are shown as the means ± SE.
Figure 2
Figure 2
Histological features of mediastinal fat‐associated lymphoid clusters (MFALCs) in mice. Light microscopic images of haematoxylin & eosin (H&E)‐stained mediastinal fat tissues (MFTs) of MRL/MpJ, MRL/MpJ‐lpr, BXSB/MpJ and BXSB/MpJ‐Yaa mice, respectively (a–d). Note that MFALCs (indicated by arrows) are more prominent in both MRL/MpJ‐lpr (b) and BXSB/MpJ‐Yaa mice (d). (e) Graph showing the ratio of lymphoid cluster (LC) area to the total MFT area in the H&E‐stained sections (×40). Statistically significant difference, as determined using the Mann–Whitney U‐test; n = 5 mice for each strain, between autoimmune disease models (MRL/MpJ‐lpr and BXSB/MpJ‐Yaa) and the control strains (MRL/MpJ, BXSB/MpJ), respectively, is indicated (*P < 0·05). Values are shown as the means ± SE.
Figure 3
Figure 3
Immune cells from mediastinal fat‐associated lymphoid clusters (MFALCs) in mice. Light microscopic photographs showing immunohistochemical staining of mouse MFALCs with CD3 (a), B220 (b), Iba1 (c), and Gr1 (d). Numerous CD3‐positive T cells, B220‐positive B cells, and Iba1‐positive macrophages (a–c), but only a few Gr1‐positive granulocytes (d), are present in mouse MFALCs, and their appearance differs between the strains. Arrows indicate immunopositive cells. Bars (a–d) = 100 μm. Graphs showing the indices of immunopositive cells for CD3 (a), B220 (b), and Iba1 (c) in MRL/MpJ, MRL/MpJ‐lpr, BXSB/MpJ, and BXSB/MpJ‐Yaa mice (e). Statistically significant difference, as determined using the Mann–Whitney U‐test; n = 5 mice for each strain, between autoimmune disease models (MRL/MpJ‐lpr and BXSB/MpJ‐Yaa) and the control strains (MRL/MpJ, BXSB/MpJ), respectively, is indicated (*P < 0·05). Values are shown as the means ± SE.
Figure 4
Figure 4
Proliferating cells in the mediastinal fat‐associated lymphoid clusters (MFALCs) of the mice. Immunohistochemistry for bromodeoxyuridine (BrdU) in MRL/MpJ (a), MRL/MpJ‐lpr (b), BXSB/MpJ (c), and BXSB/MpJ‐Yaa (d) mice. Fewer BrdU‐positive cells are visible within the MFALCs of MRL/MpJ and BXSB/MpJ mice (a, c) than in the MFALCs of MRL/MpJ‐lpr and BXSB/MpJ‐Yaa mice (b, d) at 4 months.
Figure 5
Figure 5
Histopathological features of the lungs in mice. Light microscopic photographs of haematoxylin & eosin (H&E)‐stained mouse lung sections of MRL/MpJ (a and b), MRL/MpJ‐lpr (c and d), BXSB/MpJ (e and f), and BXSB/MpJ‐Yaa (g and h), mice. The squares in (a), (c), (e) and (g) indicate the same areas as those in (b), (d), (f) and (h), respectively. A greater accumulation of mononuclear cells (asterisks), thicker interalveolar septa (arrows), congested blood vessels (arrowheads), and collapsed alveoli (ca) are visible in the lung tissue of MRL/MpJ‐lpr, BXSB/MpJ and BXSB/MpJ‐Yaa mice (c–h) than in that of MRL/MpJ mice (a and b). Bars = 300 μm (a, c, e and g). Bars = 50 μm (b, d, f and h).
Figure 6
Figure 6
Immune cells in the mouse lungs. (a–d) Light microscopic photographs showing immunohistochemical staining of the mouse lungs with CD3 (a), B220 (b), Iba1 (c), and Gr1 (d). Immunopositive cells (indicated by arrows) are present in the lungs of MRL/MpJ, MRL/MpJ‐lpr, BXSB/MpJ and BXSB/MpJ‐Yaa mice, and their appearance differs between the strains. In particular, the MRL/MpJ‐lpr and BXSB/MpJ‐Yaa mice show a greater abundance of positive cells within the infiltration area. Bars = 50 μm (a–d). Graph showing the average density of CD3‐positive (a), B220‐positive (b), Iba1‐positive (c), and Gr1‐positive (d) cells/unit area in all the lobes in the lungs of MRL/MpJ, MRL/MpJ‐lpr, BXSB/MpJ and BXSB/MpJ‐Yaa mice (e). Statistically significant difference, as determined using the Mann–Whitney U‐test; n = 5 mice for each strain, between autoimmune disease models (MRL/MpJ‐lpr and BXSB/MpJ‐Yaa) and the control strains (MRL/MpJ, BXSB/MpJ), respectively, is indicated by asterisk (*P < 0·05). Values are shown as the means ± SE.

References

    1. Zygmunt B, Veldhoen M. T helper cell differentiation more than just cytokines. Adv Immunol 2011; 109:159–96. - PubMed
    1. Rasmussen SB, Reinert LS, Paludan SR. Innate recognition of intracellular pathogens: detection and activation of the first line of defense. APMIS 2009; 117:323–37. - PubMed
    1. Andoniou CE, Andrews DM, Degli‐Esposti MA. Natural killer cells in viral infection: more than just killers. Immunol Rev 2006; 214:239–50. - PubMed
    1. Lodoen MB, Lanier LL. Natural killer cells as an initial defense against pathogens. Curr Opin Immunol 2006; 18:391–8. - PMC - PubMed
    1. Moro K, Yamada T, Tanabe M, Takeuchi T, Ikawa T, Kawamoto H et al Innate production of TH2 cytokines by adipose tissue‐associated c‐Kit+ Sca‐1+ lymphoid cells. Nature 2010; 463:540–4. - PubMed

Publication types

MeSH terms