

Review
doi: 10.1007/s12311-015-0724-2.
Consensus Paper: Cerebellar Development
Affiliations
- PMID: 26439486
- PMCID: PMC4846577
- DOI: 10.1007/s12311-015-0724-2
Item in Clipboard
Review
Consensus Paper: Cerebellar Development
Cerebellum.
2016 Dec.
Abstract
The development of the mammalian cerebellum is orchestrated by both cell-autonomous programs and inductive environmental influences. Here, we describe the main processes of cerebellar ontogenesis, highlighting the neurogenic strategies used by developing progenitors, the genetic programs involved in cell fate specification, the progressive changes of structural organization, and some of the better-known abnormalities associated with developmental disorders of the cerebellum.
Keywords: Cerebellum; Differentiation; Progenitors; Purkinje cells; Specification.
Conflict of interest statement
The authors declare that they have no competing interests.
Figures
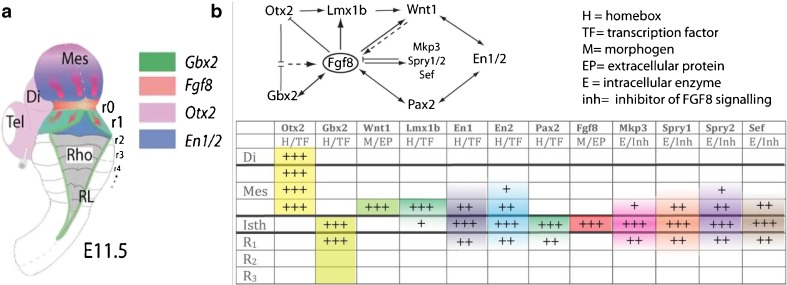
Topographical location of the mid-hindbrain boundary in the E11.5 mouse embryo. a Dorsal view of an E11.5 mouse embryo illustrating the isthmic constriction (isth) located between the mesencephalon and rhombomere 1 (r1). Rhombomeres r0 and r1, which give rise to the cerebellum, are highlighted in (a). The different color codes depict the expression pattern of the most important genes related to the morphogenetic activity and the capacity of the IsO. b Functional interactions (induction/inhibition) of genes that, together with Fgf8, are involved in the molecular maintenance of the isthmic region at E9.5. The table summarizes the expression intensity and expression range of genes along the AP axis of the neural tube, focusing on the isthmus: the level of RNAm expression for each gene is represented by the number of (+) and the color signifies the region of expression and the expression pattern (homogeneous or gradient), extending rostrally or caudally from the isthmus. Tel telencephalon, Di diencephalon, Mes mesencephalon. Modified from [4]
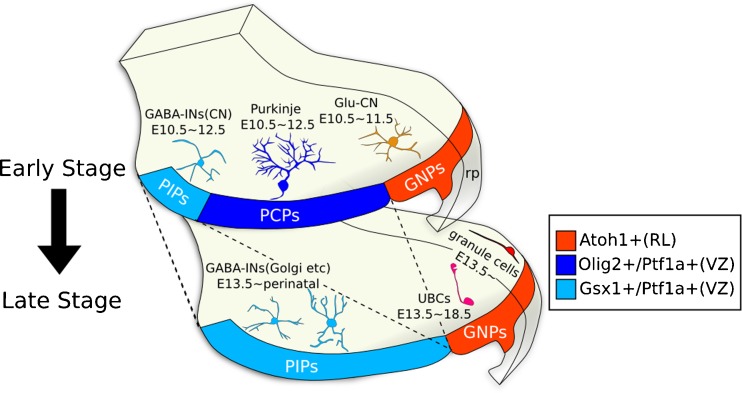
Progenitors and neurons in the cerebellum. Right is dorsal, left is ventral. GNPs glutamatergic neuron progenitors, PIPs Pax-2+ IN progenitors, PCPs Purkinje cell progenitors, rp roof plate, GABA-INs (CN) GABAergic interneurons in the cerebellar nuclei, Glu-CN glutamatergic neurons in the cerebellar nuclei
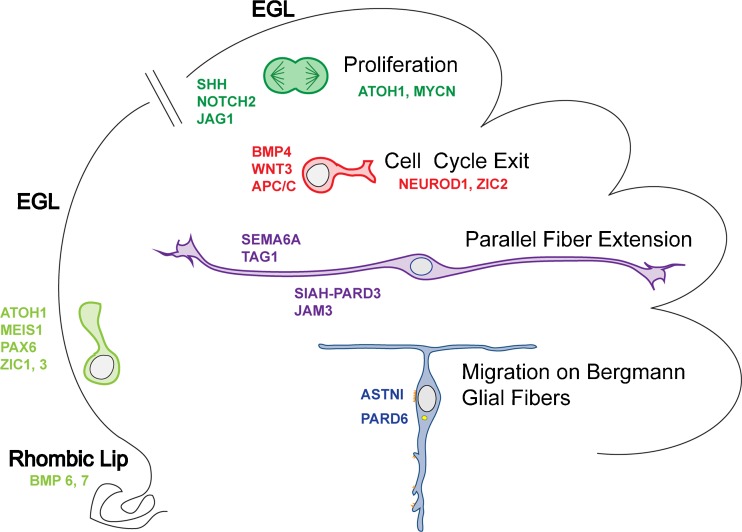
Granule cell neurogenesis and migration. GCPs arise in the RL of the cerebellar anlagen, after which early, proliferating GCPs (light green) migrate across the surface of the anlagen to form the EGL. After birth (broken line), GCPs located in the outer aspect of the EGL (dark green) express the transcription factors (TFs) MATH1/ATOH1 and NMYC, and proliferate in response to the mitogens Shh and JAG1 (NOTCH2). BMP4, WNT3, and APC/C inhibit GCP proliferation and promote cell-cycle exit. Postmitotic GCPs (red) express NEUROD1 and ZIC2. SIAH-PARD3 and JAM3, as well as SEMA6A, promote exit from the outer EGL where GCPs extend TAG1 positive PF axons (purple). Migrating neurons (blue) extend a leading process tipped with short filopodia and lamellipodia that enwraps the glial fiber (not shown). As the neuron moves, a broad interstitial junction (yellow) is formed beneath the cell soma that contains the neuron-glial adhesion protein ASTN1. PARD6, localized at the centrosome (yellow), coordinates the forward movement of the soma and centrosome through activation of Myosin II-Actin motors that pull the cell forward. EGL external granular layer
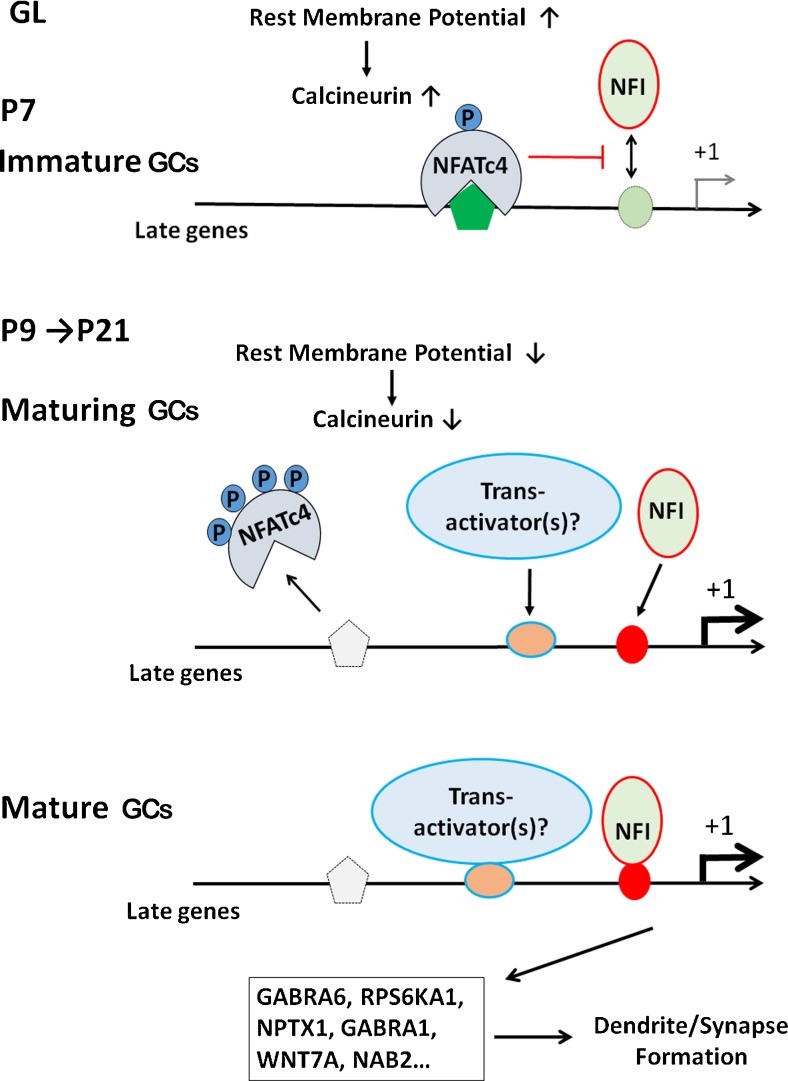
Voltage-sensitive regulation of NFI temporal occupancy in maturing GCs. In the immature GL of the cerebellum (P7), a more depolarized resting membrane potential elevates calcineurin (CaN) activity, leading to NFATc4 nuclear localization and binding to NFI-late genes. NFATc4 occupancy represses late-gene binding and activation by NFI, which is present in the nucleus throughout CGN development. As the cerebellum matures (P9–P21), the resting membrane potential becomes more hyperpolarized and CaN activity and NFATc4 nuclear localization and promoter occupancy decline. This becomes permissive for NFI binding to and activation of late genes in more mature GCs within the GL, promoting dendrite and synapse formation. NFI temporal occupancy of late genes may also be stimulated subsequent to NFATc4 departure by the binding and/or activity of trans-activators that also regulate late gene expression. GL granular layer, GCs granule cells
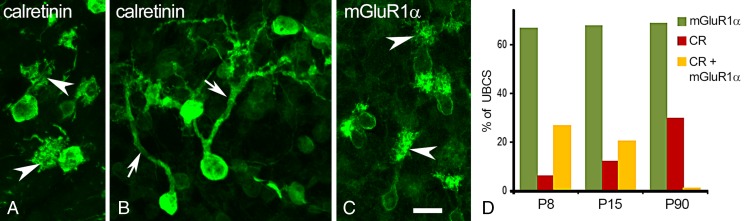
UBCs visualized by cell type specific markers. a The typical morphological features of UBCs; a short thick dendritic shaft and brush-like dendrioles (arrowheads). Calretinin immunolabeling of a P28 mouse cerebellum. b, c Images obtained from long-term organotypic mouse cerebellar cultures. In this experiment, the cerebellar nodulus was isolated at P8 and kept in culture for 22 days. During this time, most of the CR-positive type I UBCs (b) instead of a dendritic brush have long, branching processes (arrows). Under the same condition, all mGluR1α-positive type II UBCs develop distinct brushes (arrowheads). Scale bar in (c) = 10 μm and applies to panels (a)–(c). d Developmental regulation of rat cerebellar UBC chemotype. The UBC fraction expressing only mGluR1α (green bars) remains about the same between P8 and P90. However, at P8, a substantial fraction of UBCs expresses both calretinin and mGluR1α (yellow bars). These double labeled cells become rare at P90. By P90, UBCs either express calretinin (type I UBCs) or mGluR1α (type II UBCs). The red bars represent the UBC fraction expressing only calretinin
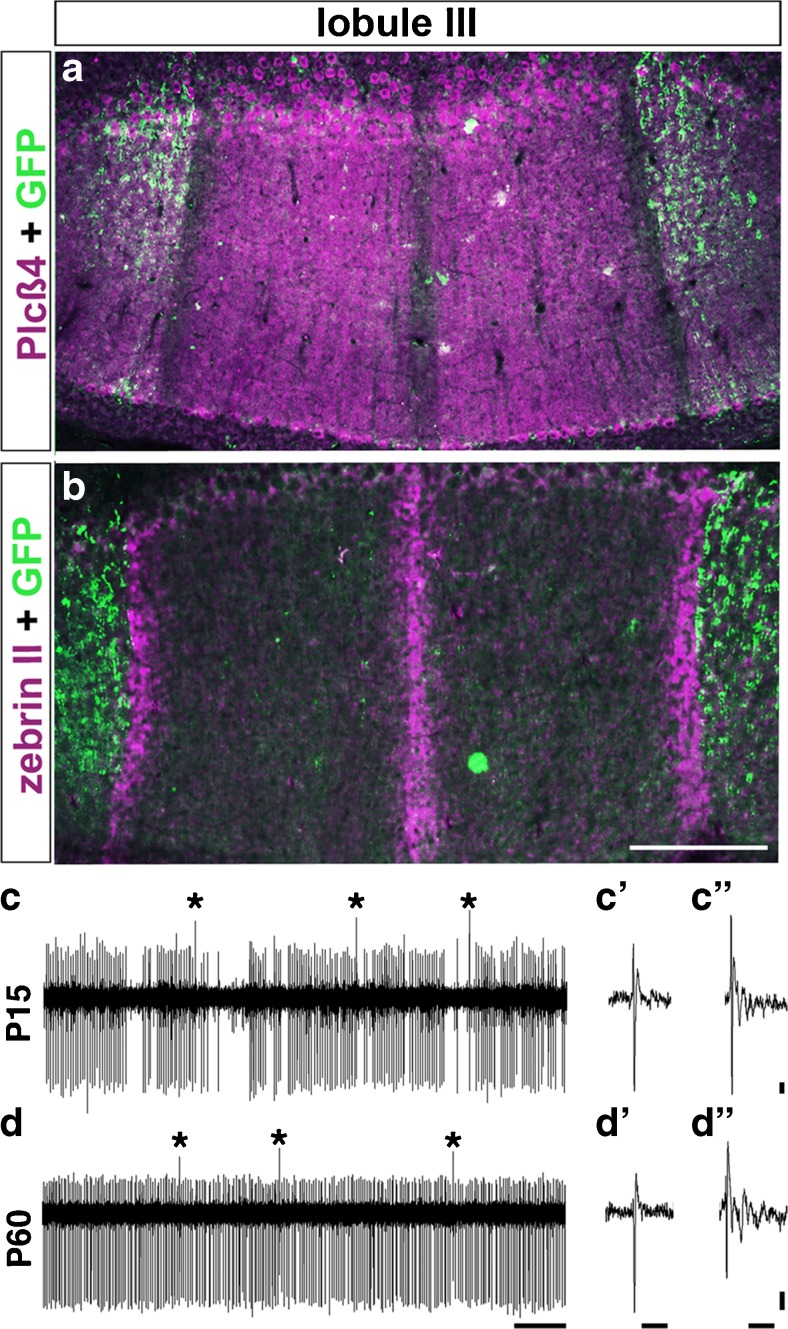
Purkinje cell organization and firing activity can define how cerebellar circuit topography is assembled. a CF zones, which were labeled with the transgenic marker Npy-GFP (green), are arranged in broadly spaced parasagittal stripes from the midline and overlap with PC zones that are immunopositive for the marker PLCβ4 (magenta). b
Npy-GFP-labeled CF zones (green) are restricted according to PC stripe boundaries and do not cross zebrinII-immunopositive stripes (magenta). Scale bar = 250 μm. c At P15 in mouse, PCs fire simple spikes with a relatively low firing rate and an irregular “burst” pattern (as shown in sample trace). c′ An example of a simple spike at P15. cʺ An example of a complex spike at P15. d PC activity is dynamically sculpted during key events of circuit formation, until a mature firing pattern (as shown in sample recording trace at P60) is established at about 4 weeks of age. d′ An example of a simple spike at P60. d′’ An example of a complex spike at P60. Scale bar in d: x = 0.5 s. Scale bars in c′, c′′, d′, and d′′: x = 5 ms, y = 2 mV. (a) and (b) were adapted from [191]. (c) and (d) were adapted from [214]
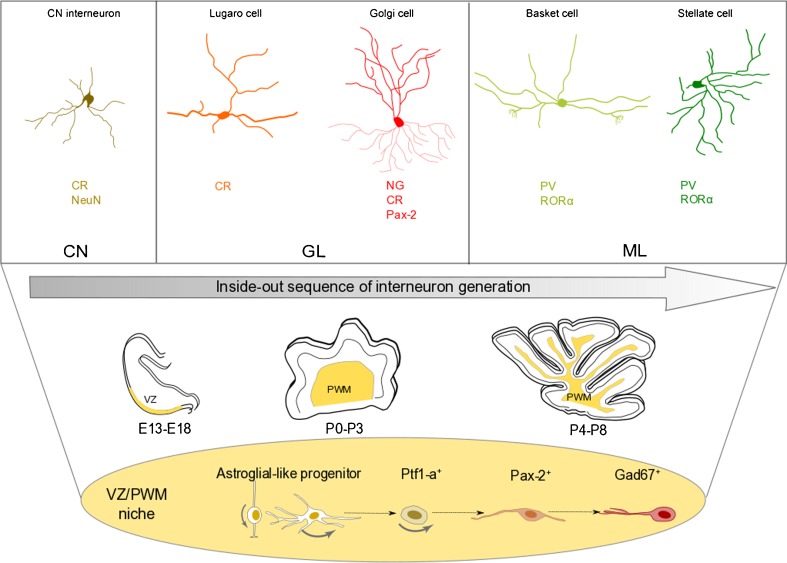
Production of inhibitory interneurons. Different subtypes of GABAergic INs are present at different levels of the cerebellar cortex and CN and are characterized by the expression of specific markers. All these cells are produced through an inside-out sequence from common Pax-2+ progenitors residing in the VZ/PWM niches during cerebellar development. Interneuron progenitors derive from astroglial-like bipotent progenitors, which also give rise to parenchymal astrocytes (see text). CN deep cerebellar nuclei, GL granular layer, ML molecular layer, VZ ventricular zone, PWM prospective white matter
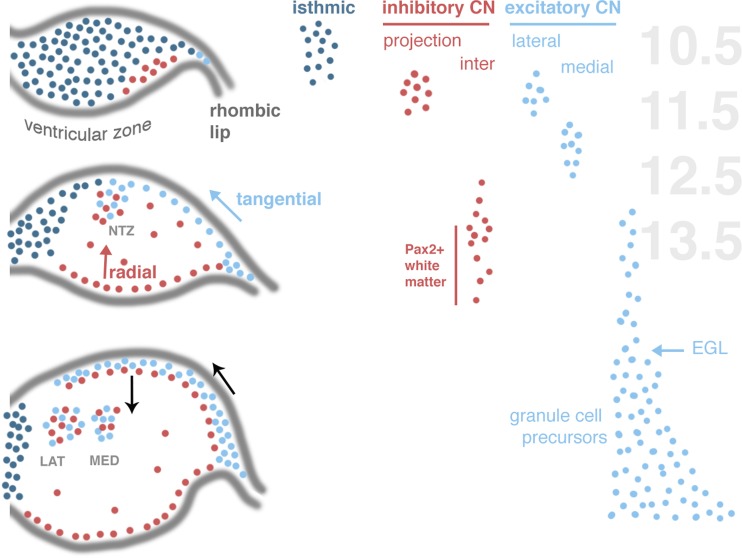
The assembly of cerebellar nuclei requires the complex spatiotemporal integration of neurons from Atoh1+ and Ptf1a+ lineages. Schematic profiles to the left plot the distribution of the Atoh1+ lineage (FGF-dependent, dark blue; BMP-dependent, light blue) and Ptf1a+ lineage (red) in the developing embryo (after [456]). To the right, the approximate timeline of different neuron groups is shown next to embryonic days in mouse. Light-blue and red arrows indicate tangential and radial migration of, respectively, excitatory and inhibitory CN neurons. Black arrows show the direction of the CGPs. NTZ nuclear transitory zone, CN deep cerebellar nuclei, EGL external granular layer, lat lateral, med medial
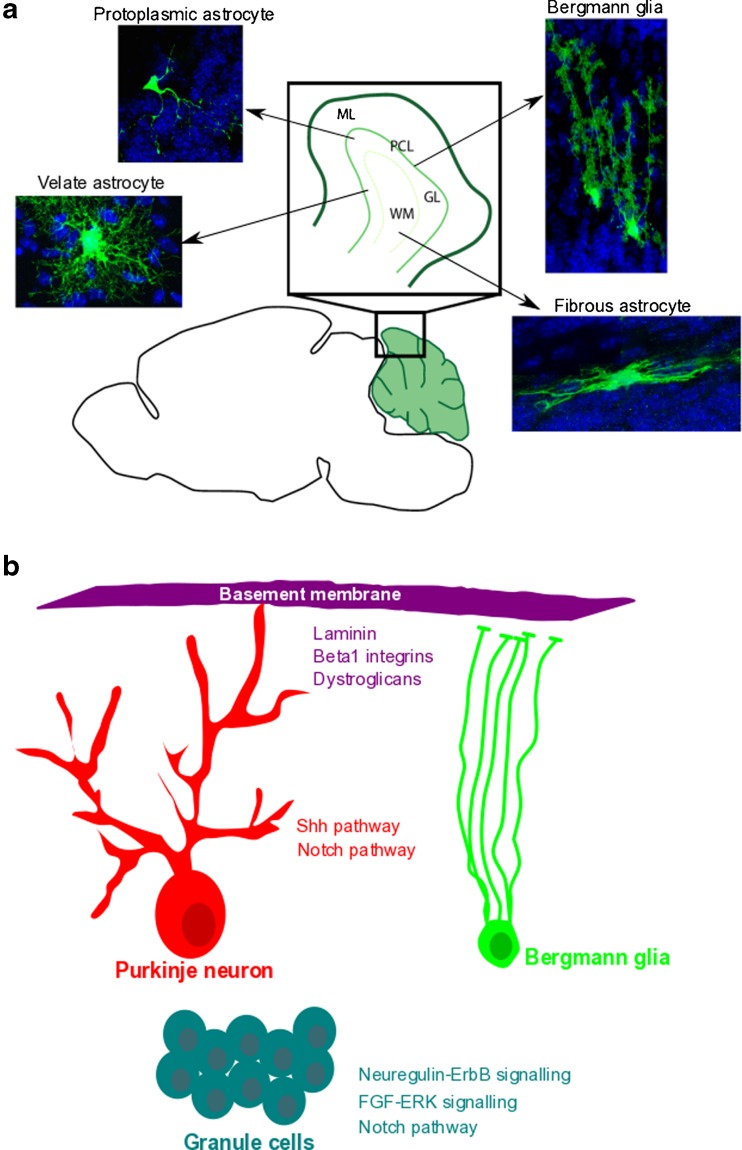
Astrocyte morphological heterogeneity in the mouse cerebellum and factors promoting Bergmann glia maturation. a Distinct morphologies define astroglial cell subtypes in the adult mouse cerebellum. b Components of the cerebellar microenvironment [, –459] regulate signaling pathways that modulate the acquisition and maintenance of the BG phenotype. ML molecular layer, PCL Purkinje cell layer, GL granular layer, WM white matter
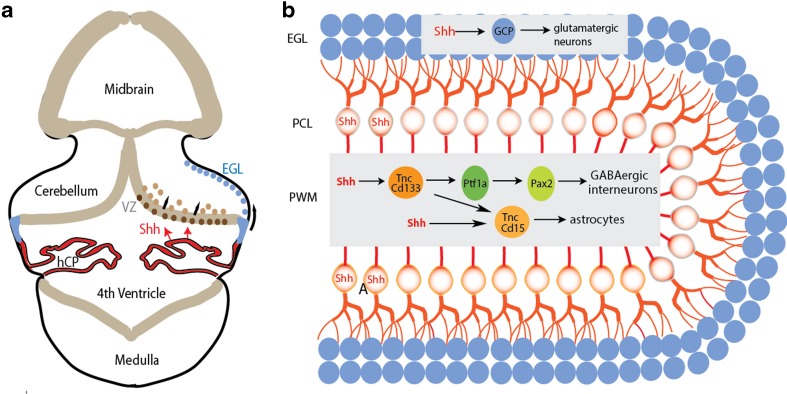
Shh regulates the expansion of functionally diverse neuronal and glial cell types from spatially restricted precursors in the cerebellum. a Schematic illustration of a coronal section of the midbrain-cerebellum-medulla region at E14.5. Beige regions represent the VZ neuroepithelium. The hChP epithelium, depicted in red, secretes Shh protein into the fourth ventricle which is then delivered to the cerebellar VZ to promote the proliferation of its resident radial glial cells (brown). The nascent EGL is shown in blue (modified from [45]). b PC-secreted Shh simultaneously stimulates proliferation of GCPs and stem-like astroglia (Tnc+, CD133+) located respectively at the distant EGL and PWM. The PWM niche is comprised of lineage-related, but molecularly and functionally divergent progenitor subpopulations that descend from common astroglia (modified from [33]). VZ ventricular zone, EGL external granular layer, PCL Purkinje cell layer, PWM prospective white matter, GCP granule cell progenitor
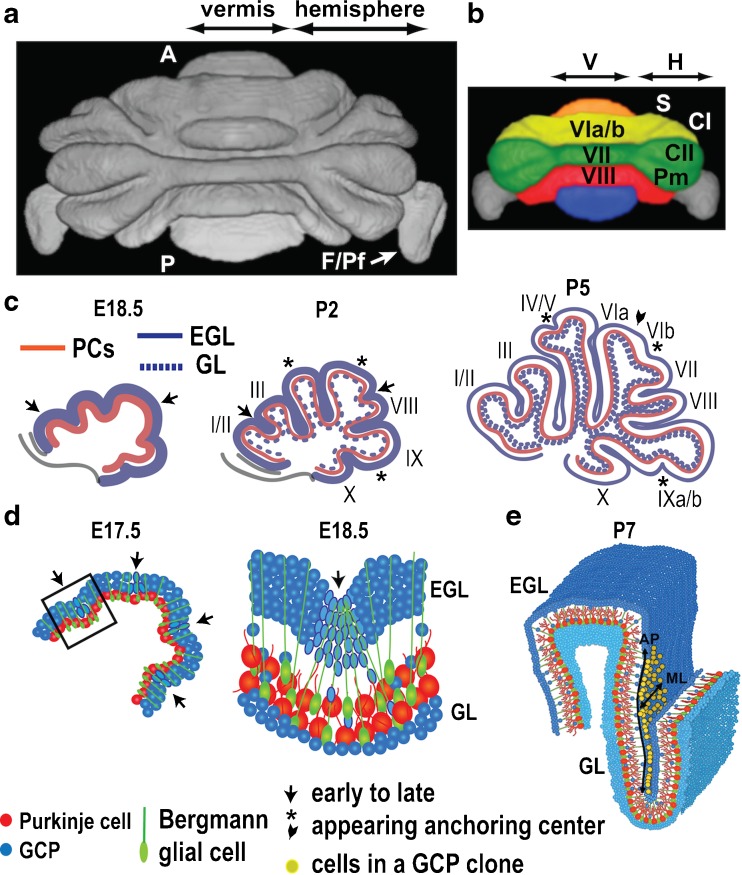
Cerebellar foliation. a 3D rendering of MRI image of mouse cerebellum segmented at the EGL surface. A anterior, P posterior, F/Pf flocculus/paraflocculus. b Lobules that are continuous between the medial vermis (V) and lateral hemispheres (H) are color-coded. (a) and (b) provided by Kamila Szulc and Daniel Turnbull. c New anchoring centers and associated fissures form on particular days as the folia grow outward (modified from [64]). d Changes occur in the PC, GCP shape, and BG fiber projections in anchoring centers. Sagittal sections through the vermis (c, d), with lobules indicated in roman numerals [300]. S simplex lobule, CI/II Crus I and II of the ansiform lobule, Pm paramedian lobule. e Clonally derived GCPs (yellow) do not cross the bases of fissures and disperse more along the AP axis than medial-lateral (ML) axis and have a greater cell number in long lobules compared to short lobules (provided by Emilie Legué). EGL external granular layer, GL granular layer, GCP granule cell progenitor
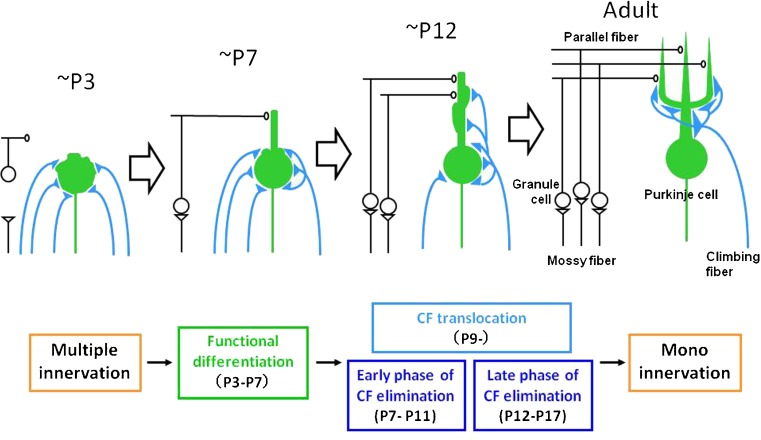
Diagram showing postnatal development of CF-PC synapse. Until P3, synaptic strengths of multiply-innervating CFs are relatively uniform. From P3 to P7, one CF is selectively strengthened, which is termed the phase of “functional differentiation.” From P9 on, the strongest (“winner”) CF undergoes translocation to growing dendrites (the phase of CF translocation). On the other hand, weaker (“loser”) CFs remain around the soma and are eventually eliminated in two distinct phases (the “early and late phases of CF elimination”; from [340]). CF climbing fiber
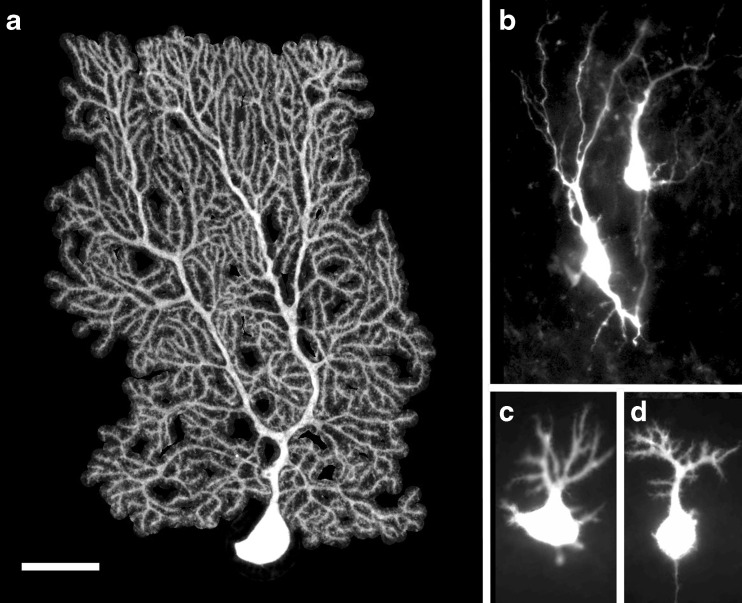
Dendritic differentiation of Purkinje cells. PCs were filled with biocytin using patch-clamp pipette and revealed by incubation with streptavidin coupled to fluorochrome cy3 from 2-month-old (a), newborn (b), 5-day-old (c), and 7-day-old (d) mice. (a) was imaged with a confocal microscope and its morphology reconstructed with Neuronstudio software. The tree model obtained was used as a mask to extracted single PCs from the background image. (b, c) and (d) were imaged with an epifluorescence microscope. Bar, 30 μm
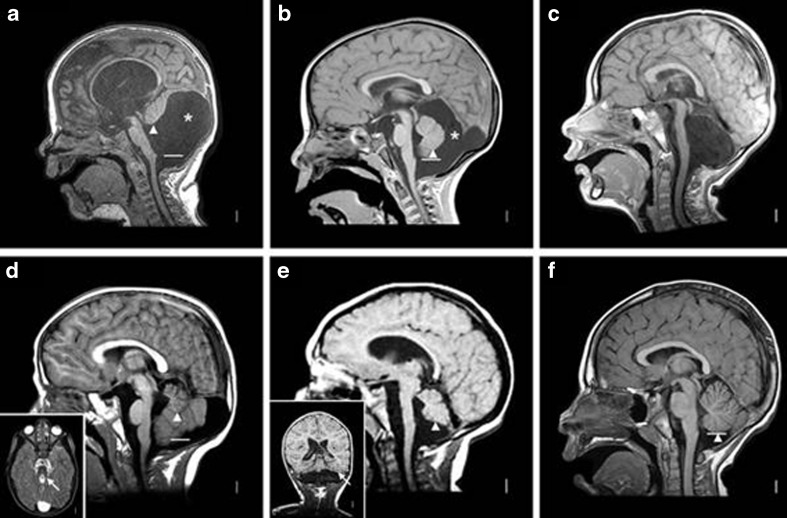
Brain imaging in mid-hindbrain malformations. T1-weighted midline sagittal magnetic resonance images show the key features of classic DWM (a), cerebellar vermis hypoplasia with mega-cisterns magna (b), complete cerebellar agenesis (c), molar tooth malformation seen in JSRD (d), pontocerebellar hypoplasia (e), and normal (f). The solid white lines in most images mark the level of the obex, while the arrowheads point to the lower edge of the vermis (both landmarks are absent in c). The asterisk denotes an enlarged posterior fossa. In (a), the vermis is small and rotated far upwards, the fourth ventricle is enlarged into a cyst-like structure, and the posterior fossa is greatly enlarged causing an elevated tentorium. In (b), the vermis is small but located in the anatomic position, but the posterior fossa is again greatly enlarged. A posterior extension of the cyst appears to scallop the inner table of the skull. In (c), the brainstem is thin without any landmarks other than the tectum, and no cerebellum is seen. In (d), the vermis is very small but located in the correct anatomic position, with portions of the cerebellar hemispheres seen beneath. The inset shows the associated “molar tooth” sign (arrow). In (e), the brainstem is thin but the obex can just be seen, and the vermis is moderately small. The even more “pancake-like” flattening of the hemispheres is shown in the inset (arrow)
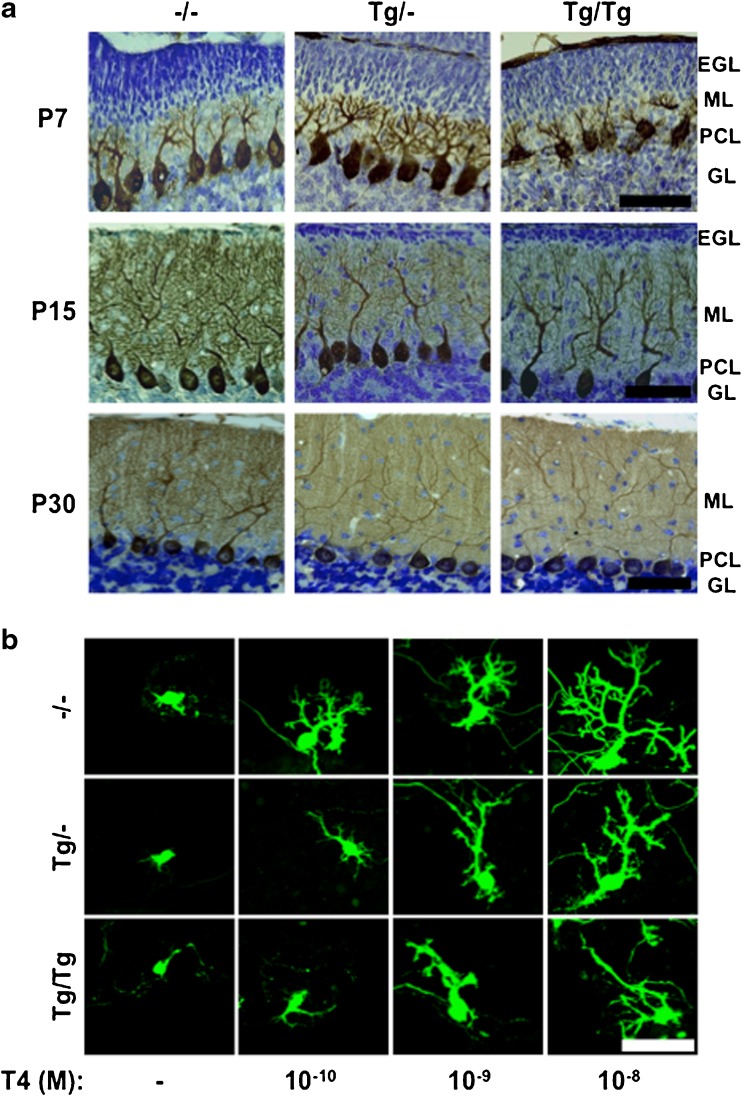
Morphological alterations in the postnatal cerebellum by mutant TR in the Purkinje cell. Mutant human TR, which inhibits normal TR action, is expressed in PCs by using the L7/Pcp2 promoter. a Sagittal sections of the cerebellar vermis at P7, P15, and P30 were stained with mouse anti-calbindin-D28K (1:1000) and cresyl violet. Note that the EGL is seen in He and Ho mice on P15. EGL external granular cell layer, ML molecular layer, PCL Purkinje cell layer, GL granular layer, Tg/- heterozygote, Tg/Tg homozygote, −/− wild-type. Bar, 50 μm. b Changes in PC dendrite arborization in primary cerebellar culture. After 17 days in vitro, with or without T4, the cells were fixed, and immunocytochemistry was carried out using the anti-calbindin antibody to visualize PCs. Bars, 50 μm. Tg/- heterozygote, Tg/Tg homozygote, −/− wild-type. Adapted with permission from [418]. EGL external granular layer, ML molecular layer, PCL Purkinje cell layer, GL granular layer
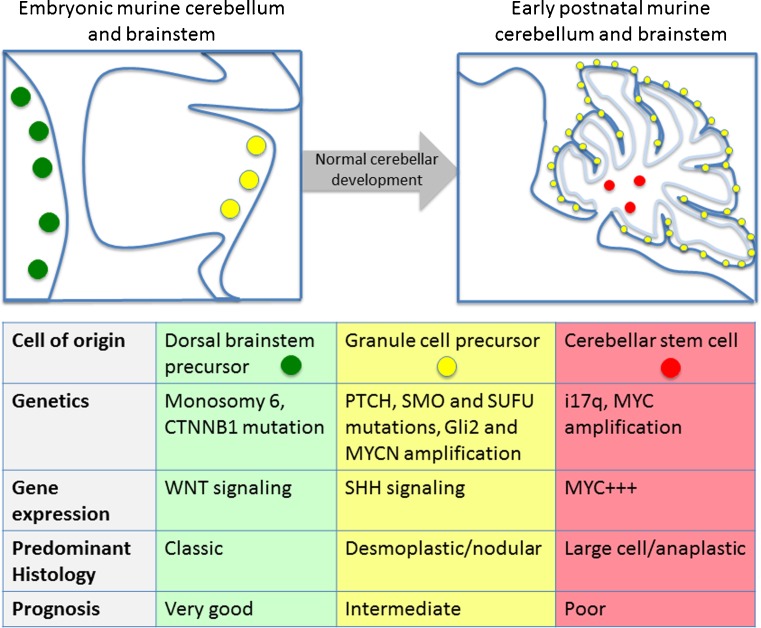
Medulloblastoma subgroups and their cells of origin. The schematic shows the embryonic and early postnatal murine cerebellum and brainstem with the spatial and temporal locations of likely cells of origin of MB subgroups (green dots represent dorsal brainstem precursor cells, yellow dots represent GCPs, red dots represent cerebellar stem cells). The table shows the genetics, gene expression profile, predominant histology, and prognosis of the MB subgroups for each of these cells of origin
References
-
- Sotelo C, Wassef M. Cerebellar development: afferent organization and Purkinje cell heterogeneity. Philos Trans R Soc Lond B Biol Sci. 1991;331(1261):307–13. - PubMed
-
- Echevarría D, Vieira C, Gimeno L, Martínez S. Neuroepithelial secondary organizers and cell fate specification in the developing brain. Brain Res Brain Res Rev. 2003;43:179–91. - PubMed
-
- Joyner AL, Liu A, Millet S. Otx2, Gbx2 and Fgf8 interact to position and maintain a mid-hindbrain organizer. Curr Opin Cell Biol. 2000;12:736–41. - PubMed
-
- Martinez S, Wassef M, Alvarado-Mallart RM. Induction of a mesencephalic phenotype in the 2-day-old chick prosencephalon is preceded by the early expression of the homeobox gene engrailed. Neuron. 1991;6:971–81. - PubMed
Publication types
MeSH terms
Grants and funding
- R01 NS080390/NS/NINDS NIH HHS/United States
- G0800020/MRC_/Medical Research Council/United Kingdom
- R37 MH085726/MH/NIMH NIH HHS/United States
- P30 CA008748/CA/NCI NIH HHS/United States
- R01 NS092096/NS/NINDS NIH HHS/United States
- R01 NS072441/NS/NINDS NIH HHS/United States
- R01 NS050375/NS/NINDS NIH HHS/United States
- U54 HD083092/HD/NICHD NIH HHS/United States
- R01 NS095733/NS/NINDS NIH HHS/United States
- R01 NS063047/NS/NINDS NIH HHS/United States
- R01 NS089664/NS/NINDS NIH HHS/United States
- R01 NS042205/NS/NINDS NIH HHS/United States
LinkOut - more resources
Full Text Sources
Other Literature Sources
Molecular Biology Databases
