. 2015 Oct 6:6:8518.
doi: 10.1038/ncomms9518.

Neuronal activity regulates remyelination via glutamate signalling to oligodendrocyte progenitors

Affiliations

Neuronal activity regulates remyelination via glutamate signalling to oligodendrocyte progenitors

Hélène O B Gautier et al. Nat Commun. .

Abstract

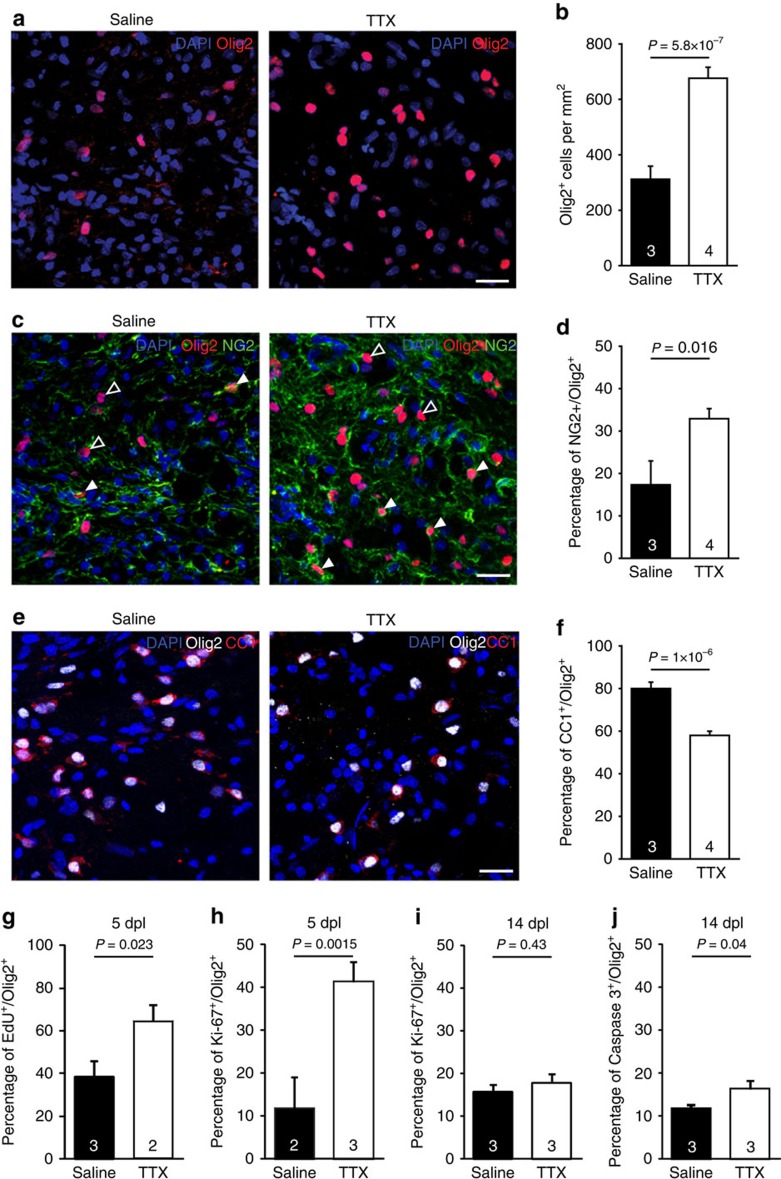
Myelin regeneration can occur spontaneously in demyelinating diseases such as multiple sclerosis (MS). However, the underlying mechanisms and causes of its frequent failure remain incompletely understood. Here we show, using an in-vivo remyelination model, that demyelinated axons are electrically active and generate de novo synapses with recruited oligodendrocyte progenitor cells (OPCs), which, early after lesion induction, sense neuronal activity by expressing AMPA (α-amino-3-hydroxy-5-methyl-4-isoxazolepropionic acid)/kainate receptors. Blocking neuronal activity, axonal vesicular release or AMPA receptors in demyelinated lesions results in reduced remyelination. In the absence of neuronal activity there is a ∼6-fold increase in OPC number within the lesions and a reduced proportion of differentiated oligodendrocytes. These findings reveal that neuronal activity and release of glutamate instruct OPCs to differentiate into new myelinating oligodendrocytes that recover lost function. Co-localization of OPCs with the presynaptic protein VGluT2 in MS lesions implies that this mechanism may provide novel targets to therapeutically enhance remyelination.


Figures

Figure 1
Figure 1. The toxin-induced demyelination model.
(a) Demyelinated lesions were created by injection of 0.01% EB into the rat CCP (Crb, cerebellum). (b) Acute cerebellum and brainstem section containing a lesion in the CCP (delineated by dashed lines). The needle track going through the cerebellum is visible on the left of the vertical dashed line. Scale bar, 2 mm. (c) Fixed section after compound action potential recording, the lesion (delineated by dashed lines) is visible with 4,6-diamidino-2-phenylindole (DAPI) staining due to increased macrophages and OPC infiltration; the location of stimulating (stim, dark blue DiD) and recording (rec, red DiI) electrodes are marked. Scale bar, 200 μm. (df) TTX-subtracted compound action potential recordings. (d) At p19, peaks for both myelinated (M) and non-myelinated axons (NM) were detected. (e,g) At 7 dpl, demyelinated axons (grey trace) have a peak latency similar to non-myelinated axons, whereas (f,g) when remyelinated at 21 dpl (grey trace) the peak latency is similar to adult myelinated axons (black trace). Numbers of brain slices are shown on bars. Data represent means±s.e.m. The P-value is from Holm–Bonferroni post-hoc test after a one-way ANOVA (P=0.003). (h) Timeline of GFAP expression in CCP lesions at 3, 7, 14 and 21 dpl; scale bar, 200 μm, (i) Magnified images from h of the regions indicated by the white box. (j) Timeline of oligodendrocyte lineage cells in the lesion, with Olig2+ and NG2+ OPCs, and (k) CC1+ oligodendrocytes. Scale bars, 20 μm. (l) Diagram showing the peak appearance of oligodendrocytes, OPCs and astrocytes in the CCP following EB lesion. The red shaded area marks the timing of the EB injection and the onset of demyelination with the associated death of all nucleated cell types within the lesion. Re-colonization of the lesion occurs as follows: OPCs arrive in the lesion and proliferate before differentiating into oligodendrocytes. Astrocytes start to repopulate the lesion in week 2. The orange shading indicates the remyelination process; darker orange corresponds to more remyelination.
Figure 2
Figure 2. Glutamate signalling in remyelinating lesions.
(a) Voltage-clamped OPC, filled with lucifer yellow (LY) and identified after recording by labelling for NG2 and Olig2 (scale bar, 10 μm) (b) with voltage-gated sodium currents (20 mV steps from −74 mV; inset: leak subtracted trace). (c) Response of a recruited OPC to 100 μM glutamate (Glu). (d) Mean peak current for glutamate-evoked currents in recruited OPCs (a specimen trace shown in c) and macrophages (eg). The glutamate-evoked current is unaffected by 200 μM AP5 (P=0.4, n=6) but inhibited by 25 μM NBQX (P=5 × 10⁻⁶, n=7, one sample t-test). (h,i) AMPA (20 μM), kainate (30 μM) and NMDA (60 μM) evoked inward currents in OPCs. (j) Proportion of OPCs with AMPA-evoked currents (in the first week post lesion, 6 out of 6 cells recorded showed AMPA-evoked currents; in the second week, 13 out of 13 cells responded to AMPA) and NMDA-evoked currents; NMDA-evoked currents only became detectable in OPCs at the start of the second week post lesion induction, P=0.026 (χ2-test with Yates correction, compared with the first week; in the first week, 0 out of 8 cells recorded had detectable NMDA-evoked currents; for the second week, 8 out of 14 had detectable NMDA receptor responses). (k) Current–voltage relationship (voltage ramp from −134 to +26 mV) for glutamate-evoked current in OPCs (n=7). (ln) Glutamate-evoked [Ca2+]i rises in OPCs but not in macrophages (P=6.2 × 10⁻⁵, Welch's corrected unpaired t-test, n=11 and 6 cells, respectively, from 3 independent experiments) measured by taking the fluorescent intensity ratio of Fluo-4/FuraRed (low Ca2+: red; high Ca2+: green). Scale bar, 10 μm. Numbers of cells are indicated on bars, data represent means±s.e.m. in d,g,i,n.
Figure 3
Figure 3. OPCs in remyelinating lesions receive synaptic inputs.
(a) Recruited OPCs receive synaptic input from demyelinated axons (15/45 cells; inset: specimen of a fitted synaptic event), similar to (b) OPCs at the start of developmental myelination in the CCP of NG2-EYFP knock-in mice (seven out of eight cells recorded; inset: specimen of a fitted synaptic event), whereas (c) after myelination of the CCP is complete OPCs barely receive synaptic inputs (one out of eight cells recorded; P=0.01, χ2-test with Yates correction compared with young CCP). (d) Average frequency of detected synaptic input in OPCs in lesion (5–8 dpl), in the CCP at the start of myelination (p5–8 NG2-EYFP mice) and once myelination is complete (p98–105 NG2-EYFP mice). Data are means±s.e.m., significance tested by unpaired t-test, n=6. The circles underneath the bar graph depict the proportion of OPCs with (black) and without (white) synaptic inputs. (e) The synaptic inputs are blocked by 1 μM TTX. (f,g) α-Latrotoxin (α-LTX; 1 nM) increases the frequency of synaptic events detected in OPCs (P=0.02, paired Student's t-test, all cell numbers are indicated on each bar graph, data are means±s.e.m.). (h) The presynaptic marker VGluT2 is present in the adult cerebellar grey matter (GM), but not in normal white matter (WM). Scale bar, 50 μm. (i,j) At 7 dpl, NG2 and VGluT2 staining are increased in demyelinating lesions. Scale bar, 500 μm. (k) Neurofilament (NF) is equally detectable in normal and lesioned white matter. Scale bar, 200 μm. (ln) OPCs establish synapses with demyelinated axons. Scale bar, 20 μm. (o) Magnifications of the cell in ln. Scale bar, 5 μm. (p) Iso-surface 3D deconvolution of the cell in ln generated using Imaris software, showing synapses located on the OPC processes. Scale bar, 20 μm. (q) Top: synaptic vesicles along a demyelinated axon; bottom: OPC extending processes towards VGluT2 vesicles. Scale bars, 5 μm.
Figure 4
Figure 4. Remyelination is dependent on neuronal activity.
Toluidine blue-stained semi-thin sections of CCP 21 dpl, infused with saline, or from 3 dpl (a), ω-conotoxin (11 μM; blocking neurotransmitter vesicular release), (c) NBQX (250 μM; blocking AMPA/kainate receptors), or (e) TTX (50 nM) (scale bar, 20 μm) and (b,d,f) scored by blinded ranking analysis; higher ranks represent more remyelination, each symbol represents one animal, P-values are from Mann–Whitney U-test. (gj) High-magnification images of (g) normal-appearing white matter and (hj) saline (left), and (h) ω-conotoxin-, (i) NBQX- and (j) TTX (right)-infused lesion. Scale bar, 5 μm.
Figure 5
Figure 5. Remyelination depends on activation of AMPA receptors within the lesion at early timepoints.
(a) TTX-subtracted compound action potential recordings from saline (black trace)- and NBQX-treated lesions from 21 dpl (grey trace). (b) Average conduction speed for the latency peak associated with myelinated axons (M peak) and non-myelinated axons (NM), for saline- and NBQX-treated samples (data from four slices for each condition). Circles underneath depict the proportion of recorded lesions with the latency peak detected (white fraction: no detection of peak; black/grey: proportion of lesion where the latency peak is detected in saline/NBQX-treated lesions). (c) The average latency peak area reflects the number of axons contributing to each peak. It is noteworthy that there are fewer axons contributing to the latency peak associated with myelinated axons and far more contributing to the peak associated with demyelinated axons in NBQX-treated samples (P-values are from unpaired t-test). (d) The timeline diagram of the lesion remyelination process (Fig. 1l), shaded with grey box to indicate when NBQX infused at later timepoints is present. (e) Toluidine blue-stained semi-thin sections of CCP 21 dpl, infused with saline or (f) NBQX (250 μM; blocking AMPA/kainate receptors) from 10 dpl (scale bar, 10 μm) (g) scored by blinded ranking analysis; higher ranks represent more remyelination, each symbol represents one animal, P-values from Mann–Whitney U-test.
Figure 6
Figure 6. Neuronal activity regulates remyelination.
(a,b) Ultrastructural analysis reveals that fewer axons are remyelinated (green) in lesions treated with TTX (from 3 dpl) compared with saline-treated lesions; unmyelinated axons are coloured in yellow. Scale bar, 1 μm. (c,d) The g-ratio is larger in TTX-treated samples than in saline-treated lesions. Number of animals are indicated on each bar graph. Data represent mean±s.e.m. P-values are from unpaired t-test for b,c. For d, each symbol represents an axon and P-value from analysis of covariance (ANCOVA). (e,f) Blocking synaptic input induces a shift in the cumulative frequency distribution of g-ratio and axonal diameter, P-values from Kolmogorov–Smirnov test.
Figure 7
Figure 7. Neuronal activity regulates OPCs differentiation.
(a,b) At the time of differentiation (14 dpl), there was an increase in the number of Olig2+ (marking all cells of the oligodendrocyte lineage) cells in TTX-treated lesions (from 3 dpl) compared with saline controls due to (c,d) a higher proportion of Olig2+ cells that were NG2+ OPCs (filled arrowheads) and (e,f) a reduced proportion of Olig2+ cells that were CC1+ differentiating oligodendrocytes (open arrowheads), indicating that synaptic input is needed for efficient differentiation. (g,h) At 5 dpl, there are more proliferating Olig2+ cells in TTX-treated lesions, as shown by EdU incorporation (g) and by Ki-67 staining (h). (i) No change in proliferation was detected by Ki-67 staining in Olig2+ cells between TTX and saline-treated lesions at 14 dpl. However, at 14 dpl there is an (j) increase in apoptotic Olig2+ cells labelled for caspase 3. All n numbers represent animals (three sections per animal) and are indicated on each bar graph. Data are means±s.e.m. P-values are from unpaired t-test, Welch's corrected for d and f. Scale bars, 20 μm.
Figure 8
Figure 8. Demyelinated axons in human MS lesions upregulate synaptic proteins.
(a) MOG staining in a human MS brain tissue sample, clearly demonstrating a demyelinated forebrain white matter lesion. (b) VGluT2 is highly expressed in human MS lesions, compared with surrounding normal-appearing white matter. (c) Overlay of a,b. Scale bar, 200 μm. (d) Magnified image from c of the region indicated by the white box. Scale bar, 50 μm. (e) There is a sixfold increase in VGluT2 particle numbers in lesion compared with white matter, n=5 patients (one lesion per patient). Data represents mean±s.e.m. P-value from unpaired t-test. (f) VGluT2 puncta are in close proximity to NG2+ OPCs. Scale bar, 20 μm. (g) Iso-surface 3D deconvolution of an OPC in human MS lesion generated using Imaris software, showing synapses located on the OPC processes. Scale bar, 5 μm.

References

    1. Dawson M. R. L., Polito A., Levine J. M. & Reynolds R. NG2-expressing glial progenitor cells: an abundant and widespread population of cycling cells in the adult rat CNS. Mol. Cell. Neurosci. 24, 476–488 (2003) . - PubMed
    1. Duncan I. D., Brower A., Kondo Y., Curlee J. F. Jr. & Schultz R. D. Extensive remyelination of the CNS leads to functional recovery. Proc. Natl Acad. Sci. USA 106, 6832–6836 (2009) . - PMC - PubMed
    1. Zawadzka M. et al.. CNS-resident glial progenitor/stem cells produce Schwann cells as well as oligodendrocytes during repair of CNS demyelination. Cell Stem Cell 6, 578–590 (2010) . - PMC - PubMed
    1. Fancy S. P. J., Chan J. R., Baranzini S. E., Franklin R. J. M. & Rowitch D. H. Myelin regeneration: a recapitulation of development? Annu. Rev. Neurosci. 34, 21–43 (2011) . - PubMed
    1. Wolswijk G. Chronic stage multiple sclerosis lesions contain a relatively quiescent population of oligodendrocyte precursor cells. J. Neurosci. 18, 601–609 (1998) . - PMC - PubMed

Publication types

MeSH terms