. 2015 Oct 14;18(4):409-23.
doi: 10.1016/j.chom.2015.09.003. Epub 2015 Oct 1.

Cell Surface Proteomic Map of HIV Infection Reveals Antagonism of Amino Acid Metabolism by Vpu and Nef

Affiliations

Cell Surface Proteomic Map of HIV Infection Reveals Antagonism of Amino Acid Metabolism by Vpu and Nef

Nicholas J Matheson et al. Cell Host Microbe. .

Abstract

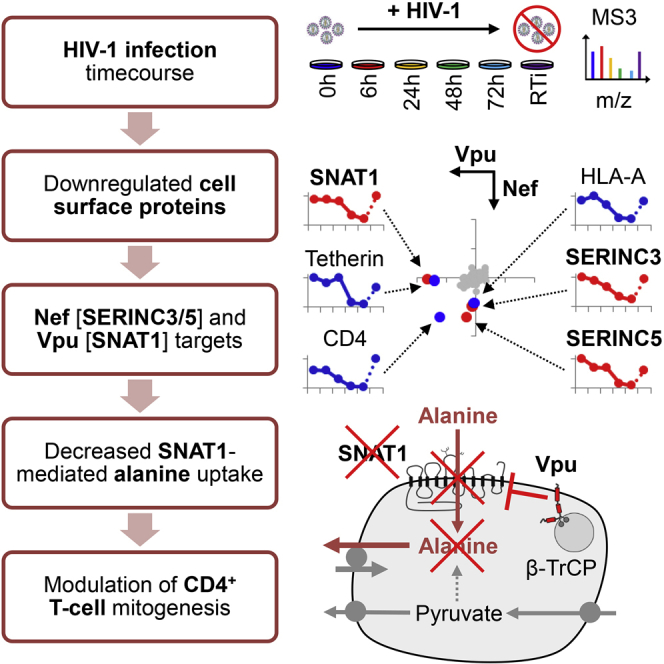
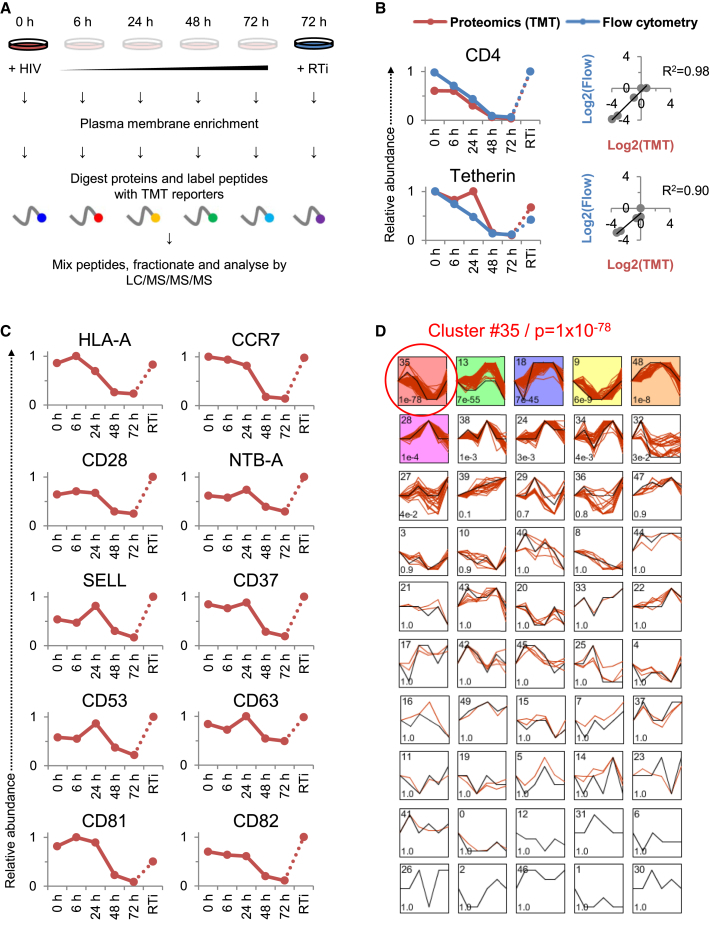
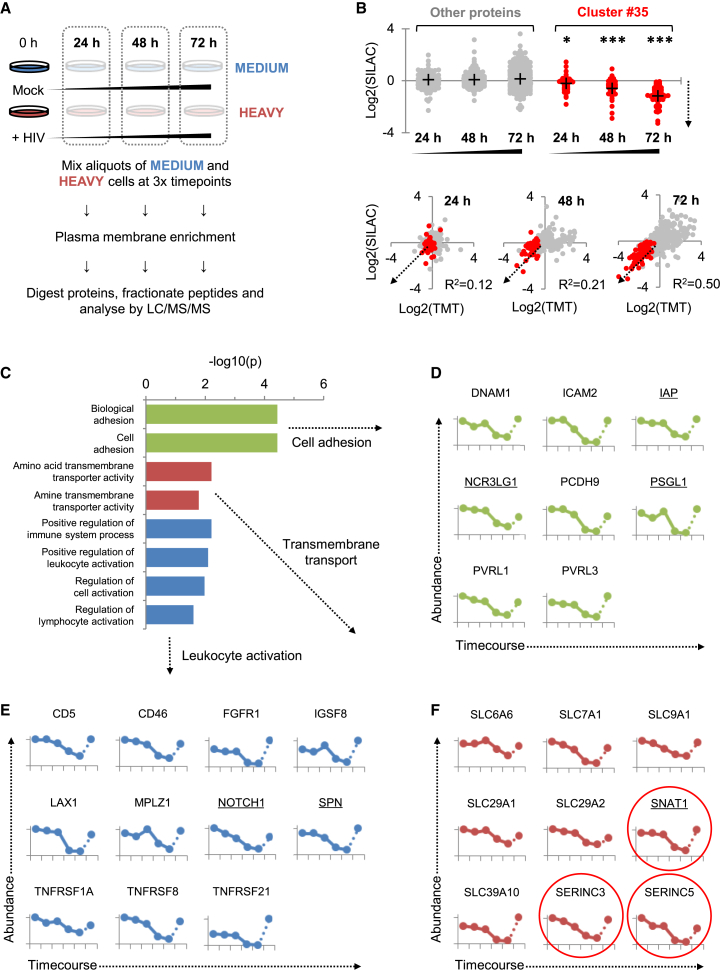
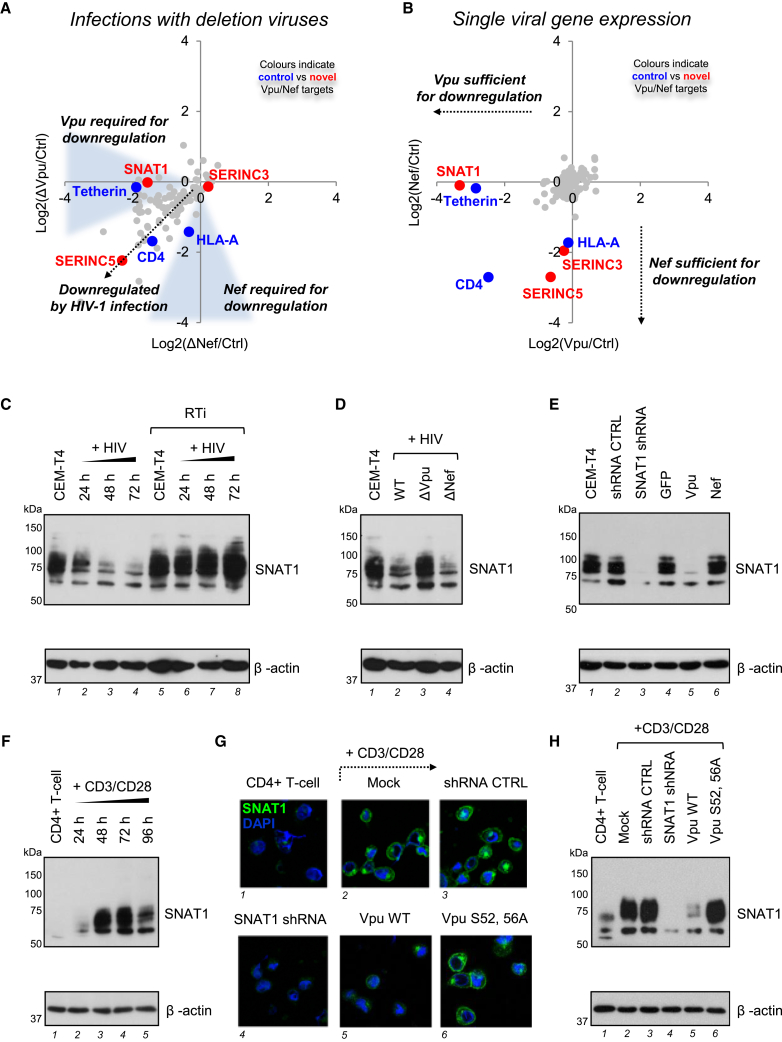
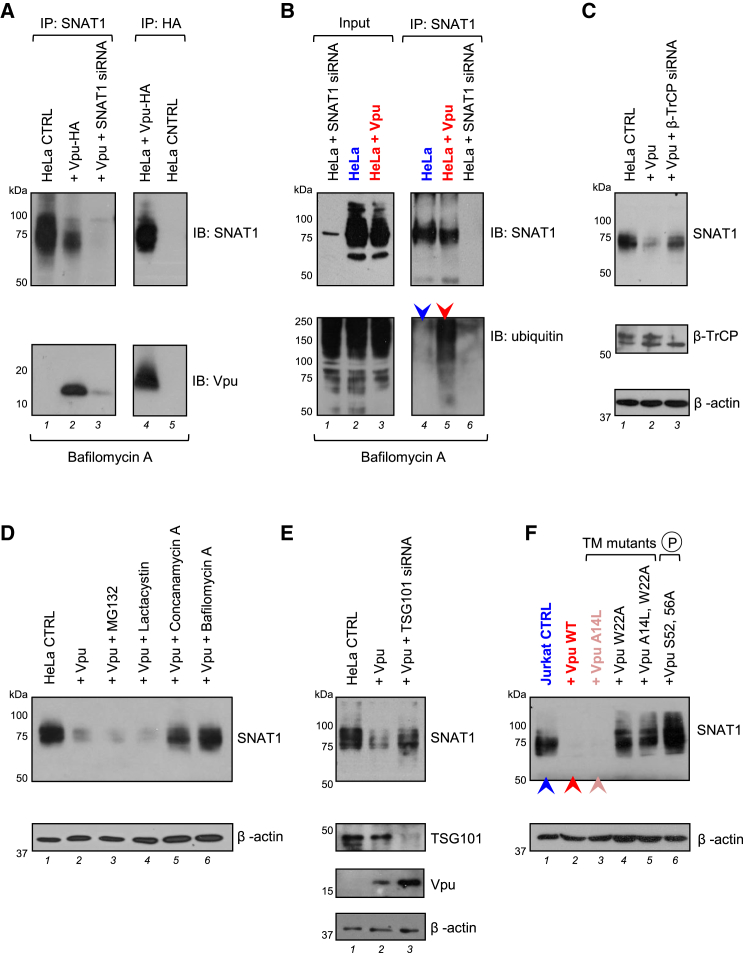
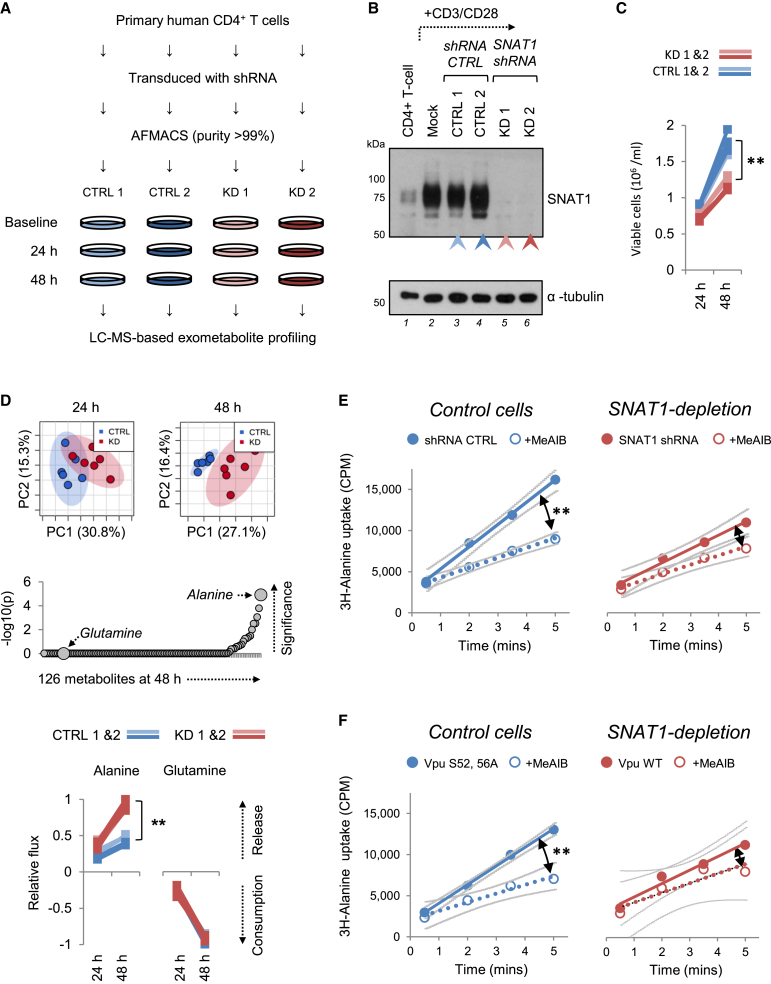
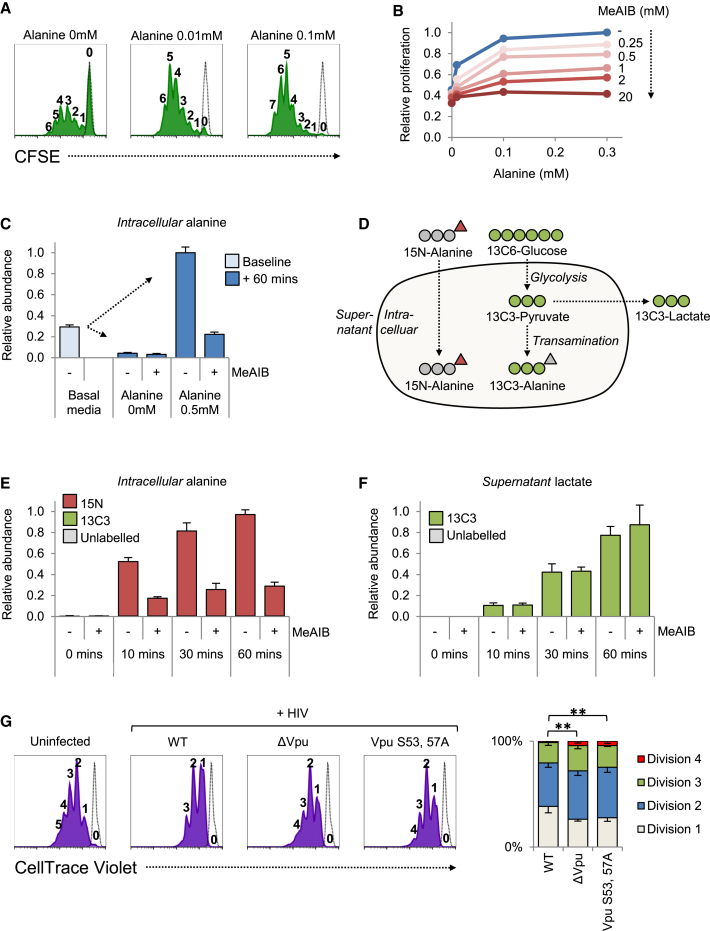
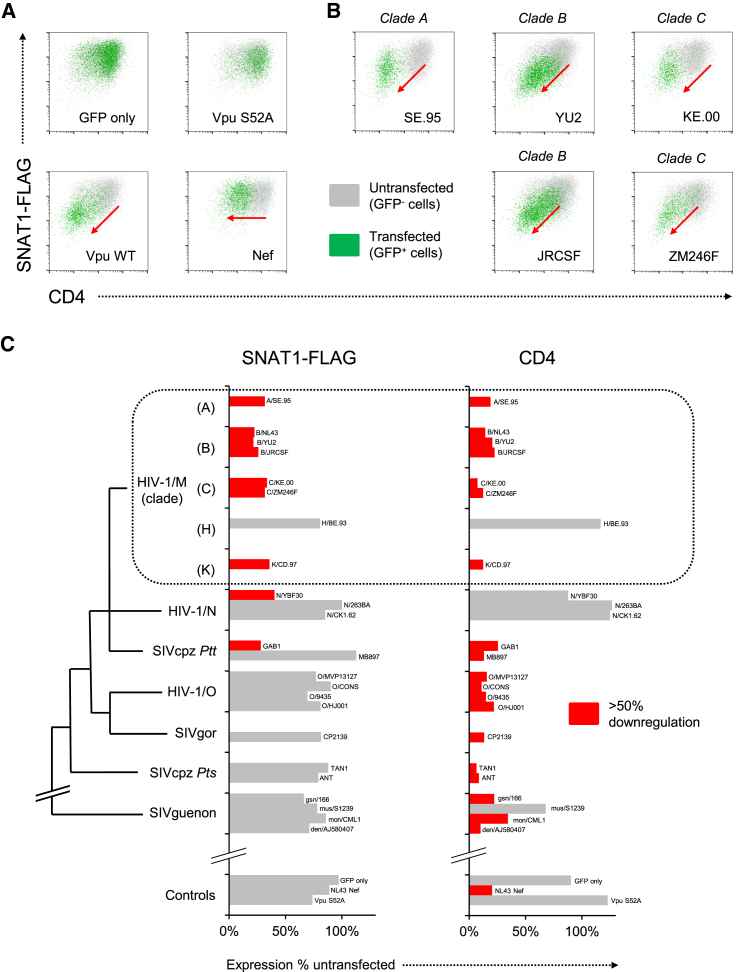
Critical cell surface immunoreceptors downregulated during HIV infection have previously been identified using non-systematic, candidate approaches. To gain a comprehensive, unbiased overview of how HIV infection remodels the T cell surface, we took a distinct, systems-level, quantitative proteomic approach. >100 plasma membrane proteins, many without characterized immune functions, were downregulated during HIV infection. Host factors targeted by the viral accessory proteins Vpu or Nef included the amino acid transporter SNAT1 and the serine carriers SERINC3/5. We focused on SNAT1, a β-TrCP-dependent Vpu substrate. SNAT1 antagonism was acquired by Vpu variants from the lineage of SIVcpz/HIV-1 viruses responsible for pandemic AIDS. We found marked SNAT1 induction in activated primary human CD4+ T cells, and used Consumption and Release (CoRe) metabolomics to identify alanine as an endogenous SNAT1 substrate required for T cell mitogenesis. Downregulation of SNAT1 therefore defines a unique paradigm of HIV interference with immunometabolism.


Figures

None
Graphical abstract
Figure 1
Figure 1
TMT-Based Proteomic Time Course of Plasma Membrane Protein Expression in HIV-1-Infected Cells (A) Workflow of TMT-based 6-plex PMP time course experiment. In subsequent figures, time points 1–5 show plasma membrane protein expression 0, 6, 24, 48, and 72 hr after HIV-1 infection (where 0 hr = uninfected cells), and time point 6 shows plasma membrane protein expression 72 hr after HIV-1 infection in the presence of reverse transcriptase inhibitors (RTi). NL4-3-deltaE-EGFP HIV-1 viruses at an MOI of 10 were used for all proteomic experiments. (B) Comparison of temporal profiles of CD4 and tetherin obtained by proteomic (TMT) versus flow cytometric quantitation. Cells from (A) were stained with anti-CD4 and anti-tetherin antibodies at the indicated time points and analyzed by flow cytometry. Relative abundance is expressed as a fraction of maximum TMT reporter ion or fluorescence intensity. For linear regression, log2(fold change compared with uninfected cells) is shown. (C) Temporal profiles of previously reported targets for HIV-mediated downregulation. (D) Identification of enriched temporal profiles by STEM. Model temporal profiles (black) and matched experimental protein expression profiles (red) are shown. Each box includes a profile identification number (top left) and an unadjusted p value (bottom left). Colored boxes indicate model profiles assigned more proteins than expected by chance alone (Bonferroni-adjusted p values < 0.05). See also Figure S1 and Tables S1 and S2.
Figure 2
Figure 2
SILAC-Based Proteomic Validation and Functional Analysis of Cell Surface Targets Downregulated by HIV-1 (A) Workflow of SILAC-based 3-way PMP time course experiment. (B) Validation of HIV-1 targets (upper panel) and comparison between SILAC- and TMT-based time course experiments (lower panel). Log2(fold change compared with mock/uninfected cells) at 24, 48, and 72 hr is shown for proteins from Cluster #35 (red) versus all other quantitated proteins (gray). Downregulation by HIV-1 is indicated by dotted arrows. Proteins identified by >1 unique peptide in both TMT and SILAC experiments are shown. Crosses indicate mean values. p < 0.05; ∗∗∗p < 0.001. (C) Gene ontology “molecular function” and “biological process” terms enriched among proteins from Cluster #35. DAVID functional annotation clusters with adjusted p values < 0.05 and containing terms with Bonferroni-adjusted p values < 0.05 are shown. Further details are included in Table S3. (D–F) Temporal profiles of downregulated proteins associated with cell adhesion (D), leukocyte activation (E), and transmembrane transport (F). Proteomic quantitation and time points are as for Figures 1B–1C. Proteins exhibiting >2-fold downregulation compared with uninfected cells in both TMT and SILAC experiments are shown, and proteins subsequently validated using flow cytometry or immunoblot are underlined. See also Figure S2 and Table S2.
Figure 3
Figure 3
Proteomic Analysis of Vpu and Nef Targets and Identification of SNAT1 as a Vpu Substrate (A and B) SILAC-based quantitation of plasma membrane proteins in cells infected with Vpu-deficient (y axis) versus Nef-deficient (x axis) HIV-1 viruses (A) and cells transduced with Vpu (x axis) versus Nef (y axis) as single genes (B). Log2(fold change compared with uninfected [A] or GFP-transduced [B] cells) is shown for proteins from Cluster #35. Figures S3A and S3B selectively enlarge the lower left quadrant of each scatterplot. Proteins identified by >1 unique peptide are shown. (C) SNAT1 depletion by HIV-1 infection. CEM-T4s infected with WT NL4-3-deltaE-EGFP HIV-1 virus in the presence or absence of RTi were immunoblotted at the indicated time points. An MOI of 10 was used, and infection controls are shown in Figure S4C. (D) Rescue of SNAT1 in the absence of Vpu. CEM-T4s infected with WT, Vpu-deficient, or Nef-deficient HIV-1 NL4-3-deltaE-EGFP viruses were immunoblotted at 48 hr. An MOI of 10 was used, and infection controls are shown in Figure S4C. (E) SNAT1 depletion by Vpu. CEM-T4s stably transduced with GFP, Vpu, or Nef were immunoblotted. Untransduced CEM-T4s and CEM-T4s stably transduced with control or SNAT1-specific shRNAs were included as controls. (F) SNAT1 induction in activated primary T cells. Primary human CD4+ T cells activated with CD3/CD28 Dynabeads were immunoblotted at the indicated time points. (G and H) SNAT1 depletion by Vpu in activated primary T cells. Primary human CD4+ T cells were activated with CD3/CD28 Dynabeads and mock transduced or transduced with the indicated shRNA or Vpu constructs. After purification by AFMACS (Figure S4F), cells were either rested or re-stimulated with CD3/CD28 Dynabeads and immunoblotted (G) or analyzed by confocal microscopy (H) at 48 hr. See also Figures S3 and S4.
Figure 4
Figure 4
Mechanism of SNAT1 Depletion by Vpu (A) Interaction of SNAT1 with Vpu. HeLa cells stably transduced with Vpu-HA were immunoprecipitated with anti-SNAT1 (G63; first panel) or anti-HA (second panel) antibodies and immunoblotted with anti-SNAT1 (H60) or anti-Vpu antibodies. Untransduced HeLas transfected with SNAT1-specific siRNA were included as controls. (B) Ubiquitination of SNAT1 by Vpu. HeLa cells stably transduced with Vpu-HA were either immunoblotted with anti-SNAT1 (H60) and anti-ubiquitin antibodies (first panel) or immunoprecipitated with anti-SNAT1 (G63) antibody, re-immunoprecipitated with anti-SNAT1 (H60) antibody, and immunoblotted with anti-SNAT1 (H60) and anti-ubiquitin antibodies (second panel). Untransduced HeLas transfected with SNAT1-specific siRNA were included as controls. Ubiquitinated SNAT1 in control (blue arrow) and Vpu-expressing (red arrow) HeLas is highlighted. (C) β-TrCP-dependent depletion of SNAT1. HeLa cells stably transduced with Vpu-HA were transfected with control or β-TrCP-specific siRNA then immunoblotted. (D and E) SNAT1 depletion via an endolysosomal pathway. HeLa cells stably transduced with Vpu-HA were either treated with MG132, lactacystin, concanamycin, or bafilomycin (D) or transfected with control or TSG101-specific siRNA (E) then immunoblotted. (F) Molecular determinants of SNAT1 downregulation. Jurkats stably expressing Vpu WT or indicated Vpu mutants were immunoblotted. Cells transduced with empty vector (blue), Vpu WT (red), and Vpu A14L (pink) are highlighted. The same cells stained with anti-CD4 or anti-tetherin antibodies and analyzed by flow cytometry are shown in Figure S5A. See also Figure S5.
Figure 5
Figure 5
CoRe Metabolomics of Proliferating T Cells and Identification of Alanine Transport by SNAT1 (A) Workflow of CoRe metabolomics experiment. (B) SNAT1 knockdown for CoRe metabolomics experiment. Primary human CD4+ T cells were activated with CD3/CD28 Dynabeads and mock transduced or transduced with the indicated shRNAs. After purification by AFMACS (Figure S6A), cells were either rested or re-stimulated with CD3/CD28 Dynabeads, then immunoblotted at 48 hr. (C) Defective proliferation of SNAT1-depleted primary T cells. Re-stimulated cells from (B) were seeded at equal densities and viable cells enumerated at the indicated time points using CytoCount beads. Data were obtained in triplicate. ∗∗p < 0.01. No difference in cell size between the two populations was seen by flow cytometry (Figure S6B). (D) CoRe metabolomic analysis of control and SNAT1-depleted primary T cells. Metabolite compositions of culture supernatants from (C) were determined by LC-MS at baseline, 24, and 48 hr. Data were obtained in triplicate, and Principal component analysis was used to compare net consumption or release of metabolites by control and SNAT1-depleted cells (upper panels). 95% confidence regions are shown. p values for differences in consumption or release of individual metabolites at 48 hr are shown on a negative log scale (middle panel). Net consumption or release of alanine and glutamine is shown scaled to a maximum change of 1 (lower panels). ∗∗p < 0.01. (E and F) Impaired alanine uptake by primary T cells depleted of SNAT1 by shRNA (E) or Vpu (F). Cells from Figures 3G–3H were re-stimulated for 48 hr with CD3/CD28 Dynabeads and uptake (counts per minutes; CPM) of 3H-alanine measured at time points from 30 s to 5 min. 3H-alanine transport in the presence of MeAIB is included as a control, and MeAIB-inhibitable uptake is highlighted (black arrows). 95% confidence bands on linear regression lines (indicating rates of uptake) are shown in gray. ∗∗p < 0.01. See also Figure S6.
Figure 6
Figure 6
Requirement for Extracellular Alanine in T Cell Mitogenesis (A) Dose-dependent proliferation of primary T cells in response to exogenous alanine. Primary human CD4+ T cells were stained with CFSE, stimulated with CD3/CD28 Dynabeads in media supplemented with alanine at the concentrations indicated, and analyzed by flow cytometry after 120 hr (green filled histograms). Peaks are labeled by division number, and unstimulated cells were included as a control (black dotted lines). Representative data from three independent experiments are shown. (B) Dose-dependent inhibition of primary T cell proliferation by MeAIB. Primary human CD4+ T cells were stimulated with CD3/CD28 Dynabeads in media supplemented with alanine and MeAIB at the concentrations indicated. Viable cells were enumerated using CytoCount beads after 72 hr and numbers expressed as a fraction of the maximum. (C) Regulation of free intracellular alanine pool by System A-dependent alanine uptake. Primary human CD4+ T cells were expanded, rested, and re-stimulated for 48 hr with CD3/CD28 Dynabeads. Cells were then resuspended in media supplemented with alanine at the concentrations indicated in the presence or absence of MeAIB. Abundance of free intracellular alanine at baseline and 60 min is expressed as a fraction of the maximum. Mean values and 95% confidence intervals are shown for data obtained in triplicate. No difference in cell size was observed between 0 and 0.5 mM alanine (Figure S7D, left panel). (D–F) Reconstitution of free intracellular alanine pool by extracellular alanine. Washed cells prepared as in (C) were resuspended in media supplemented with 5.6 mM 13C6-glucose and 0.5 mM 15N-alanine (D) in the presence or absence of MeAIB. Abundances of labeled and unlabeled free intracellular alanine (E) and supernatant lactate (F) at the indicated time points are expressed as a fraction of the maximum. Mean values and 95% confidence intervals are shown for data obtained in triplicate. No difference in cell size was observed in the presence or absence of MeAIB (Figure S7D, right panel). (G) Defective proliferation of primary T cells depleted of SNAT1 by HIV-1. Primary human CD4+ T cells were stained with CellTrace Violet, stimulated with CD3/CD28 Dynabeads, infected with the indicated NL4-3 Vpu 2_87 HIV-1 viruses at an MOI of 3, and analyzed by flow cytometry after 120 hr (violet filled histograms). Peaks are labeled by division number, and unstimulated cells are included as a control (black dotted lines). Representative data for infected (p24+) and uninfected (p24−) cells are shown. Mean percent of infected cells in each generation from four independent experiments are depicted as stacked columns. Error bars indicate SEM. ∗∗p < 0.01. See also Figure S7.
Figure 7
Figure 7
SNAT1 Downregulation by Vpu Variants from Pandemic HIV-1 Viruses (A) Screening strategy for SNAT1 downregulation by naturally occurring Vpu variants. 293Ts stably expressing SNAT1-FLAG and CD4 were transfected with the indicated pCG-IRES-GFP constructs (all based on HIV-1 group M, clade B, strain NL4-3 virus) and analyzed by flow cytometry at 36 hr. Target downregulation is indicated by a shift in the transfected (GFP+) cells toward the lower left quadrant (red arrows). (B) SNAT1-FLAG downregulation by Vpu variants from pandemic HIV-1 group M clade A/B/C viruses. As for (A), but cells were transfected with pCG-IRES-GFP constructs encoding Vpu variants from the indicated strains of HIV-1. (C) Phylogenetic analysis of SNAT1-FLAG downregulation by Vpu variants of HIV-1 and SIV viruses. As for (A) and (B), but cells were transfected with pCG-IRES-GFP constructs encoding Vpu variants from the indicated strains of HIV-1 or SIV and downregulation of SNAT1-FLAG or CD4 expressed as ratio of geomean fluorescence intensity between transfected (GFP+) and untransfected (GFP) cells. Illustrative phylogenetic relationships are shown, and branch lengths are arbitrary (further details are included in Supplemental Experimental Procedures). HIV-1/M/N/O (HIV-1 group M, N, or O viruses); SIVcpz Ptt (SIVs infecting central P. t. troglodytes chimpanzees); SIVcpz Pts (SIVs infecting eastern P. t. schweinfruthii chimpanzees); SIVgor (gorilla SIV); SIVguenon (SIVs infecting guenon monkeys).

Comment in

References

    1. Abraham L., Fackler O.T. HIV-1 Nef: a multifaceted modulator of T cell receptor signaling. Cell Commun. Signal. 2012;10:39. - PMC - PubMed
    1. Brandt C.S., Baratin M., Yi E.C., Kennedy J., Gao Z., Fox B., Haldeman B., Ostrander C.D., Kaifu T., Chabannon C. The B7 family member B7-H6 is a tumor cell ligand for the activating natural killer cell receptor NKp30 in humans. J. Exp. Med. 2009;206:1495–1503. - PMC - PubMed
    1. Carr E.L., Kelman A., Wu G.S., Gopaul R., Senkevitch E., Aghvanyan A., Turay A.M., Frauwirth K.A. Glutamine uptake and metabolism are coordinately regulated by ERK/MAPK during T lymphocyte activation. J. Immunol. 2010;185:1037–1044. - PMC - PubMed
    1. Chaudhry F.A., Reimer R.J., Edwards R.H. The glutamine commute: take the N line and transfer to the A. J. Cell Biol. 2002;157:349–355. - PMC - PubMed
    1. Chuang J.C., Yu C.L., Wang S.R. Modulation of human lymphocyte proliferation by amino acids. Clin. Exp. Immunol. 1990;81:173–176. - PMC - PubMed

Publication types

MeSH terms

Substances