. 2015 Oct 14;18(4):478-88.
doi: 10.1016/j.chom.2015.09.002. Epub 2015 Oct 1.

Quantitative Imaging of Gut Microbiota Spatial Organization

Affiliations

Quantitative Imaging of Gut Microbiota Spatial Organization

Kristen A Earle et al. Cell Host Microbe. .

Abstract

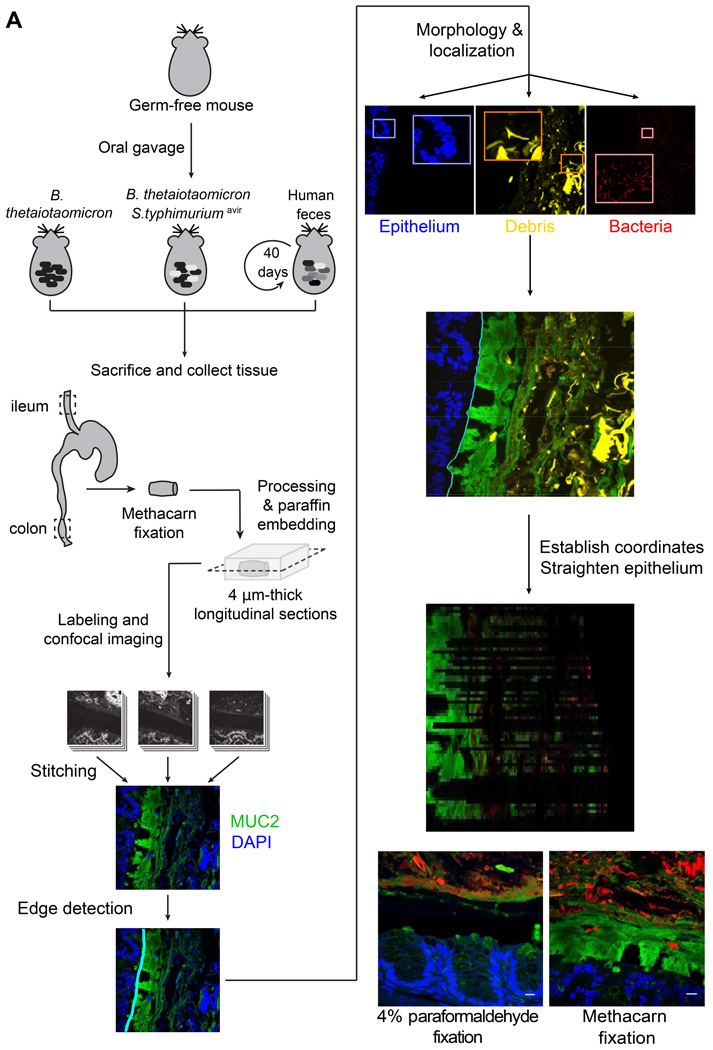
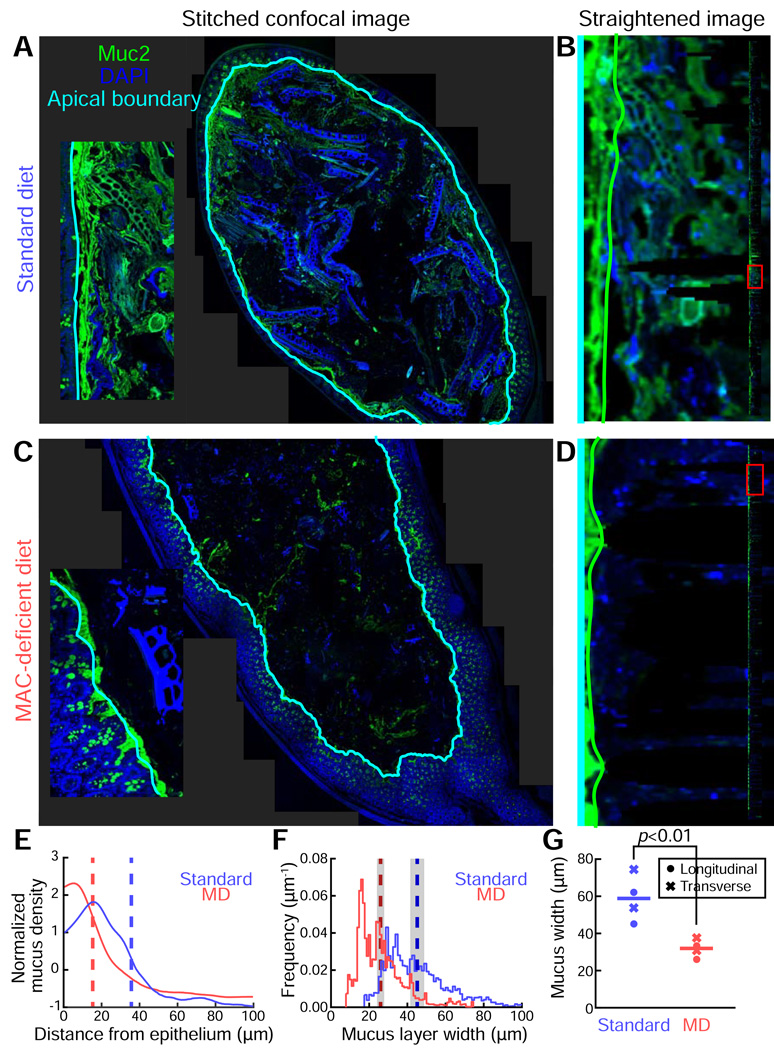
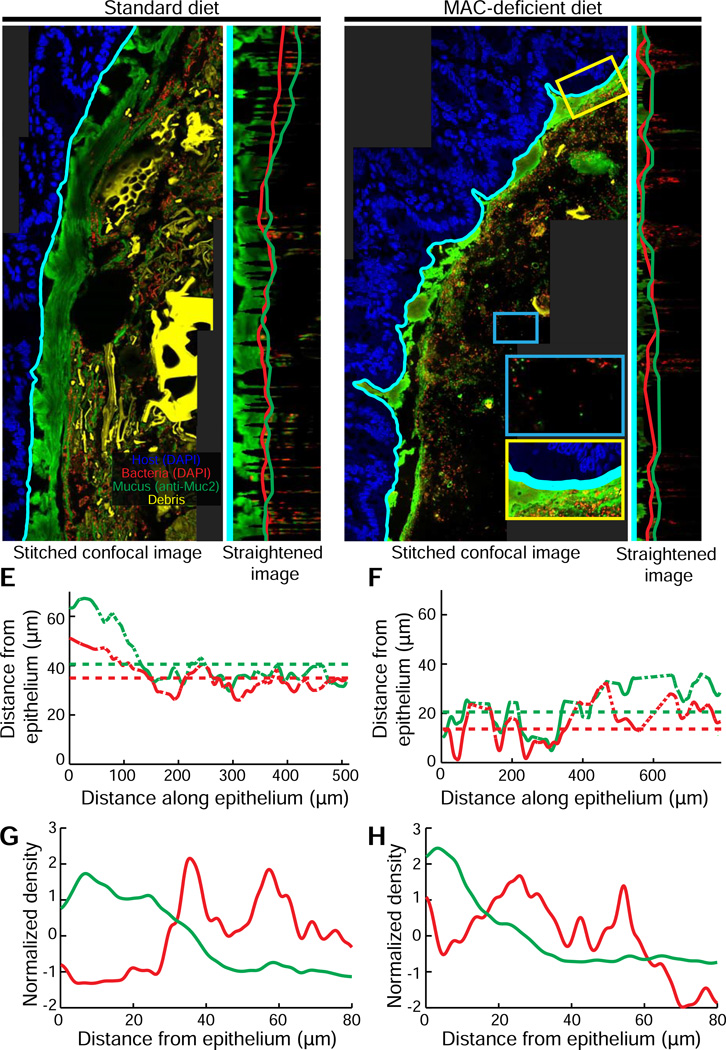
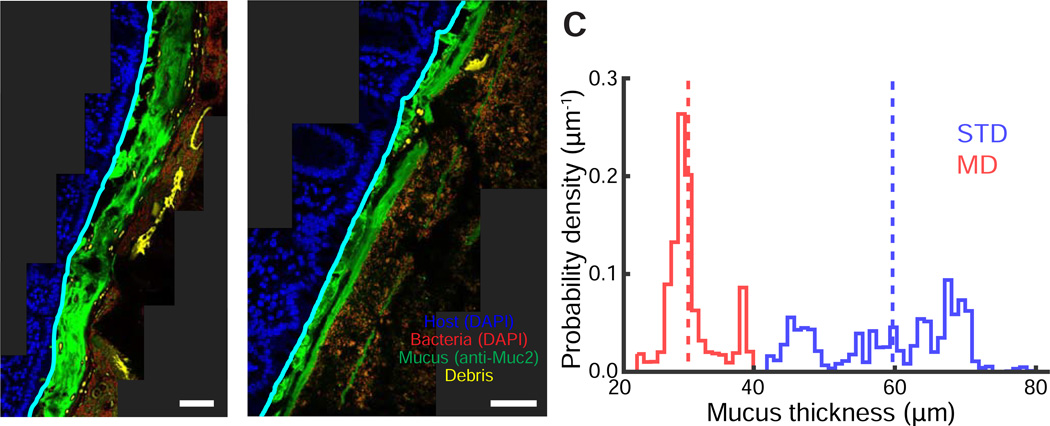
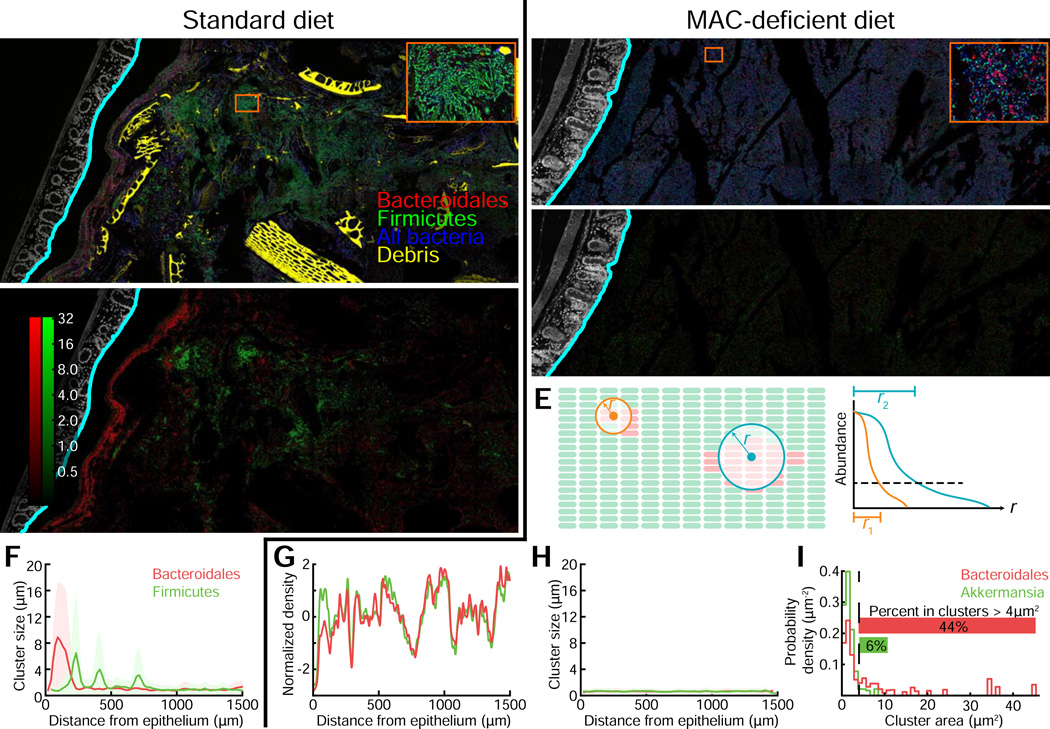
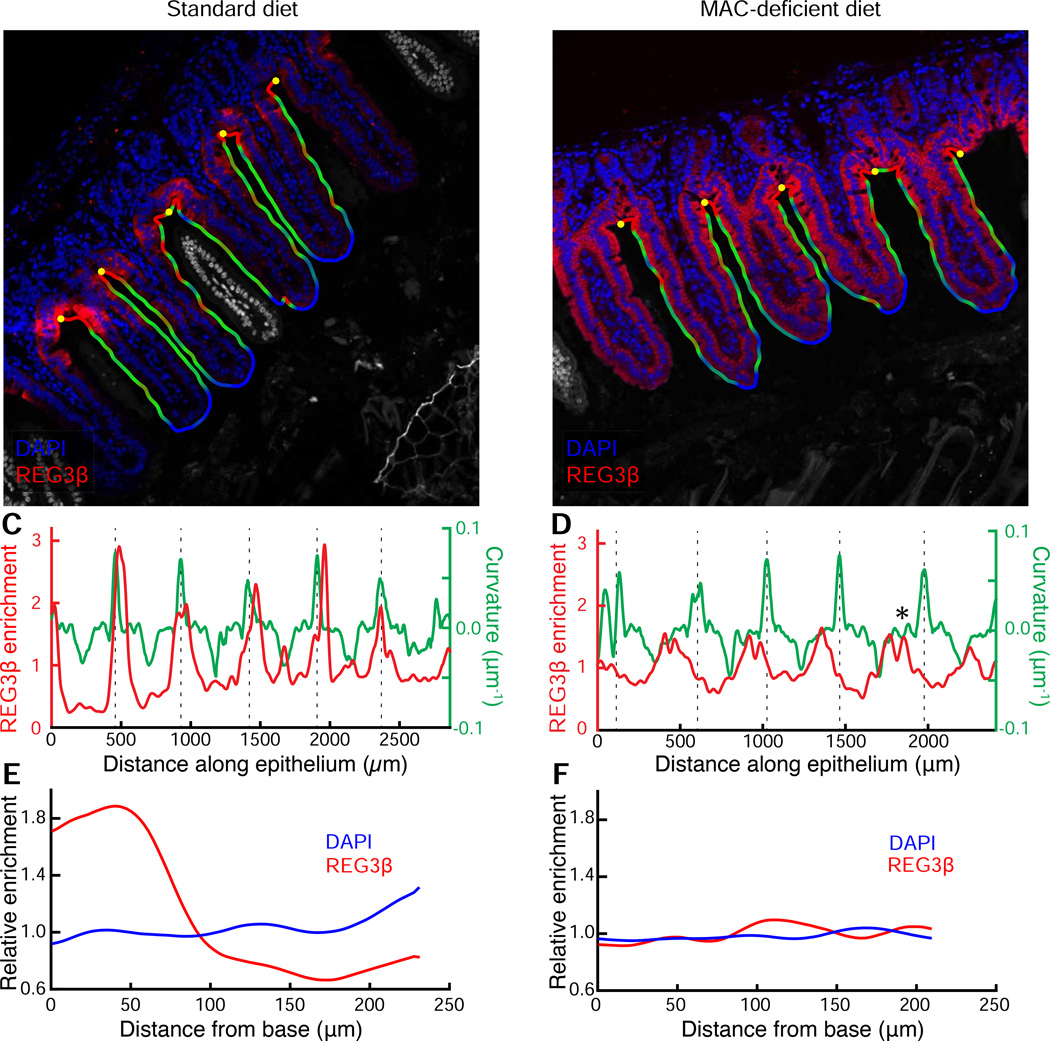
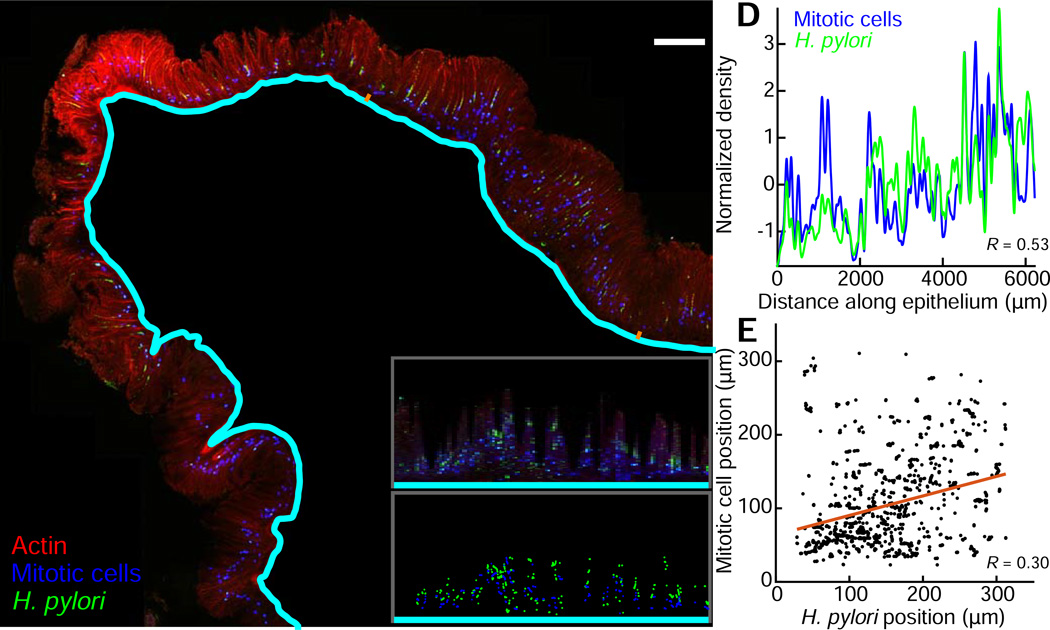
Genomic technologies have significantly advanced our understanding of the composition and diversity of host-associated microbial populations. However, their spatial organization and functional interactions relative to the host have been more challenging to study. Here we present a pipeline for the assessment of intestinal microbiota localization within immunofluorescence images of fixed gut cross-sections that includes a flexible software package, BacSpace, for high-throughput quantification of microbial organization. Applying this pipeline to gnotobiotic and human microbiota-colonized mice, we demonstrate that elimination of microbiota-accessible carbohydrates (MACs) from the diet results in thinner mucus in the distal colon, increased proximity of microbes to the epithelium, and heightened expression of the inflammatory marker REG3β. Measurements of microbe-microbe proximity reveal that a MAC-deficient diet alters monophyletic spatial clustering. Furthermore, we quantify the invasion of Helicobacter pylori into the glands of the mouse stomach relative to host mitotic progenitor cells, illustrating the generalizability of this approach.


Figures

Figure 1
Figure 1. Preservation of the inner mucus layer in histological sections allows for quantitative analysis of the spatial structure of the gut ecosystem
(A) Schematic of protocol for gnotobiotic mouse experiments, tissue collection and processing, image acquisition, and analysis. (B,C) Segments of mouse distal colon fixed in (B) 4% paraformaldehyde or (C) methacarn solution. Blue, DAPI staining in the epithelium; red, DAPI staining in lumen of gut, including bacteria and shed host nuclei (luminal debris has not been differentiated in this image); green, antibody staining for MUC2. Scale bars: 10 µm.
Figure 2
Figure 2. Large-scale image reconstruction of the distal colon enables quantification of mucus thickness and variability within a sample and between dietary conditions
(A,C) Stitched images (∼40) of the fecal pellet-containing distal colons of Bt-monocolonized mice fed a (A) standard diet or (C) an MD diet. Samples were stained with DAPI (blue) and a MUC2 antibody (green), and overlaid with the computationally identified apical boundary (cyan). (B,D) Detection of the edge of the inner mucus layer (green line) along a short length of the epithelium, corresponding to the insets in (A) and (C), in mice fed (B) a standard diet or (D) an MD diet. Edges were detected via computational straightening of the image. Inset: full straightened image along boundary of an entire gut segment. The red box highlights the portion of the segment visualized in the main panel. (E) Mucus density versus distance from the epithelium for the colon sections in (A) (blue) and (C) (red), averaged over the length of the epithelium. Curves are mean-subtracted and divided by the standard deviation for normalization. Dashed vertical lines mark the location of the maximum gradient, indicating the edge of the inner mucus layer. (F) Distribution of mucus layer widths in the colon sections shown in (A) (blue) and (C) (red), measured along the boundary of the entire gut segment. Dashed vertical lines indicate the mean widths, and shaded regions indicate standard error of the mean, accounting for sample autocorrelation. (G) Average mucus width for mice fed standard and MD diets. Circles indicated measurements taken from longitudinal sections, and crosses indicate measurements taken from transverse sections; each data point represents an individual mouse (n=4 mice per diet). Horizontal lines indicate average width. P-value reflects one-sided t-test.
Figure 3
Figure 3. Diet change drives a shift in microbiota localization in the distal gut
(A,C) Higher-resolution stitched images of the distal colon of Bt-monocolonized mice fed (A) a standard diet and or (C) an MD diet (C). Yellow inset (C): bacteria invading mucus layer. Blue inset (C): region far from the epithelium with few bacteria. (B,D) Computationally straightened versions of the region of images shown in (A) and (C), respectively. Computationally determined edges defining the boundary of the inner mucus layer (green line) and the proximity to host epithelium of bacterial colonization (red line). (E,F) Variation in width of inner mucus layer (green) and inner boundary of bacterial colonization (red) along the epithelium for mice fed (E) standard or (F) MD diets. Dashed portions of traces indicate regions where interpolation is required due to contour curvature. Dotted horizontal lines indicate the average widths (excluding interpolated points). (G,H) Density, as determined by fluorescent intensity, of bacteria (red line) and mucus (green line) plotted in distance away from the epithelium for mice fed a (G) standard or (H) MD diet. Curves are mean-subtracted and divided by the standard deviation for normalization.
Figure 4
Figure 4. Diet changes affect the spatial organization of a complex intestinal community
(A,B) Distal colon sections from humanized mice fed a (A) standard or (B) MD diet. Sections were stained with DAPI (epithelial signal, blue; luminal signal, red) and with MUC2 antibodies (green). Computed epithelial boundary is outlined in cyan, and debris appears in yellow. (C) Distribution of mucus layer thickness in mice fed a standard (blue) or MD (red) diet. Dashed line represents the mean. Images are representative of two imaged mice per condition; replicates are shown in Fig. S3.
Figure 5
Figure 5. Diet changes affect clustering and mixing of a complex intestinal community
(A,B) Distal colon sections from humanized mice fed a (A) standard or (B) MD diet. Sections were stained with DAPI (epithelial signal, white; luminal signal, blue), and FISH probes Bac303 (Bacteroidales, red) and LGC354A–C and Erec482 (Firmicutes, green). Computed epithelial boundary is outlined in cyan, and debris appears in yellow. Insets show a large Firmicutes cluster (A) and small Bacteroidales clusters (B). Images are representative of two imaged mice per condition; results for replicates are shown in Fig. S6. (C,D) Pixel intensity corresponds to measured cluster size in images (A) and (B), respectively, for Bacteroidales (red) and Firmicutes (green). Intensities are on a log scale for clarity, and the same color scale is used for both images. (E) Schematic of cluster size calculation: for each probe, the fluorescence signal in neighborhoods of increasing radii was integrated. For a small cluster (orange), the signal decays rapidly with increasing radius. For a large cluster (blue), the signal decays more slowly with increasing radius. (F,H) Mean cluster size of Bacteroidales (red) and Firmicutes (green), computed as in (C-E), versus distance from epithelium, for mice fed a (F) standard or (H) MD diet. Shaded regions indicate the standard deviation of cluster widths. For computing means, a bin size of 20 µm was used. (G) Density of Bacteroidales (red) and Firmicutes (green) as a function of distance from epithelium for mice fed an MD diet. Curves were mean-subtracted and divided by the standard deviation for normalization. Solid lines are measured from samples in (A) and (B). (I) Distribution of Akkermansia and Bacteroidales cell clump sizes in MD-fed humanized mice. An area threshold of 4 µm2 (dotted line) was used to classify clusters vs. single cells.
Figure 6
Figure 6. Diet change alters the innate immune response in the ileum
(A, B) Ileum of mice fed a (A) standard or (B) MD diet. Samples were stained with DAPI (blue) and REG3β antibody (red). The computationally identified outline is colored by contour curvature, and the computationally identified base of the villi is shown with yellow dots. The region outside the contour, including villi that are not continuous with the imaged epithelium due to sectioning angle, are colored gray. Images are representative of two imaged mice per condition; results for replicates are shown in Fig. S7, A-F. (C, D) Variation in enrichment of REG3β normalized to the mean, as determined by fluorescence intensity (red) and curvature of epithelial contour (green) along the length of the epithelium. Dashed lines indicate the base of the villi. Asterisk in (D) indicates an example of a maximum in REG3β signal that is not associated with a maximum of curvature. (E, F) Distribution of REG3β signal (red) and cell nuclei (DAPI, blue) relative to the base of the villi in a (E) standard or (F) MD diet.
Figure 7
Figure 7. BacSpace reveals spatial coordination between H. pylori gastric gland colonization and mitotic progenitor cell division in the stomach
(A) Longitudinal section of the stomach antrum two weeks post infection with Hp. F-actin is stained with phalloidin (red), and Hp (green) and phospho-Histone-H3 (blue, indicating mitotic cells) are visualized by immunolabeling. BacSpace detection of the mucosal boundary appears in cyan. Images and quantification are representative of two imaged mice; results for replicates are shown in Fig. S7, G-H. (B) Computationally straightened segment of the section in (A), corresponding to the epithelial region marked by orange dashes in (A). (C) Median distance from the mucosal boundary of Hp (green dots) and mitotic nuclei (blue dots) for positions in (B) along the epithelium in which both Hp and mitotic cells are detected. (D) Variation in density (normalized by z-score) of Hp (green) and mitotic cells (blue) along the length of the antrum indicates correlation (Pearson correlation coefficient 0.53) between the Hp and mitotic cell fluorescence in the direction away from the submucosal boundary. (E) Average distance from submucosal boundary of Hp and mitotic cells at positions along the antrum for which both are present.

Comment in

References

    1. Barr JJ, Auro R, Furlan M, Whiteson KL, Erb ML, Pogliano J, Stotland A, Wolkowicz R, Cutting AS, Doran KS, et al. Bacteriophage adhering to mucus provide a non-host-derived immunity. Proceedings of the National Academy of Sciences of the United States of America. 2013;110:10771–10776. - PMC - PubMed
    1. Bayley GVHJM. The “Effective” Number of Independent Observations in an Autocorrelated Time Series. Supplement to the Journal of the Royal Statistical Society. 1946;8:184–197.
    1. Broz P, Newton K, Lamkanfi M, Mariathasan S, Dixit VM, Monack DM. Redundant roles for inflammasome receptors NLRP3 and NLRC4 in host defense against Salmonella. The Journal of experimental medicine. 2010;207:1745–1755. - PMC - PubMed
    1. Burger-van Paassen N, Loonen LM, Witte-Bouma J, Korteland-van Male AM, de Bruijn AC, van der Sluis M, Lu P, Van Goudoever JB, Wells JM, Dekker J, et al. Mucin Muc2 deficiency and weaning influences the expression of the innate defense genes Reg3beta, Reg3gamma and angiogenin-4. PloS one. 2012;7:e38798. - PMC - PubMed
    1. Burkitt DP. Epidemiology of large bowel disease: the role of fibre. The Proceedings of the Nutrition Society. 1973;32:145–149. - PubMed

Publication types