. 2015 Oct 27;6(33):34941-52.
doi: 10.18632/oncotarget.5472.

Estradiol induces apoptosis via activation of miRNA-23a and p53: implication for gender difference in liver cancer development

Affiliations

Estradiol induces apoptosis via activation of miRNA-23a and p53: implication for gender difference in liver cancer development

Fung-Yu Huang et al. Oncotarget. .

Abstract

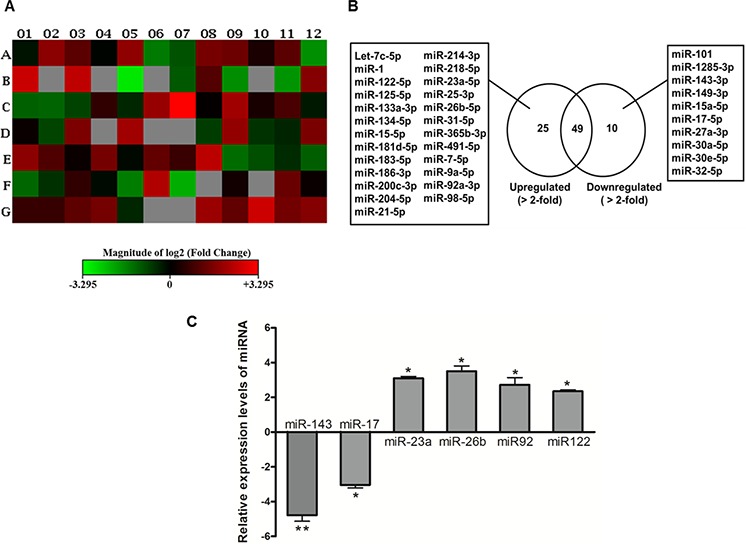
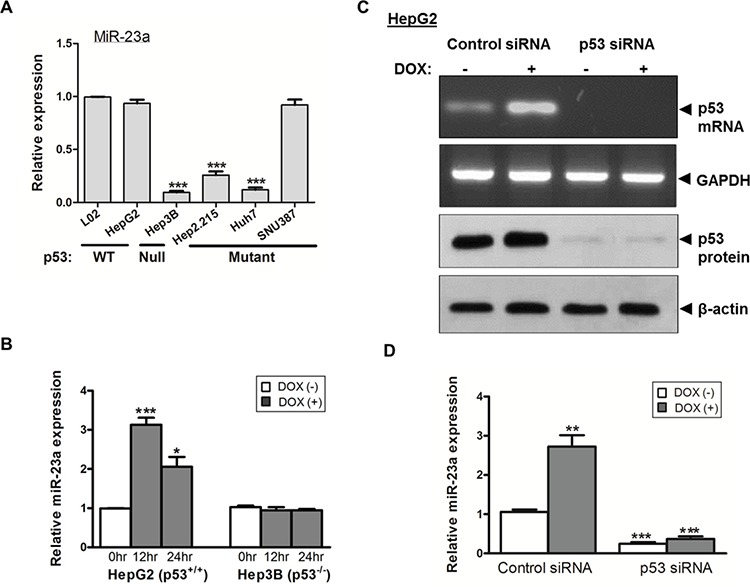
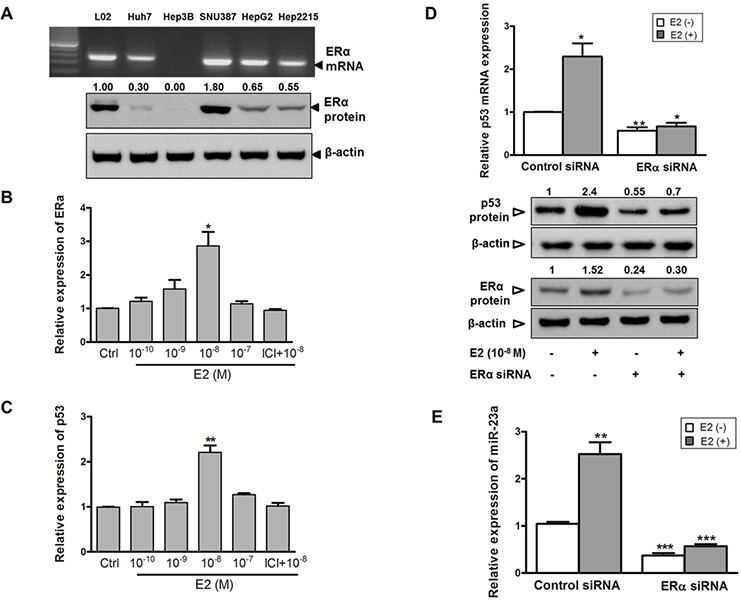
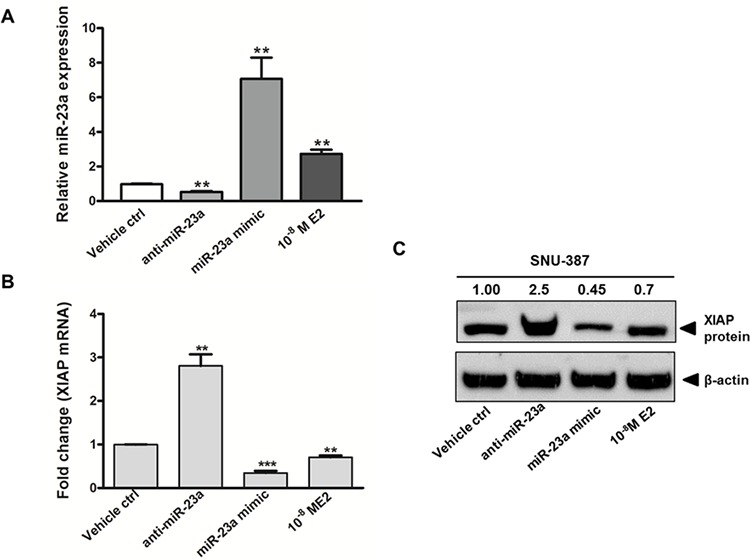
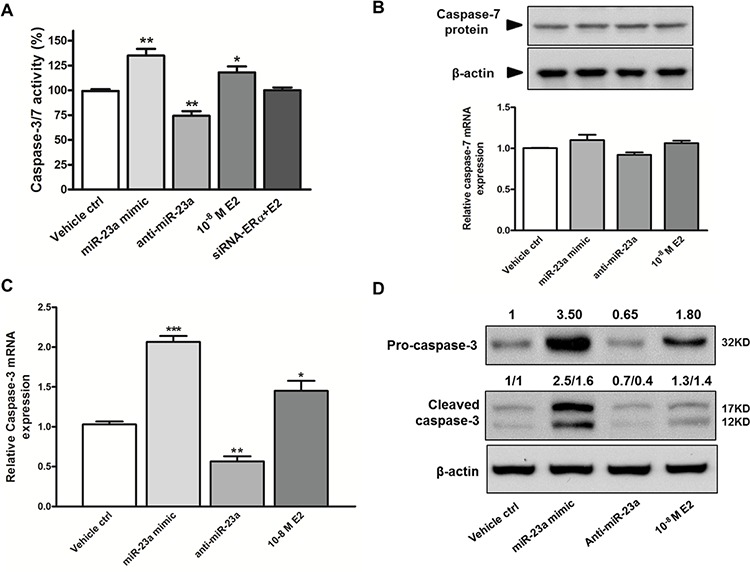
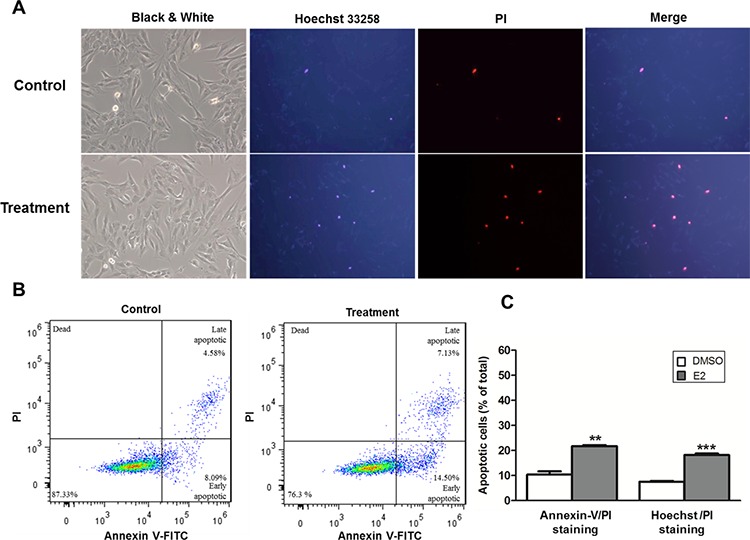
Estrogen (E2) has been suggested to have a protective role in attenuating hepatocellular carcinoma (HCC) development. miRNAs have great potential as biomarkers and therapeutic agents owing to their ability to control gene expression. However, little is known about the mechanism underlying the protective role of E2 in hepatocarcinogenesis and the effects of E2 on apoptotic miRNAs expression. Using miRNA PCR array, we found more than 2-fold alteration was observed in 25 upregulated and 10 downregulated apoptotic miRNAs in E2-treated cells. Among these miRNAs, we found expression of miR-23a was related to p53 functional status in the male-derived liver cell-lines. We demonstrated that E2 via ERα transcriptionally activated miR-23a and p53 expression, and thus enhanced p53 activation of miR-23a expression. Moreover, miR-23a expression correlated inversely with the expression of target gene X-linked inhibitor of apoptosis protein (XIAP), but positively with the caspase-3/7 activity. Decreasing of XIAP might contribute to caspase-3 activity and cell apoptosis. Taken together, our findings reveal a novel E2-signaling mechanism in regulating miRNAs expression for controlling apoptosis in liver cells. Delineating the role of E2 in regulating the activation of p53 and miR-23a, expression in HCC is crucial to the understanding of the sex difference observed in HCC.

Keywords: apoptosis; estrogen; gender difference; hepatocellular carcinoma; microRNA.


Conflict of interest statement

CONFLICTS OF INTEREST

All authors declare no conflicts of interest.

Figures

Figure 1
Figure 1. Deregulation of apoptotic miRNA expression in SNU-387 liver cancer cells following 10−8M estrogen (E2) treatment for 24 hours
A. Heat map generated from PCR array data reflecting miRNAs expression values in E2-treated cells versus untreated controls. This graph represents log2 fold-regulation data from two sample groups on a 96-well plate layout. Red indicates up-regulation; green indicates down-regulation; black indicates no change; and grey indicates not determined (the recommended lower limit of detection when both samples with Ct ≥ 35). The bar code on the bottom represents the color scale of the log2 values. B. List of the miRNAs that were upregulated (>2.0 fold) and downregulated (>2.0 fold) in E2-treated cells as determined by miRNA PCR array analysis. C. Confirmation of six aberrantly expressed miRNAs using quantitative real-time PCR. Cells were starved overnight in serum-free medium before treatment with 10−8M E2 for 24 hours. The expression of miRNAs was normalized with internal control U6 SnRNA and compared with vehicle-treated control cells calculated using ΔΔCt method. Data are expressed as means ± SEM from three individual experiments. **p < 0.05 and *p < 0.01.
Figure 2
Figure 2. Expression of the tumor suppressor p53 and miR-23a in liver cancer cells
A. Differential expression of miR-23a in relation to the p53 functional status in liver cancer cell-lines. B. Effect of doxorubicin (DOX) on the expression of miR-23a in p53+/+ HepG2 and p53−/− Hep3B cells. C. Transient knockdown of p53 by p53-siRNA suppressed p53 mRNA and protein expression. D. Effect of p53 knockdown and DOX treatment on miR-23a expression in HepG2 cells (***p < 0.0001, **p < 0.001 and *p < 0.01).
Figure 3
Figure 3. Estrogen induces p53 and miR-23a expression in SNU-387 cells
A. Endogenous mRNA and protein expression of estrogen receptor ERα was assessed in liver cell-lines. B. and C. ERα and p53 mRNA expression in SNU-387 cells with E2 treatment (10−10-10−7M) or with pretreatment of 1 μM ICI-182,780 (ICI) for 24 hours were analyzed by quantitative RT-PCR. D. Relative mRNA and protein expression of p53 and protein expression of ERα with or without knockdown of ERα by ERα siRNA was measured in SNU-387 cells. E. Quantitative RT-PCR analysis of the effects of E2 on miR-23a expression in SNU-387 cells with or without ERα knockdown. Data are expressed as means ± SEM from three individual experiments (***p < 0.0001, **p < 0.001 and *p < 0.01).
Figure 4
Figure 4. Gain of function and loss of function analysis on the expression of miR-23a and its effect on X-linked inhibitor of apoptosis protein (XIAP) expression in SNU-387 cells
Quantitative analysis on A. miR-23a expression; B. XIAP mRNA expression; and C. XIAP protein expression in SNU-387 cells transfected with miR-23a mimic (20 nM) or anti-miR-23a (20 nM), or with E2 (10−8M) treatment. Cells were collected for analysis at day 2 after treatment or transfection. Data represent means ± SEM from three independent experiments (***p < 0.0001, **p < 0.001 and *p < 0.01).
Figure 5
Figure 5. Effects of miR-23a on caspase-3/7 activity and apoptosis in SNU-387 cells
A. Caspase 3/7 activity were analyzed in SNU-387 cells transfected with miR-23a mimic or anti-miR-23a, or with E2 treatment +/− ERα knockdown (**p < 0.005 and *p < 0.05) for 24 hours. Similarly, effect of miR-23a mimic, anti-miR-23a, and E2 treatment on B. caspase-7 mRNA and protein expression; C. caspase-3 mRNA expression; and D. pro-caspase-3 (32KD) and active caspase-3 (17KD) protein levels were analyzed 24 hours after transfection or treatment in SNU-387 cells. Data are mean values ± SEM from three independent experiments (***p < 0.0001, **p < 0.001 and *p < 0.01).
Figure 6
Figure 6. Estrogen induced apoptosis in SNU-387 cells
The cells were collected for analysis after treatment with 10−8M E2 for 24 hours. A. Representative fluorescence images obtained after Hoechst 33258 and propidium iodide (PI) double staining. The nuclei of apoptotic cells have highly condensed chromatin that is stained by Hoechst 33258 and PI, indicating by bright blue and red spherical nucleus respectively. At least 200 cells in 6 randomly selected areas were counted in treatment and control cells B. Flow cytometry analysis of apoptosis by double staining with Annexin-V FITC/PI. Numbers indicate the percentage of cells in each quadrant C. The percentage of apoptotic cells (A and B) compared with control cells treated with vehicle (DMSO), respectively was counted from three independent experiments. All data were expressed as means ± SEM (**p < 0.001 and ***p < 0.0001).

References

    1. Parikh S, Hyman D. Hepatocellular cancer: a guide for the internist. The American journal of medicine. 2007;120:194–202. - PubMed
    1. Llovet JM, Burroughs A, Bruix J. Hepatocellular carcinoma. Lancet. 2003;362:1907–1917. - PubMed
    1. Bosch FX, Ribes J, Diaz M, Cleries R. Primary liver cancer: worldwide incidence and trends. Gastroenterology. 2004;127:S5–S16. - PubMed
    1. Shimizu I. Impact of oestrogens on the progression of liver disease. Liver international : official journal of the International Association for the Study of the Liver. 2003;23:63–69. - PubMed
    1. Naugler WE, Sakurai T, Kim S, Maeda S, Kim K, Elsharkawy AM, Karin M. Gender disparity in liver cancer due to sex differences in MyD88-dependent IL-6 production. Science. 2007;317:121–124. - PubMed

MeSH terms