. 2015 Nov 2;25(21):2763-2773.
doi: 10.1016/j.cub.2015.09.018. Epub 2015 Oct 1.

All spiking, sustained ON displaced amacrine cells receive gap-junction input from melanopsin ganglion cells

Affiliations

All spiking, sustained ON displaced amacrine cells receive gap-junction input from melanopsin ganglion cells

Aaron N Reifler et al. Curr Biol. .

Erratum in

  • Curr Biol. 2015 Nov 2;25(21):2878

Abstract

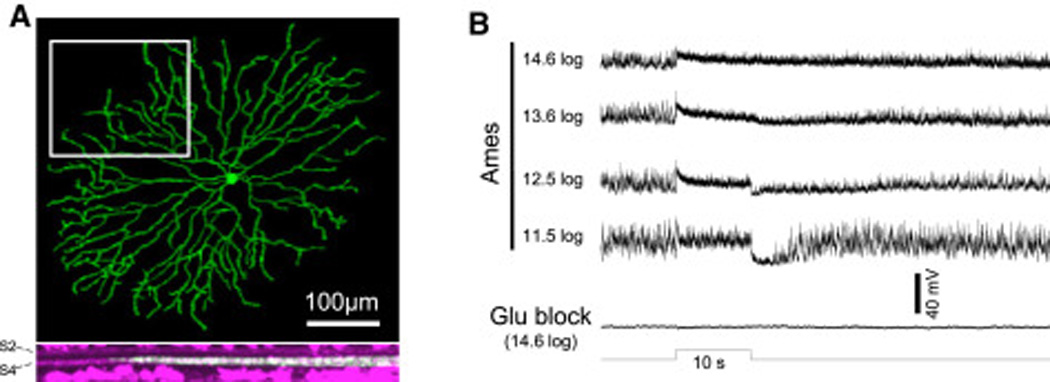
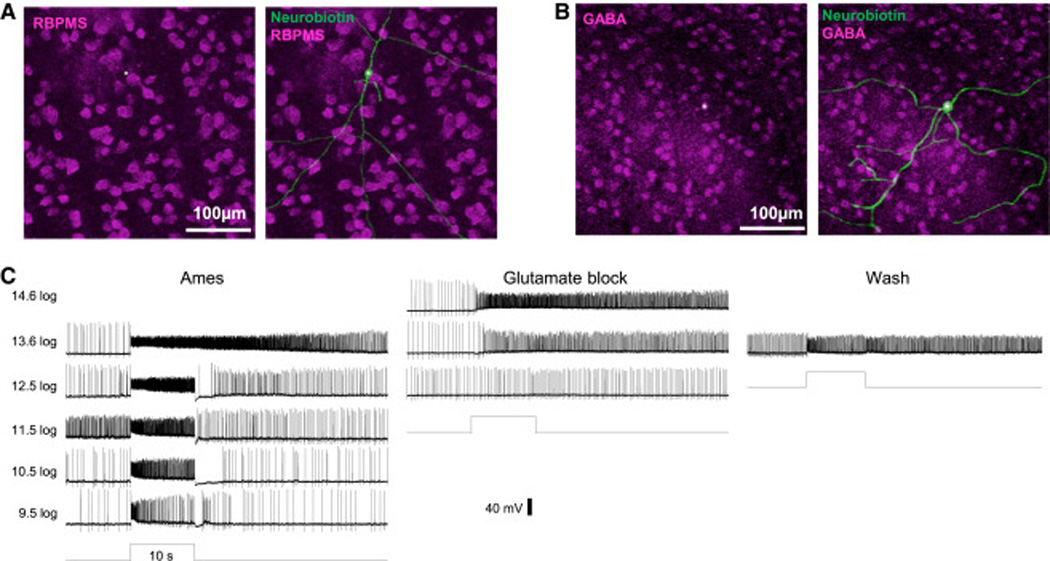
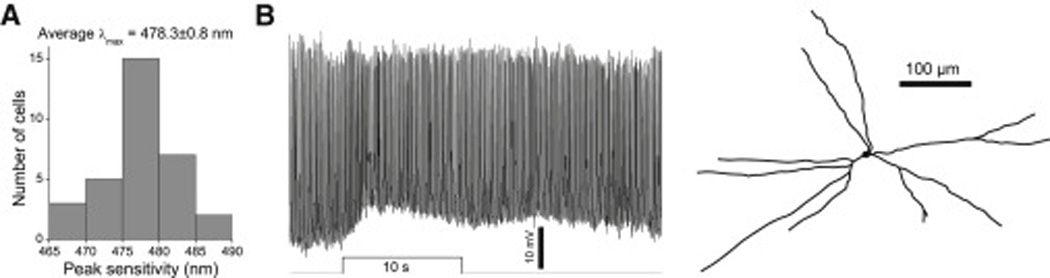
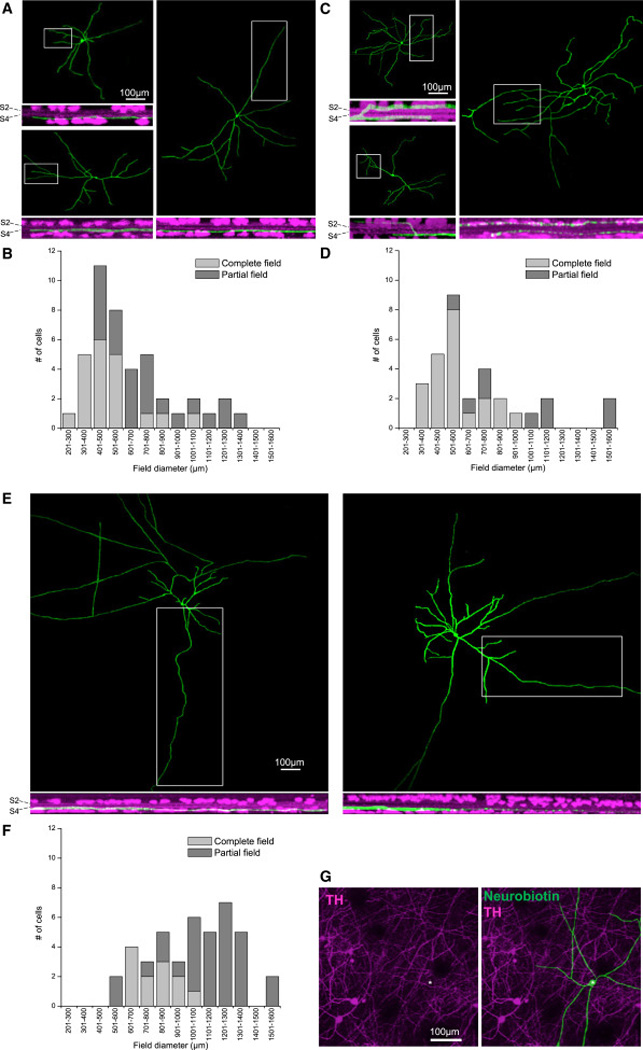
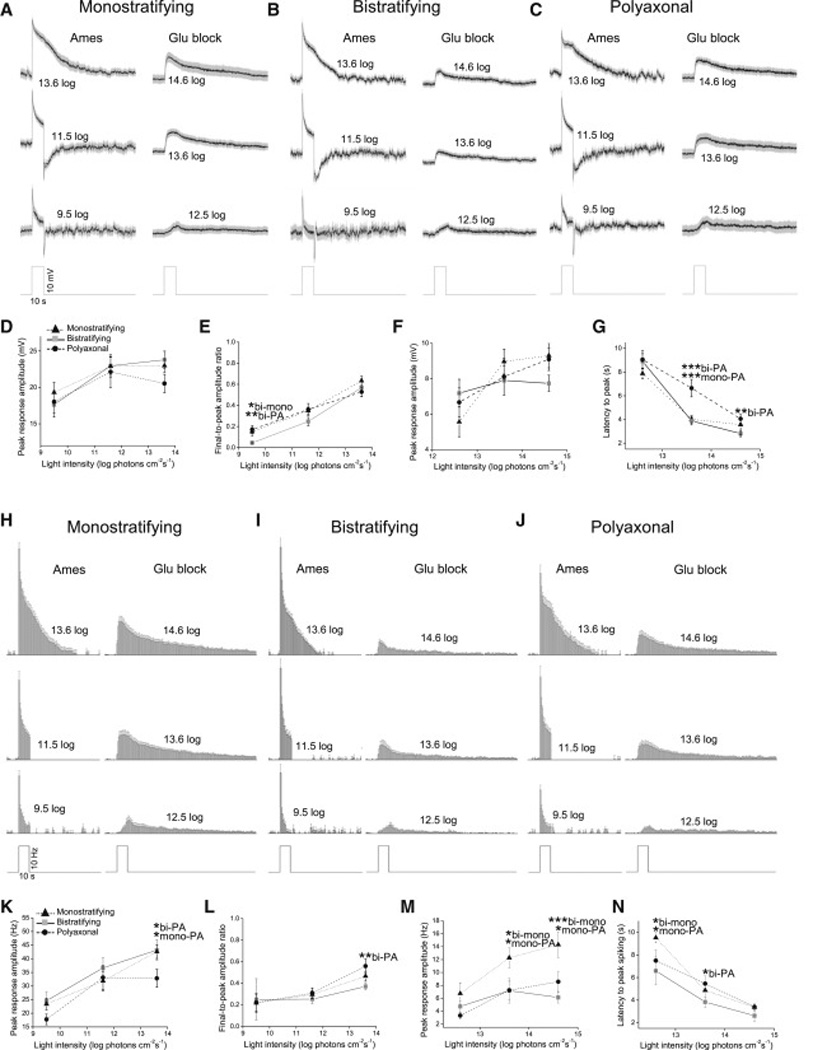
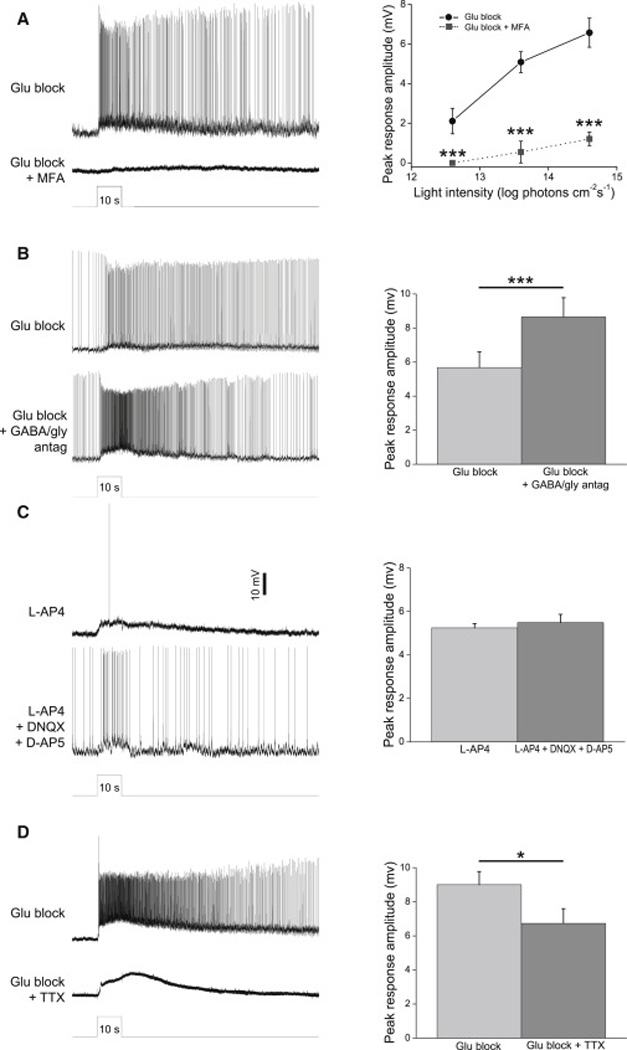
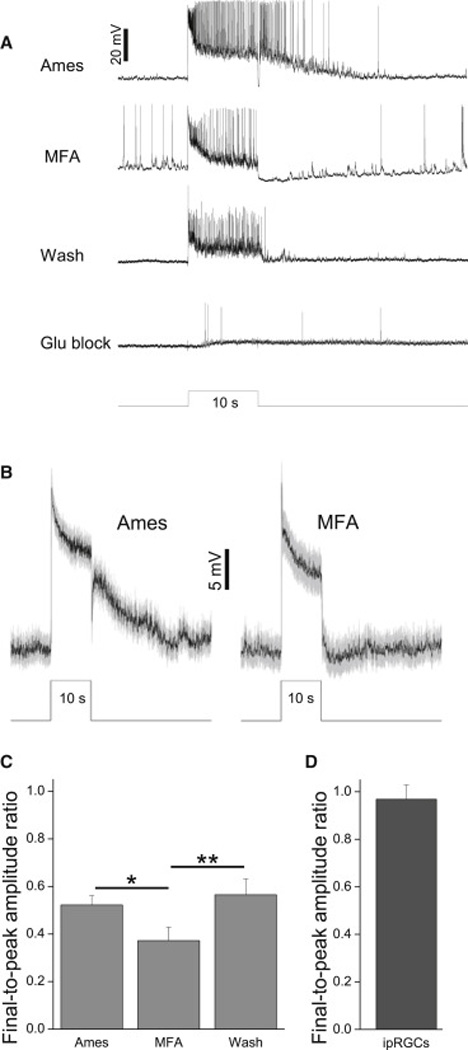
Retinal neurons exhibit sustained versus transient light responses, which are thought to encode low- and high-frequency stimuli, respectively. This dichotomy has been recognized since the earliest intracellular recordings from the 1960s, but the underlying mechanisms are not yet fully understood. We report that in the ganglion cell layer of rat retinas, all spiking amacrine interneurons with sustained ON photoresponses receive gap-junction input from intrinsically photosensitive retinal ganglion cells (ipRGCs), recently discovered photoreceptors that specialize in prolonged irradiance detection. This input presumably allows ipRGCs to regulate the secretion of neuromodulators from these interneurons. We have identified three morphological varieties of such ipRGC-driven displaced amacrine cells: (1) monostratified cells with dendrites terminating exclusively in sublamina S5 of the inner plexiform layer, (2) bistratified cells with dendrites in both S1 and S5, and (3) polyaxonal cells with dendrites and axons stratifying in S5. Most of these amacrine cells are wide field, although some are medium field. The three classes respond to light differently, suggesting that they probably perform diverse functions. These results demonstrate that ipRGCs are a major source of tonic visual information within the retina and exert widespread intraretinal influence. They also add to recent evidence that ganglion cells signal not only to the brain.


Figures

Figure 1
Figure 1. Non-spiking, sustained ON amacrine cells lost photosensitivity during rod/cone signaling block
A) The Lucifer Yellow fill of one such neuron, which was a starburst cell. Top: Confocal z-projection. Bottom: The rotated view of the region highlighted by the rectangle in the top panel. The magenta staining represents ChAT labeling, which marks S2 and S4 of the IPL. B) Light responses from another non-spiking sustained amacrine cell, recorded during superfusion by normal Ames’ medium (top recordings) and after the addition of 50 µM L-AP4, 40 µM DNQX and 25 µM D-AP5 (“glutamate blockers”) to disrupt rod/cone signaling (bottom recording). The log values indicate light intensity in photons cm−2 s−1.
Figure 2
Figure 2. All spiking, sustained ON displaced amacrine cells remained light-sensitive during rod/cone signaling block
A) Besides their lack of ganglion-cell axons, these sustained ON cells’ identity as amacrine cells was confirmed by their lack of the RGC marker RBPMS (magenta). B) Most sustained ON amacrine cells tested for GABA immunostaining were stained (magenta). In both A and B, Neurobiotin in the recorded cells was visualized by Alexa488- conjugated streptavidin (green), and their somas are indicated by asterisks. C) Typical light responses from a spiking sustained ON displaced amacrine cell, recorded in normal Ames’ (left recordings), in the presence of glutamate blockers (middle recordings), and after washout of the drugs (right recording).
Figure 3
Figure 3. Spiking, sustained ON displaced amacrine cells receive ipRGC input
A) λmax for the light responses of 32 sustained ON displaced amacrines measured in the presence of glutamate blockers. The mean λmax was close to that for melanopsin. B) The light response and morphology of a photosensitive displaced amacrine cell from a retinally degenerate mouse. All dendrites of this cell stratified in S5 of the IPL. Light intensity was 15.3 log photons cm−2 s−1.
Figure 4
Figure 4. Morphologies of ipRGC-driven displaced amacrine cells
A – F) Confocal images and field size distributions of spiking, sustained ON displaced amacrines monostratifying in S5 of the IPL (A,B), those bistratifying in S1 and S5 (C,D), and polyaxonal cells (E,F). For the field diameter measurements (B, D and F), we used not only cells whose entire fields were imaged (light columns), but also those with incompletely imaged fields (dark columns). G) ipRGC-driven displaced amacrines are not dopaminergic. Dopaminergic amacrine cells were identified by antibody staining against tyrosine hydroxylase (TH), and the somas of four TH+ cells in the inner nuclear layer are within the field of view. The Neurobiotin-filled ipRGC-driven displaced amacrine cell (asterisk) lacked TH immunostaining.
Figure 5
Figure 5. Light responses of ipRGC-driven displaced amacrine cells
The light responses of 21 monostratifying cells, 15 bistratifying cells and 21 polyaxonal cells were averaged and quantified. Graded responses are shown in AG and spiking responses in H – N. A – C) The averaged graded light responses, recorded in the presence of normal Ames’ medium (left traces) and glutamate blockers (right traces). Spikes were removed by 10 Hz low-pass filtering. The gray areas around the averaged traces represent S.E.M. D,E) Peak amplitude and final-topeak amplitude ratio of the light responses recorded in normal Ames’. F,G) Peak amplitude and latency of the light responses recorded during glutamate block. H – J) Averaged histograms of spiking photoresponses, recorded during normal Ames’ superfusion (left histograms) and glutamate block (right histograms). K,L) Peak amplitude and final-to-peak amplitude ratio of the spiking responses recorded in normal Ames’. M,N) Peak amplitude and latency of the spiking responses during glutamate block. All error bars are S.E.M. *, p < 0.05; **, p < 0.01; ***, p < 0.001.
Figure 6
Figure 6. Synaptic mechanisms for ipRGC signaling to displaced amacrine cells
A) The gap junction blocker MFA (50 – 100 µM) nearly abolished the melanopsin-driven light responses of spiking sustained ON displaced amacrines. Left, example recordings from a polyaxonal cell. Light intensity was 13.6 log photons cm−2 s−1. Right, population data from all 11 cells tested (3 monostratified, 5 bistratified, 3 polyaxonal). B) Melanopsin-driven light responses were not reduced by a cocktail containing GABAA, GABAB, GABAC and glycine receptor antagonists. Left, example recordings from a monostratified cell. Right, population data from all 10 cells tested (5 monostratified, 4 bistratified, 1 polyaxonal). C) All cells that gave spiking sustained ON light responses in the presence of L-AP4 remained photosensitive after the addition of DNQX and DAP5. Left, example recordings from a bistratified cell. Right, population data from all 10 cells tested (3 monostratified, 4 bistratified, 3 polyaxonal). D) The voltage-gated Na+ channel blocker TTX (600 nM) did not abolish displaced amacrine cells’ melanopsin-driven light responses, though it eliminated all spikes. Left, example recordings from a polyaxonal cell. Right, population data from all 11 cells tested (6 monostratified, 1 bistratified, 4 polyaxonal). Light intensity was 13.6 log photons cm−2 s−1 in B through D. *, p < 0.05; ***, p < 0.001.
Figure 7
Figure 7. Rod/cone input to ipRGC-driven displaced amacrine cells is tonic
A) A monostratified amacrine cell’s light responses remained sustained during disruption of ipRGC input by MFA. At the end of this experiment, this cell was confirmed to be ipRGC-driven by its photosensitivity in the presence of glutamate blockers. B) Mean±S.E.M. of all 20 cells tested (11 monostratified, 5 bistratified, 4 polyaxonal). C) The final-to-peak photoresponse amplitude ratio measured under three superfusion conditions. *, p < 0.05; **, p < 0.01. D) The averaged final-topeak photoresponse amplitude ratio measured from 45 ipRGCs (6 M1, 12 M2, 4 M3, 13 M4 and 10 M5) during superfusion with normal Ames’ (ref. [11]). Stimulus intensity was 13.6 log photons cm−2 s−1 in all panels.

References

    1. Masland RH. The fundamental plan of the retina. Nat Neurosci. 2001;4:877–886. - PubMed
    1. Dong CJ, Werblin FS. Temporal contrast enhancement via GABAC feedback at bipolar terminals in the tiger salamander retina. J Neurophysiol. 1998;79:2171–2180. - PubMed
    1. Dixon DB, Copenhagen DR. Two types of glutamate receptors differentially excite amacrine cells in the tiger salamander retina. J Physiol. 1992;449:589–606. - PMC - PubMed
    1. Maguire G. Rapid desensitization converts prolonged glutamate release into a transient EPSC at ribbon synapses between retinal bipolar and amacrine cells. Eur J Neurosci. 1999;11:353–362. - PubMed
    1. Zhang DQ, Wong KY, Sollars PJ, Berson DM, Pickard GE, McMahon DG. Intraretinal signaling by ganglion cell photoreceptors to dopaminergic amacrine neurons. Proc Natl Acad Sci U S A. 2008;105:14181–14186. - PMC - PubMed

Publication types

LinkOut - more resources