. 2015 Oct 6:4:e08150.
doi: 10.7554/eLife.08150.

Cell-to-cell infection by HIV contributes over half of virus infection

Affiliations

Cell-to-cell infection by HIV contributes over half of virus infection

Shingo Iwami et al. Elife. .

Abstract

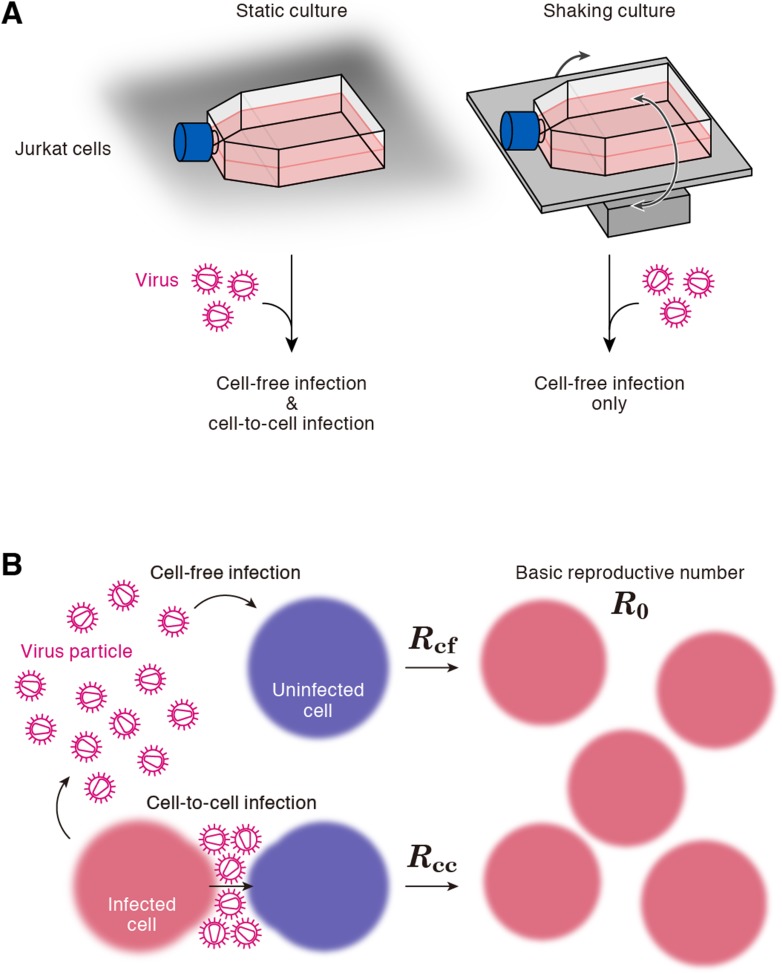
Cell-to-cell viral infection, in which viruses spread through contact of infected cell with surrounding uninfected cells, has been considered as a critical mode of virus infection. However, since it is technically difficult to experimentally discriminate the two modes of viral infection, namely cell-free infection and cell-to-cell infection, the quantitative information that underlies cell-to-cell infection has yet to be elucidated, and its impact on virus spread remains unclear. To address this fundamental question in virology, we quantitatively analyzed the dynamics of cell-to-cell and cell-free human immunodeficiency virus type 1 (HIV-1) infections through experimental-mathematical investigation. Our analyses demonstrated that the cell-to-cell infection mode accounts for approximately 60% of viral infection, and this infection mode shortens the generation time of viruses by 0.9 times and increases the viral fitness by 3.9 times. Our results suggest that even a complete block of the cell-free infection would provide only a limited impact on HIV-1 spread.

Keywords: HIV-1; basic reproduction number; cell-free infection; cell-to-cell infection; computational biology; infectious disease; mathematical model; microbiology; systems biology; viruses.


Conflict of interest statement

The authors declare that no competing interests exist.

Figures

Figure 1.
Figure 1.. Cell culture systems and the basic reproduction number under cell-to-cell and cell-free infection.
(A) Static and shaking cultures of Jurkat cells. The static and shaking cell cultures allow human immunodeficiency virus type 1 (HIV-1) to perform both cell-free and cell-to-cell infection, and only cell-free infection, respectively. (B) The basic reproduction number, R0, is defined as the number of the secondly infected cells produced from a typical infected cell during its infectious period. In the presence of the cell-to-cell and cell-free infection, the basic reproduction number consists of two sub-reproduction numbers through the cell-free infection, Rcf, and through the cell-to-cell infection, Rcc, respectively. DOI: http://dx.doi.org/10.7554/eLife.08150.003
Figure 2.
Figure 2.. Dynamics of HIV-1 infection in Jurkat cells through cell-free and cell-to-cell infection.
Jurkat cells were inoculated with HIV-1 (at multiplicity of infection 0.1) in the static and shaking cell cultures. Panels A and B show the time-course of experimental data for the numbers of uninfected cells (top) and infected cells (middle), and the amount of viral protein p24 (bottom) in the static and shaking cell culture systems, respectively. The shadow regions correspond to 95% posterior predictive intervals, the dashed curves give the best-fit solution (mean) for Equations 1–3 to the time-course dataset. All data in each experiment were fitted simultaneously. In panels A and B, the results of three independent experiments are respectively shown. DOI: http://dx.doi.org/10.7554/eLife.08150.005
Figure 2—figure supplement 1.
Figure 2—figure supplement 1.. No effect of the shaking procedure on HIV-1 cell-free infection.
Jurkat cells were infected with HIV-1 (at multiplicity of infection 1) as described in ‘Materials and methods’, and the infected cells were cultured in the static and the shaking condition. By harvesting the cells at 24 and 48 hr postinfection, the cells were analyzed by flow cytometry as described in ‘Materials and methods’. The percentage of the average of p24-positive cells are shown with SD. The assay was performed in triplicate, and the representative result is shown. Note that the ratio of input virus to target cells (multiplicity of infection) of this experiment is 10-fold higher than that of the experiment shown in Figure 2. This is for the clear detection of the infected cells (p24-positive cells) during early time points. DOI: http://dx.doi.org/10.7554/eLife.08150.006
Figure 2—figure supplement 2.
Figure 2—figure supplement 2.. Dynamics of Jurkat cell growth.
Dynamics of Jurkat cell growth in the static and shaking cell cultures. By harvesting the cells for 37 days (A) in the static and (B) in the shaking cell cultures, the growth kinetics of Jurkat cells in these conditions was estimated as described in Materials and methods. DOI: http://dx.doi.org/10.7554/eLife.08150.007
Figure 2—figure supplement 3.
Figure 2—figure supplement 3.. Dot plots of infected cells by flow cytometry.
Representative results of flow cytometry (experiment 1). Time-course results of flow cytometry analyses on experiment 1 of static (left) and shaking (right) cultures are respectively shown. The cells positive for p24 antigen is gated in pink, and the number in the bottom right of the gate indicates the percentage of p24-positive cells. The data is available upon request. DOI: http://dx.doi.org/10.7554/eLife.08150.008
Figure 3.
Figure 3.. Distribution of the basic reproduction numbers, generation time, and Malthus coefficient.
The distribution of the basic reproduction number, R0, the number of secondary infected cells through the cell-free infection, Rcf, and the cell-to-cell infection, Rcc, calculated from all accepted Markov Chain Monte Carlo (MCMC) parameter estimates are shown in A, B, and C, respectively. The contribution of the cell-to-cell infection (i.e., Rcc/(Rcf + Rcc)) is distributed as in D. For each plot, the last 15,000 MCMC samples among the total 50,000 samples are used. a.u., arbitrary unit. DOI: http://dx.doi.org/10.7554/eLife.08150.009
Figure 4.
Figure 4.. Simulating cell-to-cell infection of HIV-1.
Using our estimated parameters, the pure cell-to-cell infection is simulated in silico (solid curves). The simulated values are located between the time course of experimental data under the static conditions (closed circles) and those under the shaking conditions (open circles). The shadowed regions correspond to 95% posterior predictive intervals. DOI: http://dx.doi.org/10.7554/eLife.08150.011
Author response image 1.
Author response image 1.. Punctual model for parameter estimation.
The time course of experimental data for the numbers of uninfected cells (top) and infected cells (middle), and the amount of viral p24 antigen (bottom) in the static (left) and shaking (right) culture systems, respectively. The solid curves depict the best fit of the punctual model to the time-course dataset. All data in the experiment 3 were fitted simultaneously. For the experiments 1 and 2, we obtained similar fitting and parameter estimation values (data not shown). DOI: http://dx.doi.org/10.7554/eLife.08150.017

References

    1. Adachi A, Gendelman HE, Koenig S, Folks T, Willey R, Rabson A, Martin MA. Production of acquired immunodeficiency syndrome-associated retrovirus in human and nonhuman cells transfected with an infectious molecular clone. Journal of Virology. 1986;59:284–291. - PMC - PubMed
    1. Agosto LM, Zhong P, Munro J, Mothes W. Highly active antiretroviral therapies are effective against HIV-1 cell-to-cell transmission. PLOS Pathogens. 2014;10:e1003982. doi: 10.1371/journal.ppat.1003982. - DOI - PMC - PubMed
    1. Carr JM, Hocking H, Li P, Burrell CJ. Rapid and efficient cell-to-cell transmission of human immunodeficiency virus infection from monocyte-derived macrophages to peripheral blood lymphocytes. Virology. 1999;265:319–329. doi: 10.1006/viro.1999.0047. - DOI - PubMed
    1. Chen P, Hübner W, Spinelli MA, Chen BK. Predominant mode of human immunodeficiency virus transfer between T cells is mediated by sustained Env-dependent neutralization-resistant virological synapses. Journal of Virology. 2007;81:12582–12595. doi: 10.1128/JVI.00381-07. - DOI - PMC - PubMed
    1. Dimitrov DS, Willey RL, Sato H, Chang LJ, Blumenthal R, Martin MA. Quantitation of human immunodeficiency virus type 1 infection kinetics. Journal of Virology. 1993;67:2182–2190. - PMC - PubMed

Publication types