. 2015 Sep 14:9:361.
doi: 10.3389/fncel.2015.00361. eCollection 2015.

Activated regulatory T cell regulates neural stem cell proliferation in the subventricular zone of normal and ischemic mouse brain through interleukin 10

Affiliations

Activated regulatory T cell regulates neural stem cell proliferation in the subventricular zone of normal and ischemic mouse brain through interleukin 10

Jixian Wang et al. Front Cell Neurosci. .

Abstract

Recent studies have demonstrated that the depletion of Regulatory T cells (Tregs) inhibits neural progenitor cell migration after brain ischemia. However, whether Tregs affect neural stem/progenitor cell proliferation is unclear. We explored the effect of Tregs on neurogenesis in the subventricular zone (SVZ) after ischemia. Tregs were isolated and activated in vitro. Adult male C57BL/6 mice underwent 60 min transient middle cerebral artery occlusion (tMCAO). Then Tregs (1 × 10(5)) were injected into the left lateral ventricle (LV) of normal and ischemic mouse brain. Neurogenesis was determined by immunostaining. The mechanism was examined by inhibiting interleukin 10 (IL-10) and transforming growth factor (TGF-β) signaling. We found that the number of BrdU(+) cells in the SVZ was significantly increased in the activated Tregs-treated mice. Double immunostaining showed that these BrdU(+) cells expressed Mash1. Blocking IL-10 reduced the number of Mash1(+)/BrdU(+) cells, but increased the amount of GFAP(+)/BrdU(+) cells. Here, we conclude that activated Tregs enhanced neural stem cell (NSC) proliferation in the SVZ of normal and ischemic mice; blockage of IL-10 abolished Tregs-mediated NSC proliferation in vivo and in vitro. Our results suggest that activated Tregs promoted NSC proliferation via IL-10, which provides a new therapeutic approach for ischemic stroke.

Keywords: brain ischemia; interleukin 10; neurogenesis; regulatory T cell; subventricular zone.


Figures
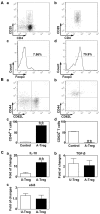
Figure 1
Figure 1
Tregs were identified by CD4/CD25 and activated by CD3e/CD28/IL-2. (A) CD4+/CD25+ Tregs isolated from mouse spleen were analyzed by a flow cytometry sorting (FACS). CD4+/CD25+ (b) and Foxp3 (d) were detected after CD4+/CD25+ Tregs isolation via magnetic activated cytometry sorting (MACS) and FACS, enriched CD4+ T cells isolated by MACS being used as the control (a,c). (B) CD44 (a,c) and CD62L (b,d) expression on Tregs after activation. Peripheral blood was used as the control. Data were mean ± SD, using the student t test. N = 3 per group. ** p < 0.01, A-Treg group vs. Control group. (C) IL-10 (a), TGF-β (b) and ebi3 (c) mRNA expression of un-stimulated and activated Tregs were quantified by qRT-PCR. Data were mean ± SD, using the student t test. N = 5–7 per group. **p < 0.01, A-Treg group vs. U-Treg group. U-Treg, un-stimulated Tregs; A-Treg, activated Tregs.
Figure 2
Figure 2
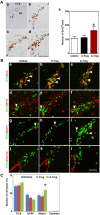
Activated Tregs promoted NSC proliferation in the SVZ of naïve mice. (A) BrdU DAB staining was performed in the Vehicle (b), U-Treg (c) and A-Treg (d) groups of normal mouse. Scale bar = 50 μm. The number of BrdU positive cells was counted in the anterior of SVZ (in the black box of a). Bar graph (e) semi-quantified the number of BrdU+ cell in the Vehicle, U-Treg and A-Treg groups of naïve mice. Scale bar = 100 μm. Data were mean ± SD, using the one-way ANOVA followed by Turkey post hoc comparisons. N = 5 per group. *p < 0.05, A-Treg vs. U-Treg and Vehicle groups. (B) Four types of neural stem cell in (NSC) the mouse SVZ were identified by immunofluorescence following PBS, un-stimulated and activated Tregs injecting into lateral ventricle (LV). BrdU double stained with DCX (a–c), GFAP (d–f), Mash1 (g–i) and Vimentin (j–l) were presented respectively in Vehicle, U-Treg and A-Treg groups. The arrow indicated the double-stained positive cells. Scale bar = 50 μm. (C) The percentage of the four cell types in BrdU+ cells were quantified in Vehicle, U-Treg and A-Treg groups, separately. Data were mean ± SD, using the one-way ANOVA followed by Turkey post hoc comparisons. N = 5 per group. *p < 0.05, A-Treg group vs. Vehicle and U-Treg groups. Vehicle, PBS injection; U-Treg, un-stimulated Tregs injection; A-Treg, activated Tregs injection.
Figure 3
Figure 3
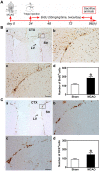
Brain ischemia induced NSC proliferation. (A) Flow chart of the experiment. Mice underwent MCAO at day 0, followed by Tregs transcranial injection into LV at day 1. Then BrdU was administrated by intraperitoneal injection for 3 days. Finally, mice were sacrificed for immunostaining. (B) Photomicrographs showed BrdU+ cells in the ipsilateral SVZ in the sham (b) and the MCAO (c) group. The black box (a) represented the region we are interested and BrdU+ cell counted. (d) Bar graph demonstrated the number of BrdU+ cells in the sham and the MCAO groups. Data were mean ± SD, using the student t test. Scale bar = 100 μm. N = 5 per group.*p < 0.05, MCAO group vs. Sham group. (C) DCX+ cells were detected by immunostaining in the sham (b) and MCAO (c) groups. The selected area where we counted DCX+ cells was shown in the black box (a). Comparison of DCX+ cells number between sham and MCAO group (d). Scale bar = 100 μm. Data were mean ± SD, using the student t test. N = 5 per group. *p < 0.05, MCAO vs. sham and U-Treg groups.
Figure 4
Figure 4
Activated Tregs promoted NSC proliferation in the SVZ of mice following middle cerebral artery occlusion (MCAO). (A) Photograph of immunofluorescence staining showed BrdU+ cells in the SVZ of MCAO mice treated with PBS (b), un-stimulated Tregs (c) and activated Tregs (d) injection into the left LV. The black box (a) showed the area we counted the cells. BrdU+ cell number was quantified in the three groups (e). Scale bar = 100 μm. Data were presented as mean ± SD, using the one-way ANOVA followed by Turkey post hoc comparisons. N = 5–10 per group. *p < 0.05, A-Treg group vs. U-Treg and Vehicle groups. (B) Double-labeled fluorescence staining detected the expression of BrdU+/DCX+ (a–c), BrdU+/GFAP+ B (d–f), BrdU+/Mash1+ C (g–i) and BrdU+/Vimentin+ (j–l) in SVZ of mice after MCAO in Vehicle, U-Treg and A-Treg groups. The arrow indicated the positive cells. Scale bar = 50 μm. (C) Statistical analysis of the percentage of A, B, C and E type in BrdU+ cells after PBS, Vehicle, un-stimulated and activated Tregs (d) injection. Data were mean ± SD, using the one-way ANOVA followed by Turkey post hoc comparisons. N = 5 per group.*p < 0.05, A-Treg vs. Vehicle and U-Treg groups.
Figure 5
Figure 5
Activated Tregs did not affect stroke outcomes in mice. (A) Cresyl violet staining of mice brain sections showed the infarct volume after 3 days treatments following MCAO. The outlines indicated the infarct area. (B) Quantification of the infarct volumes. (C) Bar graph showed the mNSS test to evaluate neurological deficiency after 3 days treatments in MCAO mice. (D) Bar graph represented the elevated body swing test scores to measure the percentage of turns to the impaired side. Data were mean ± SD, using the one-way ANOVA followed by Turkey post hoc comparisons. N = 7–8 per group.
Figure 6
Figure 6
Tregs in the LV and adjacent brain parenchyma. GFP-Tregs stained with DAPI were presented respectively in vehicle, U-Treg and A-Treg groups. Picture at the upper left showed the diagram of coronal brain section. The black box represents the region we observed. The arrows showed U-Treg-GFP and A-Treg-GFP cells.
Figure 7
Figure 7
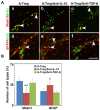
Activated Tregs promoted NSC proliferation through IL-10 in vivo. (A) Type C and type B cells in the mouse SVZ were identified by immunofluorescence following activated Tregs, activated Tregs plus IL-10 or TGF-β neutralizing antibodies injecting into LV of naïve mice. BrdU double stained with Mash1 (a–c) and GFAP (d–f) were presented respectively in A-Treg, A-Treg/anti-IL-10 and A-Treg /anti-TGF-β group. Scale bar = 50 μm. (B) Bar graph showed the percentage of C and B types in BrdU+ cells after in A-Treg, A-Treg/anti-IL-10 and A-Treg /anti-TGF-β group. Data were mean ± SD, using the one-way ANOVA followed by Turkey post hoc comparisons. N = 5 per group. *p < 0.05, **p < 0.01, A-Tregs vs. A-Treg/Anti-IL-10 and A-Treg/Anti-TGF-β group.
Figure 8
Figure 8
Activated Tregs enhanced neurosphere proliferation via IL-10 in vitro. (A) Neural spheres were observed after 3 days treatment under inverted phase contrast microscope. a–c respectively showed the growing states of neural sphere cultured in normal medium, co-cultured with activated Tregs and activated Tregs plus anti-IL-10. d–f represented the magnification of the black box in a–c. (B) The size and number of neural sphere treated with activated Tregs and activated Tregs A-Treg plus anti-IL-10 was quantified. Data were mean ± SD, using the one-way ANOVA followed by Turkey post hoc comparisons. N = 6 per group. *p < 0.05, **p < 0.01, A-Treg group vs. A-Treg/Anti-IL-10 and control group.

References

    1. Barrat F. J., Cua D. J., Boonstra A., Richards D. F., Crain C., Savelkoul H. F., et al. . (2002). In vitro generation of interleukin 10-producing regulatory CD4(+) T cells is induced by immunosuppressive drugs and inhibited by T helper type 1 (Th1)- and Th2-inducing cytokines. J. Exp. Med. 195, 603–616. 10.1084/jem.20011629 - DOI - PMC - PubMed
    1. Becker K. J. (2010). Modulation of the postischemic immune response to improve stroke outcome. Stroke 41, S75–S78. 10.1161/STROKEAHA.110.592881 - DOI - PMC - PubMed
    1. Brait V. H., Arumugam T. V., Drummond G. R., Sobey C. G. (2012). Importance of T lymphocytes in brain injury, immunodeficiency and recovery after cerebral ischemia. J. Cereb. Blood. Flow Metab. 32, 598–611. 10.1038/jcbfm.2012.6 - DOI - PMC - PubMed
    1. Brea D., Agulla J., Rodríguez-Yáñez M., Barral D., Ramos-Cabrer P., Campos F., et al. . (2014). Regulatory T cells modulate inflammation and reduce infarct volume in experimental brain ischaemia. J. Cell. Mol. Med. 18, 1571–1579. 10.1111/jcmm.12304 - DOI - PMC - PubMed
    1. Buckwalter M. S., Yamane M., Coleman B. S., Ormerod B. K., Chin J. T., Palmer T., et al. . (2006). Chronically increased transforming growth factor-beta1 strongly inhibits hippocampal neurogenesis in aged mice. Am. J. Pathol. 169, 154–164. 10.2353/ajpath.2006.051272 - DOI - PMC - PubMed

LinkOut - more resources