. 2015 Sep 25:6:210.
doi: 10.3389/fphar.2015.00210. eCollection 2015.

Different pH-sensitivity patterns of 30 sodium channel inhibitors suggest chemically different pools along the access pathway

Affiliations

Different pH-sensitivity patterns of 30 sodium channel inhibitors suggest chemically different pools along the access pathway

Alexandra Lazar et al. Front Pharmacol. .

Abstract

The major drug binding site of sodium channels is inaccessible from the extracellular side, drug molecules can only access it either from the membrane phase, or from the intracellular aqueous phase. For this reason, ligand-membrane interactions are as important determinants of inhibitor properties, as ligand-protein interactions. One-way to probe this is to modify the pH of the extracellular fluid, which alters the ratio of charged vs. uncharged forms of some compounds, thereby changing their interaction with the membrane. In this electrophysiology study we used three different pH values: 6.0, 7.3, and 8.6 to test the significance of the protonation-deprotonation equilibrium in drug access and affinity. We investigated drugs of several different indications: carbamazepine, lamotrigine, phenytoin, lidocaine, bupivacaine, mexiletine, flecainide, ranolazine, riluzole, memantine, ritanserin, tolperisone, silperisone, ambroxol, haloperidol, chlorpromazine, clozapine, fluoxetine, sertraline, paroxetine, amitriptyline, imipramine, desipramine, maprotiline, nisoxetine, mianserin, mirtazapine, venlafaxine, nefazodone, and trazodone. We recorded the pH-dependence of potency, reversibility, as well as onset/offset kinetics. As expected, we observed a strong correlation between the acidic dissociation constant (pKa) of drugs and the pH-dependence of their potency. Unexpectedly, however, the pH-dependence of reversibility or kinetics showed diverse patterns, not simple correlation. Our data are best explained by a model where drug molecules can be trapped in at least two chemically different environments: A hydrophilic trap (which may be the aqueous cavity within the inner vestibule), which favors polar and less lipophilic compounds, and a lipophilic trap (which may be the membrane phase itself, and/or lipophilic binding sites on the channel). Rescue from the hydrophilic and lipophilic traps can be promoted by alkalic and acidic extracellular pH, respectively.

Keywords: antidepressant; automated patch-clamp; local anesthetic; pH; sodium channel blocker.


Figures
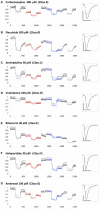
Figure 1
Figure 1
Examples for the different types of pH-dependence patterns exhibited by the compounds. Peak amplitudes are plotted against time during the whole experiment. Sodium currents were evoked by 5 Hz trains of 5 pulses, repeated in every 20 s. The pH of the perfusion medium was changed in the following order: neutral (black-gray-black)—acidic (red-pink-red)—neutral (black)—alkalic (dark-light-dark blue)—neutral (black-gray-black). Each major period consisted of 10 control trains, 10 trains during drug application (shown by light colors) and 10 trains during wash-out. Each plot shows the averaged normalized amplitudes of five individual experiments. All experiments were normalized to the amplitude of the current evoked by the first depolarization of the last train under control conditions. Thin black lines show the average of the five exponentials fit to individual curves, as described in Methods. Example traces from individual measurements are shown in the right panel. Black traces: Currents evoked by the first depolarization of the last control train [circled in (A)]. Gray traces: Currents evoked by the first depolarization of the last train during the first drug application period [circled in (A)]. Scale bars: 1 nA, 1 ms. (A–G) Examples for a member of each class from Class (A–G).
Figure 2
Figure 2
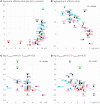
pH-dependence of three properties of inhibiton. The pH-dependence of (A) apparent affinity, (B) reversibility, and (C) onset time constant is illustrated for the 30 drugs. For the sake of clarity, the plots are divided into three parts: Left column shows Class C (dark blue) and Class F (light blue) compounds. Middle column shows Class A (red), Class B (light green), and Class E (purple) compounds. Right column shows Class D (dark green) and Class G (magenta) compounds. Identity of compounds is shown by the three-letter code, as shown in Table 1, except: M30 – memantine 30 μM, M100 – memantine 100 μM, L300 – lidocaine 300 μM, L1000 – lidocaine 1000 μM.
Figure 3
Figure 3
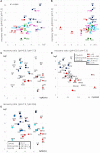
Position of compound classes within the chemical space. We attempted to correlate pH-dependent behavior patterns (i.e., Classes A–G) with the chemical properties of the classes (i.e., their location within the chemical space). Classes are color-coded (same colors as in Figure 2), three-letter codes identify individual drugs. The insets are the exact same plots, where we marked the outlines of the areas occupied by specific classes. (A) logD(6.3) vs. logN(pKa) plot, (B) logP vs. aromatic atom count (AAC) plot, and (C) polar surface area (PSA) (Å2) vs. minimal projection area (Å2).
Figure 4
Figure 4
Schematic model of the sub-processes of drug access. An illustration of the hypothetical sub-processes of drug access that must be supposed based on experimental data: (1) partitioning of the charged molecule at the outer membrane interface; (2) protonation/deprotonation in the extracellular space; (3) partitioning of the neutral molecule at the outer membrane interface; (4) protonation/deprotonation at the outer membrane interface; (5) entry/exit through the fenestration (hydrophobic pathway); (6) protonation/deprotonation within the inner vestibule; (7) protonation/deprotonation at the inner membrane interface; (8) intracellular diffusion; (9) entry/exit through the activation gate (hydrophilic pathway).
Figure 5
Figure 5
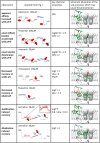
Suggested contribution of the sub-processes of drug access to seven experimentally detected phenomena. Seven phenomena of pH-dependence detected in experiments. 2nd column: Illustration of the phenomena on peak amplitude vs. time plots. 3rd column: Chemical properties that are likely to determine occurrence of the phenomenon. 4th column: Sub-processes affected during the occurrence of the phenomena. Green and red arrows indicate accelerated and decelerated sub-processes, respectively. Circled molecules indicate accumulation of drug molecules in that specific position.
Figure 6
Figure 6
Chemical properties affecting pH-dependent affinity and onset kinetics. Correlations of the extent of pH-dependence with chemical properties. Classes are color-coded (same colors as in Figure 2), three-letter codes identify individual drugs. (A) Ratios of apparent affinities measured at alkalic vs. neutral solution, plotted against calculated pKa values of the drugs. (B) The same correlation could be made close to linear by mathematical transformations: The logarithm of the alkalic/neutral apparent affinity ratio, plotted against the logarithm of the percentage of neutral form at pH = 7.3 [logN(pKa)] (neutral fraction was calculated from pKa values using the Henderson–Hasselbalch equation—see Methods). (C) pH-dependent acceleration/deceleration of onset as a function of aromatic atom count (AAC). (D) pH-dependent acceleration/deceleration of onset as a function of logD(7.3).
Figure 7
Figure 7
Chemical properties affecting pH-dependent reversibility. Correlations of acidification- and alkalization-induced changes in recovery with chemical properties. (A) Ratios of acidic (pH = 6.0) vs. neutral (pH = 7.3) recovery are plotted against logP and (B) against pKa. In both panels classes are color-coded (as in Figure 2), three-letter codes identify individual drugs. (C) Acidic/neutral recovery ratios are color coded, and plotted on the logP against logN(pKa) plane, and (D) on the logP against polar surface area/molecular weight (PSA/MW) plane. Light and dark red indicates moderately and strongly decreased recovery, respectively; gray indicates no change; light and dark blue indicates moderately and strongly increased recovery, respectively. [See (D) for color codes. “R” stands for “ratio”). The size of the data points indicates the level of significance, as it is also shown in (D). (E) Neutral/alkalic recovery ratios are color coded and plotted on the logP against logN(pKa) plane. Light to dark blue indicates increasing ratios, red indicates minimal or no change. Levels of significance are coded by the size of data points. Codes are shown in the lower left corner.
Figure 8
Figure 8
Chemical properties affecting acidification-induced recovery. (A) Correlation between recovery caused by alkalic-to-neutral and neutral-to-acidic solution exchange. (B) Acidification-induced recovery plotted against logP and (C) pKa. The sum of the logarithms of the two recovery steps (neutral-to-acidic and alkalic-to-neutral) was used as a measure of acidification-induced recovery.
Figure 9
Figure 9
Chemical properties affecting alkalization-induced recovery. Neutral-to-alkalic solution exchange-induced recovery plotted against logP.

References

    1. Anno T., Hondeghem L. M. (1990). Interactions of flecainide with guinea pig cardiac sodium channels. Importance of activation unblocking to the voltage dependence of recovery. Circ. Res. 66, 789–803. 10.1161/01.RES.66.3.789 - DOI - PubMed
    1. Barber A. F., Carnevale V., Klein M. L., Eckenhoff R. G., Covarrubias M. (2014). Modulation of a voltage-gated Na+ channel by sevoflurane involves multiple sites and distinct mechanisms. Proc. Natl. Acad. Sci.U.S.A. 111, 6726–6731. 10.1073/pnas.1405768111 - DOI - PMC - PubMed
    1. Boiteux C., Vorobyov I., French R. J., French C., Yarov-Yarovoy V., Allen T. W. (2014). Local anesthetic and antiepileptic drug access and binding to a bacterial voltage-gated sodium channel. Proc. Natl. Acad. Sci. U.S.A. 111, 13057–13062. 10.1073/pnas.1408710111 - DOI - PMC - PubMed
    1. Bokesch P. M., Post C., Strichartz G. (1986). Structure-activity relationship of lidocaine homologs producing tonic and frequency-dependent impulse blockade in nerve. J. Pharmacol. Exp. Ther. 237, 773–781. - PubMed
    1. Brown M. L., Brown G. B., Brouillette W. J. (1997). Effects of log P and phenyl ring conformation on the binding of 5-phenylhydantoins to the voltage-dependent sodium channel. J. Med. Chem. 40, 602–607. 10.1021/jm960692v - DOI - PubMed