Review
. 2015 Sep 11:6:692.
doi: 10.3389/fpls.2015.00692. eCollection 2015.

Biogeography of photoautotrophs in the high polar biome

Affiliations
Review

Biogeography of photoautotrophs in the high polar biome

Stephen B Pointing et al. Front Plant Sci. .

Abstract

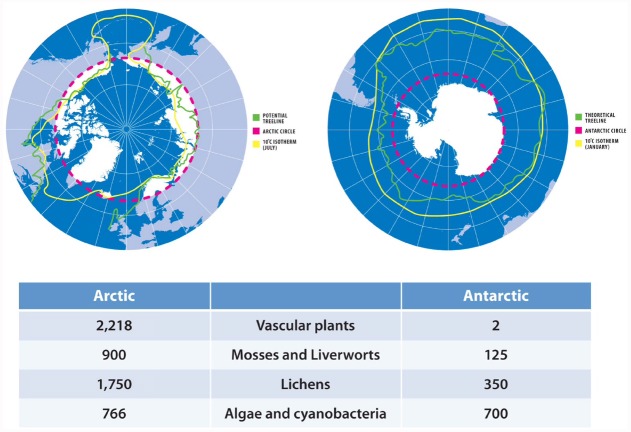
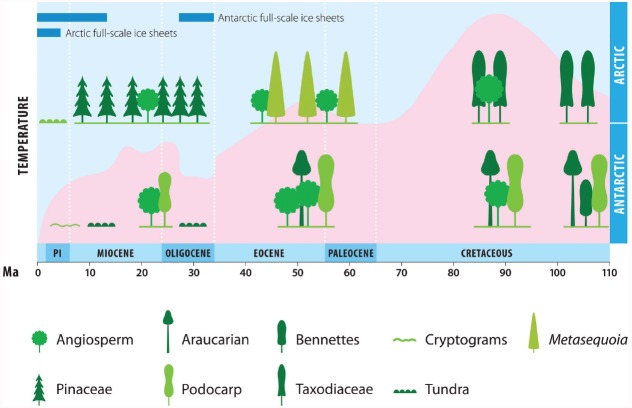
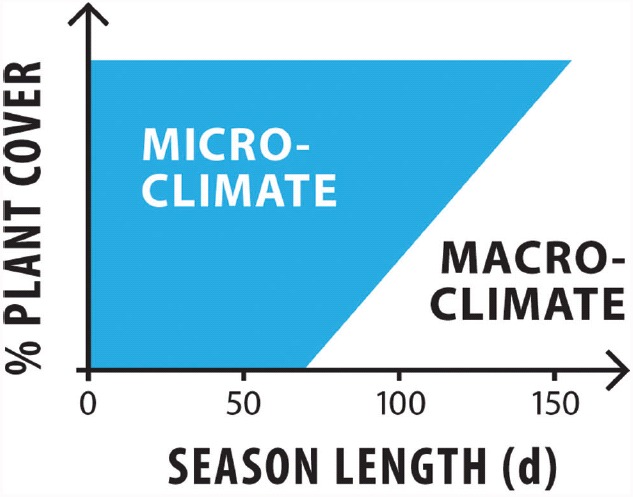
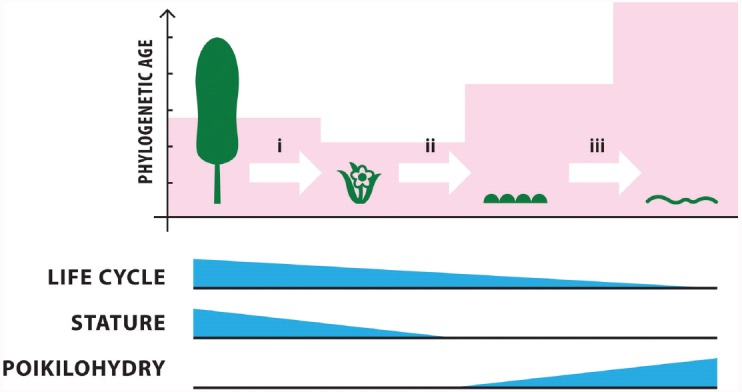
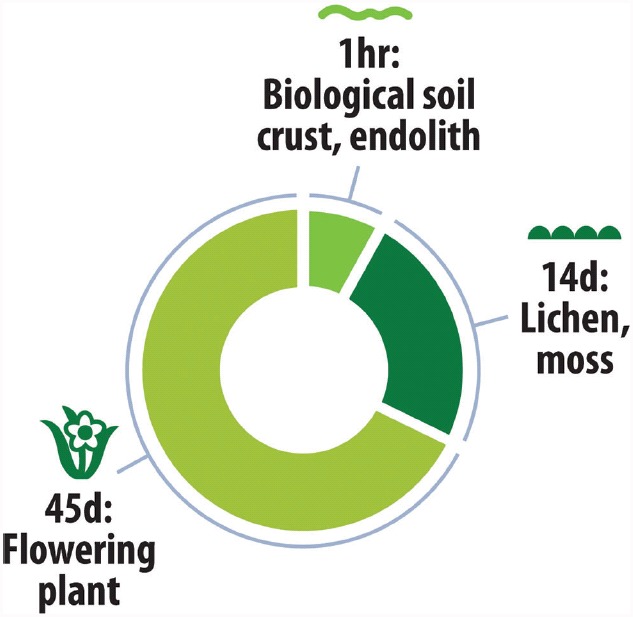
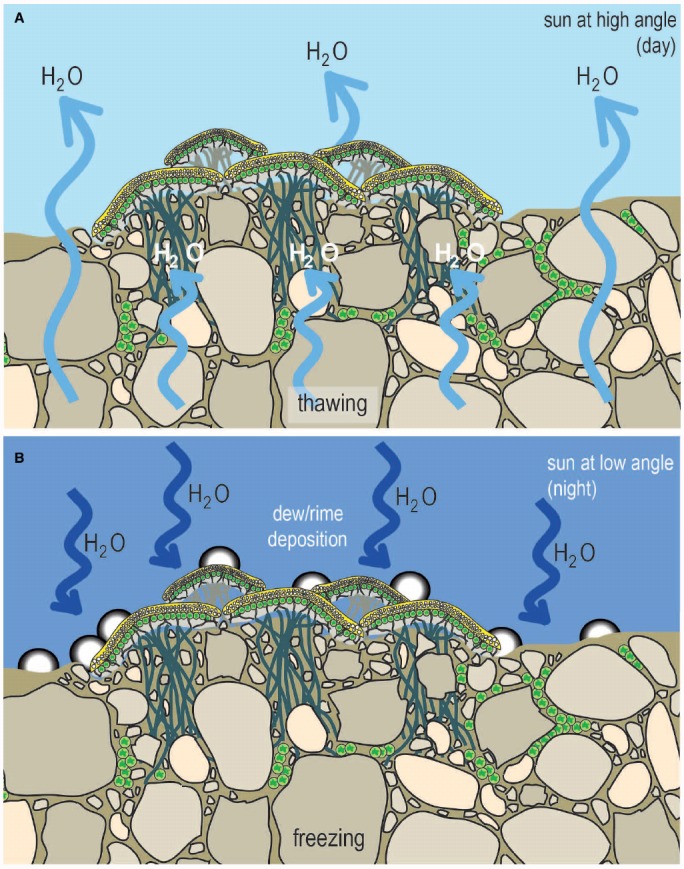
The global latitudinal gradient in biodiversity weakens in the high polar biome and so an alternative explanation for distribution of Arctic and Antarctic photoautotrophs is required. Here we identify how temporal, microclimate and evolutionary drivers of biogeography are important, rather than the macroclimate features that drive plant diversity patterns elsewhere. High polar ecosystems are biologically unique, with a more central role for bryophytes, lichens and microbial photoautotrophs over that of vascular plants. Constraints on vascular plants arise mainly due to stature and ontogenetic barriers. Conversely non-vascular plant and microbial photoautotroph distribution is correlated with favorable microclimates and the capacity for poikilohydric dormancy. Contemporary distribution also depends on evolutionary history, with adaptive and dispersal traits as well as legacy influencing biogeography. We highlight the relevance of these findings to predicting future impacts on diversity of polar photoautotrophs and to the current status of plants in Arctic and Antarctic conservation policy frameworks.

Keywords: antarctic; arctic; bryophytes; cryptogams; cyanobacteria; lichen; plant biogeography.


Figures

FIGURE 1
FIGURE 1
Extent of contemporary Arctic and Antarctic habitats for polar photoautotrophs. Red line: Arctic/Antarctic Circle; Yellow line: 10°C summer isotherm; Green line: treeline. Arctic treeline calculated as extent of summer mean temperature at or above 6.4°C, with the growing season defined as the sum of days with a daily mean temperature of 0.9°C and not falling below 94 such days (blue line; Paulsen and Körner, 2014). Biodiversity data shows number of species, and was collated from the National Snow and Ice Data Center (https://nsidc.org/cryosphere/frozenground/plants.html) and Arctic Biodiversity Assessment (http://www.arcticbiodiversity.is/the-report/chapters/plants) (Arctic), and British Antarctic Survey (http://www.antarctica.ac.uk/about_antarctica/wildlife/plants) and Australian Antarctic Division (http://www.antarctica.gov.au/about-antarctica/wildlife/plants) (Antarctic).
FIGURE 2
FIGURE 2
Historical biogeography of polar photoautotrophs. Historic climate and vascular plant biodiversity in the Arctic and Antarctic. Pink represents Southern Ocean ice-free sea-surface relative temperature. Cooling in the Arctic was less severe during the Neogene than in Antarctica (Huber, 1998; Zachos et al., 2001). Plant symbols reflect general morphology of each group and are not to scale. Pl indicates Pliocene.
FIGURE 3
FIGURE 3
Relative role of microclimate and macroclimate as abiotic drivers for polar photoautotrophs. Areas with a relatively short growing season show from 0 to 100% plant cover (Paulsen and Körner, 2014), and macroclimate assumes a greater role as season length increases. For example with a season length of c. 150 days, the plant cover is mainly driven by macroclimate. As season length decreases, an increasing proportion of the total plant cover is driven by microclimate, such that at a season length of 70 days or less, plants exclusively rely on microclimatic effects, which are decoupled from macroclimate.
FIGURE 4
FIGURE 4
Key biotic drivers for transition between polar photoautotrophic groups. The relative influence of life cycle, stature and poikilohydry are shown by the extent of blue triangles (taller shading = greater influence). (i) Macroclimatic conditions largely drive the transition from trees to low stature shrubs via aerodynamic coupling of the tall stature of trees. Whilst trees are exposed to ambient air temperature, shrubs can more easily decouple from atmospheric conditions due to their low stature (Körner, 2012a). (ii) The transition from low stature shrubs to cryptogams is driven by via ontogeny barriers (Pannewitz et al., 2003; Green et al., 2011; Körner, 2011). (iii) Microclimate drives the presence/absence of most higher plants through exposure (radiative heat) and wind, whilst water mostly drives the transition from higher cryptogams (mosses) to highly poikilohydric unicellular plants (cyanobacteria, Potts, 1999). Phylogenetic age correlates well with tolerance of extreme conditions and relative phylogenetic age is shown by the pink shading (taller shading = older lineage).
FIGURE 5
FIGURE 5
Minimum favorable microclimate period for completion of life cycle by polar photoautotrophs. Vascular plants require a minimum of 45 days with temperatures that permit growth (Körner, 2011). In contrast cryptogamic bryophytes and lichens likely require only between 10 and 14 days to achieve net positive carbon balance (Pannewitz et al., 2003; Green et al., 2011) and for unicellular photoautotrophs this may be 1 h or less (Potts, 1994).
FIGURE 6
FIGURE 6
Microclimate dynamics for cryptogamic photoautotrophs. Biological soil crusts and endolithic colonization form extensive near-surface biological covers in polar regions that define the critical zone of biological activity and the dry limit for photoautotrophic colonization on Earth (Pointing and Belnap, 2012). They occur in regions where precipitation is insufficient to sustain higher plant life. Their source of moisture arises from the creation of a substrate-air thermal gradient that supports dew/rime formation (Büdel et al., 2008; Büdel and Colesie, 2014). During periods of high sun angle (daytime) thawing of permafrost and soil water releases water to the critical zone (A), when the sun is at a low angle (night) the thermal differential between substrate and air results in dew formation (B).

Similar articles

Cited by

References

    1. Abbott R., Brochmann C. (2003). History and evolution of the Arctic flora: in the footsteps of Eric Hulten. Mol. Ecol. 12, 299–313. 10.1046/j.1365-294X.2003.01731.x - DOI - PubMed
    1. Aleksandrova V. D. (1988). Vegetation of the Soviet Polar Deserts. Cambridge: Cambridge University Press.
    1. Bahl J., Lau M. C., Smith G. J., Vijaykrishna D., Cary S. C., Lacap D. C., et al. (2011). Ancient origins determine global biogeography of hot and cold desert cyanobacteria. Nat. Commun. 2, 163. 10.1038/ncomms1167 - DOI - PMC - PubMed
    1. Ballantyne A., Greenwood D., Sinninghe Damste J., Csank A., Eberle J., Rybczynski N. (2010). Arctic surface temperatures during the Pliocene indicated by multiple independent proxies. Geology 38, 603–606. 10.1130/G30815.1 - DOI
    1. Bay C. (1992). A phytogeographical study of the vascular plants of northern Greenland. Bioscience 36, 1–120.

LinkOut - more resources