. 2015 Sep 7:6:703.
doi: 10.3389/fpls.2015.00703. eCollection 2015.

Tree water status and growth of saplings and mature Norway spruce (Picea abies) at a dry distribution limit

Affiliations

Tree water status and growth of saplings and mature Norway spruce (Picea abies) at a dry distribution limit

Walter Oberhuber et al. Front Plant Sci. .

Abstract

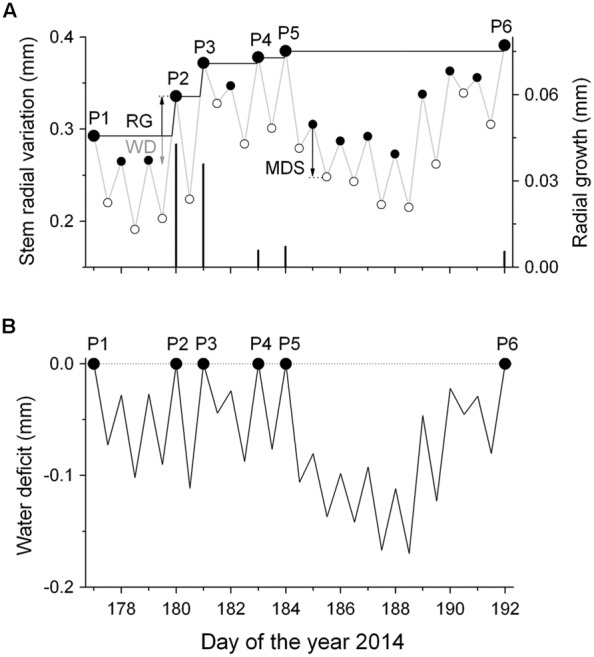
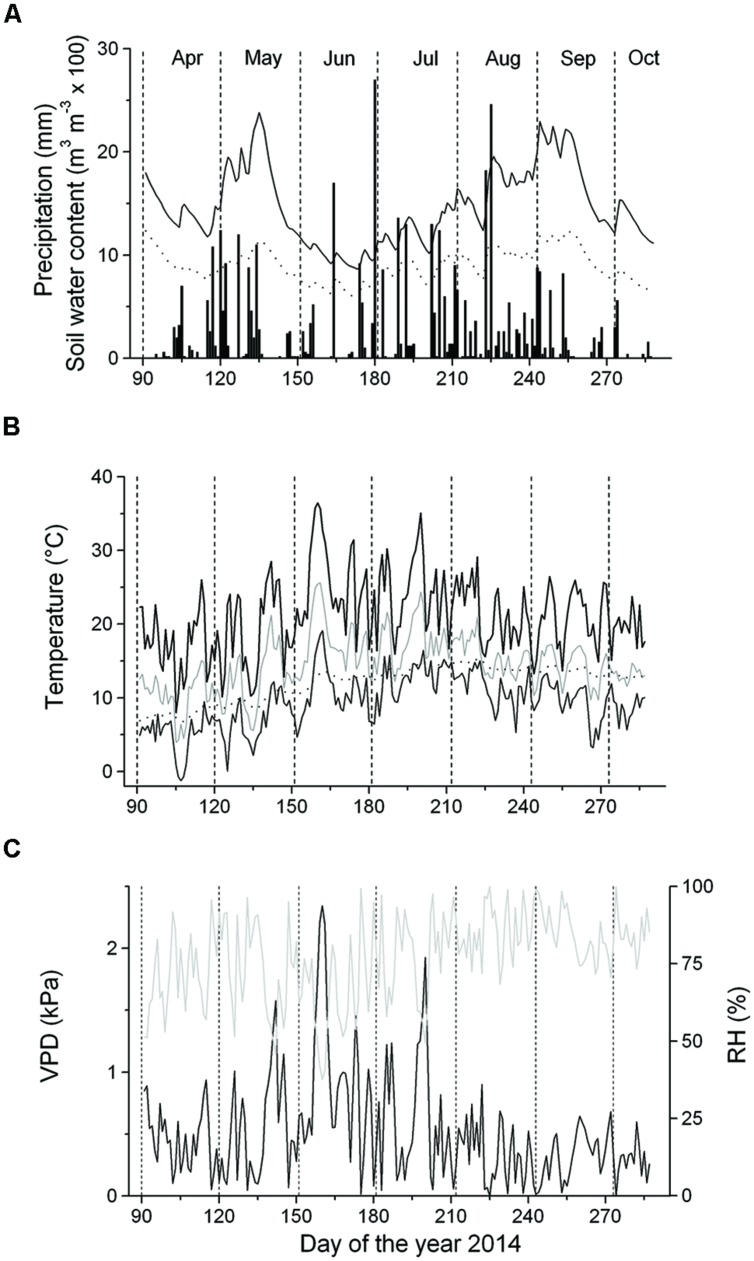
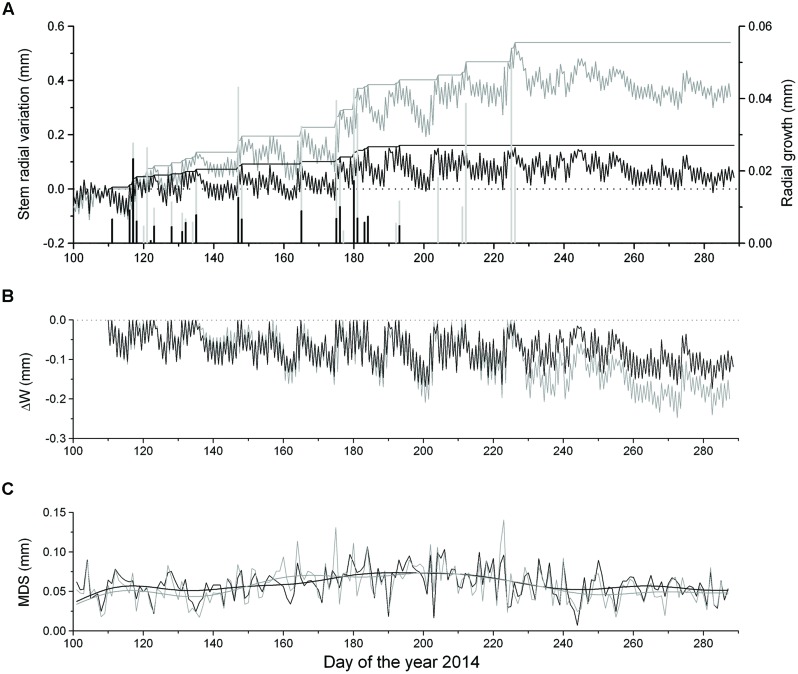
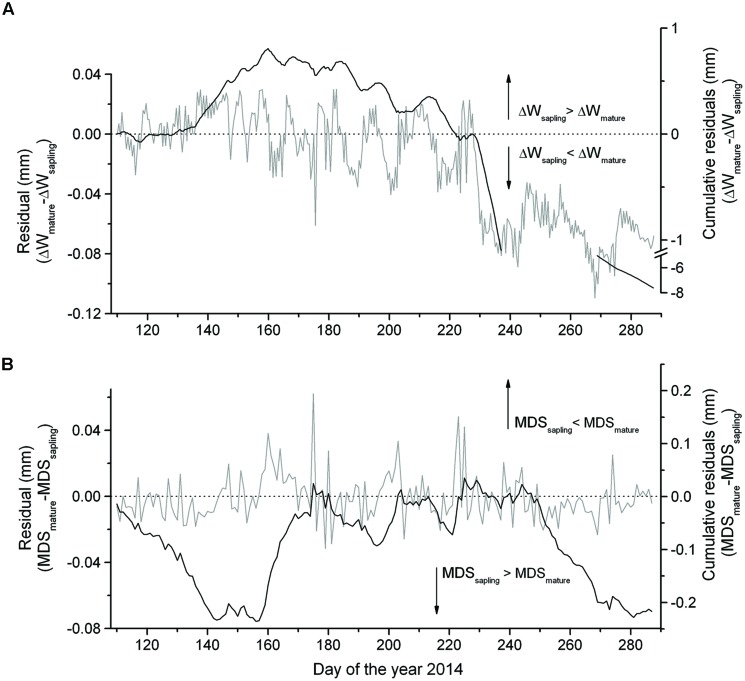
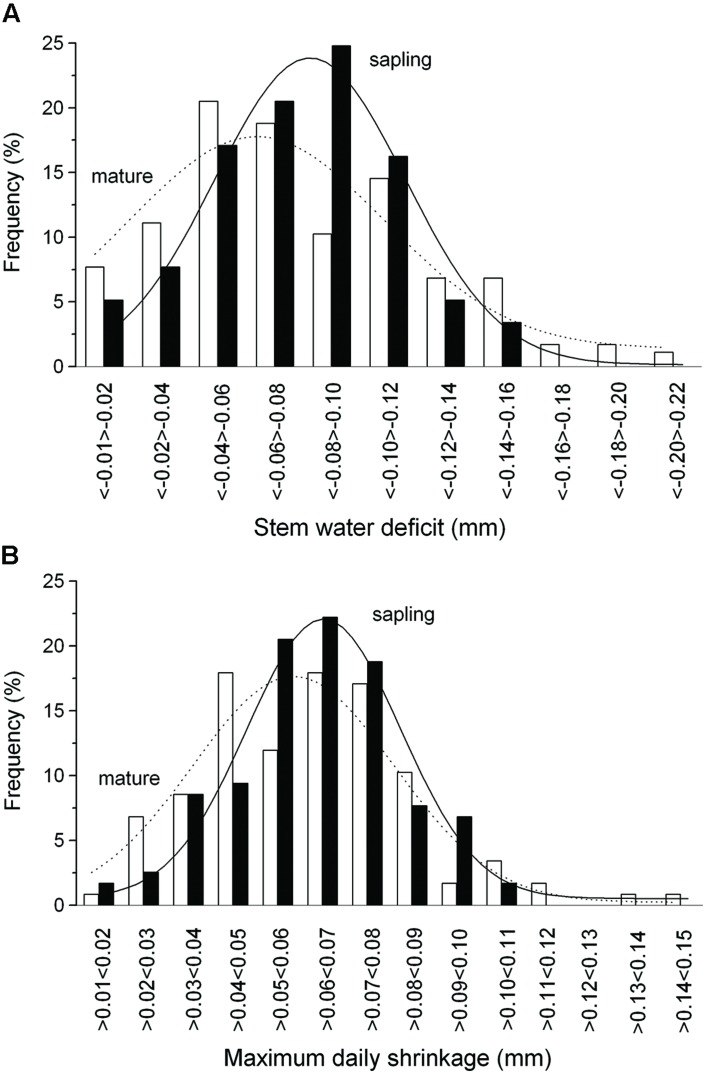
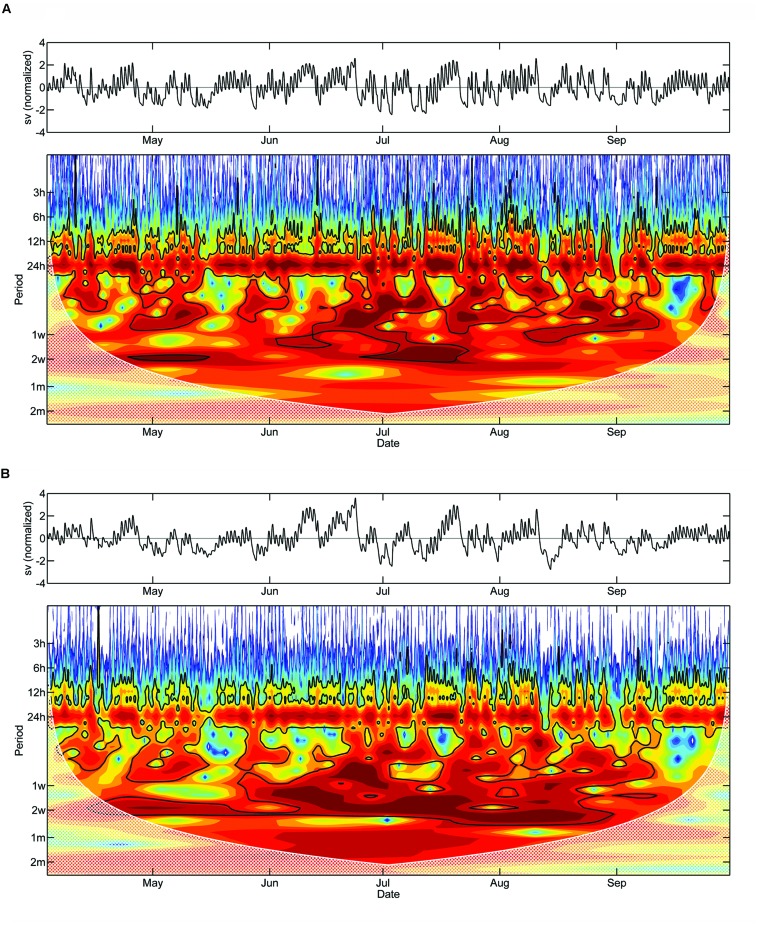
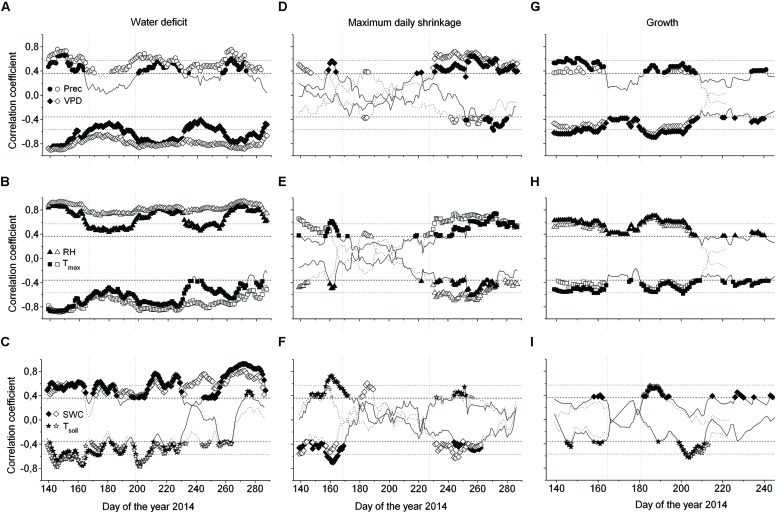
We evaluated the size effect on stem water status and growth in Norway spruce (Picea abies (L.) Karst.) occurring at the edge of its natural range in a dry inner Alpine environment (750 m asl, Tyrol, Austria). Intra-annual dynamics of stem water deficit (ΔW), maximum daily shrinkage (MDS), and radial growth (RG) were compared among saplings (stem diameter/height: 2.2 cm/93 cm; n = 7) and mature adult trees (25 cm/12.7 m; n = 6) during 2014. ΔW, MDS, and RG were extracted from stem diameter variations, which were continuously recorded by automatic dendrometers and the influence of environmental drivers was evaluated by applying moving correlation analysis (MCA). Additionally, we used Morlet wavelet analysis to assess the differences in cyclic radial stem variations between saplings and mature trees. Results indicate that saplings and mature trees were experiencing water limitation throughout the growing season. However, saplings exhibited a more strained stem water status and higher sensitivity to environmental conditions than mature trees. Hence, the significantly lower radial increments in saplings (0.16 ± 0.03 mm) compared to mature trees (0.54 ± 0.14 mm) is related to more constrained water status in the former, affecting the rate and duration of RG. The wavelet analysis consistently revealed more distinct diurnal stem variations in saplings compared to mature trees. Intra-annual RG was most closely related to climate variables that influence transpiration, i.e., vapor pressure deficit, relative air humidity, and air temperature. MCA, however, showed pronounced instability of climate-growth relationships, which masked missing temporal or significant correlations when the entire study period (April-October) was considered. We conclude that an increase in evaporative demand will impair regeneration and long-term stability of drought-prone inner Alpine Norway spruce forests.

Keywords: Picea abies; dendrometer; dry inner Alpine valley; maximum daily shrinkage; radial growth; stem water deficit; wavelet analysis.


Figures

FIGURE 1
FIGURE 1
Scheme of detrending dendrometer records (DMR) for growth. (A) Time series of daily maximum and minimum DMR (gray line) and fitted ‘growth line’ (black line) (RG, radial growth; MDS, maximum daily shrinkage; WD, water deficit). The symbols P1–P6 indicate successively increasing daily maximum DMR, whereby the difference among successive values is regarded as RG (black bars). MDS is the diurnal amplitude between the morning maximum and the daily minimum (filled and open circles, respectively). (B) The extracted daily stem water deficits (ΔW) as the difference between the ‘growth line’ and the daily maximum and minimum DMR (small closed and open circles, respectively). Missing stem radius recovery indicates a continuous ΔW.
FIGURE 2
FIGURE 2
Climate variables and soil water content (SWC) recorded during the growing season 2014. (A) Daily precipitation sum (bars) and SWC at the 5–10 cm and 10–15 cm soil depth layers (solid and dashed line, respectively); (B) Daily mean (gray line), minimum (thin solid line) and maximum air temperature (thick solid line) and mean daily soil temperature (dotted line); (C) Vapor pressure deficit (VPD, solid line) and relative air humidity (RH, gray line).
FIGURE 3
FIGURE 3
(A) Time series of maximum and minimum daily DMR, growth line, and extracted RG (bars) of saplings (solid lines and bars) and mature trees (gray lines and bars), (B) ΔW of saplings (solid line) and mature trees (gray line) and (C) maximum daily shrinkage (MDS) of saplings (solid line) and mature trees (gray line). Data were smoothed based on a fast Fourier transform low-pass filter, whereby the number of points was set to 20.
FIGURE 4
FIGURE 4
Difference in the (A) ΔW and (B) MDS between mature trees and saplings and cumulative residuals from mid-April through early October 2014.
FIGURE 5
FIGURE 5
Frequency distribution of the ΔW (A) and MDS (B) in mature trees (open bars) and saplings (filled bars). Solid and dashed lines indicate Gaussian-fitting for saplings and mature trees, respectively.
FIGURE 6
FIGURE 6
Detrended stem variations and Morlet wavelet spectra of half-hourly DMR of saplings (A) and mature adult trees (B). The black line outlines designate the 5% significance level. The ‘cone of influence,’ where edge effects become important and the results should be ignored, are shown in a lighter shade. Red and blue colors indicate high and low wavelet power spectrum values, respectively (sv, stem variation).
FIGURE 7
FIGURE 7
Moving correlations (window 30 days) between the water deficit (ΔW) (A–C), MDS (D–F) and growth (G–I), and environmental variables of saplings (open symbols) and mature Picea abies (filled symbols). Spearman rank-correlations (ρ) were calculated for relationships between (i) precipitation and ΔW, MDS, and growth, and (ii) all environmental variables and growth. For all other relationships the Pearson product-moment coefficients (r) are shown (Prec, daily precipitation sum; VPD, vapor pressure deficit; RH, relative air humidity; Tmax, daily maximum air temperature; SWC, soil water content; Tsoil, mean soil temperature). A lag of 1 day was considered in the relationship between ΔW, MDS, and growth, and SWC and Tsoil. Horizontal dotted and dashed lines indicate P = 0.001 and P = 0.05 significance levels, respectively.

Similar articles

Cited by

References

    1. Anderegg W. R. L., Anderegg L. D. L. (2013). Hydraulic and carbohydrate changes in experimental drought-induced mortality of saplings in two conifer species. Tree Physiol. 33 252–260. 10.1093/treephys/tpt016 - DOI - PubMed
    1. Anfodillo T., Rento S., Carraro V., Furlanetto L., Urbinati C., Carrer M. (1998). Tree water relations and climatic variations at the alpine timberline: seasonal changes of sap flux and xylem water potential in Larix decidua Miller, Picea abies (L.) Karst. and Pinus cembra L. Ann. For. Sci. 55 159–172.
    1. Betsch P., Bonal D., Breda N., Montpied P., Peiffer M., Tuzet A., et al. (2011). Drought effects on water relations in beech: the contribution of exchangeable water reservoirs. Agric. For. Meteorol. 151 531–543. 10.1016/j.agrformet.2010.12.008 - DOI
    1. Buckley T. N. (2005). The control of stomata by water balance. New Phytol. 168 275–292. 10.1111/j.1469-8137.2005.01543.x - DOI - PubMed
    1. Čermak J., Kučera J., Bauerle W. L., Phillips N., Hinckley T. M. (2007). Tree water storage and its diurnal dynamics related to sap flow and changes in stem volume in old-growth Douglas-fir trees. Tree Physiol. 27 181–198. 10.1093/treephys/27.2.181 - DOI - PubMed