. 2015 Sep 17:6:714.
doi: 10.3389/fpls.2015.00714. eCollection 2015.

Comparative analysis of endogenous hormones level in two soybean (Glycine max L.) lines differing in waterlogging tolerance

Affiliations

Comparative analysis of endogenous hormones level in two soybean (Glycine max L.) lines differing in waterlogging tolerance

Yoon-Ha Kim et al. Front Plant Sci. .

Abstract

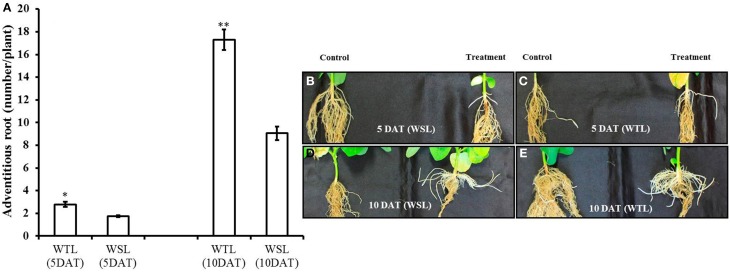
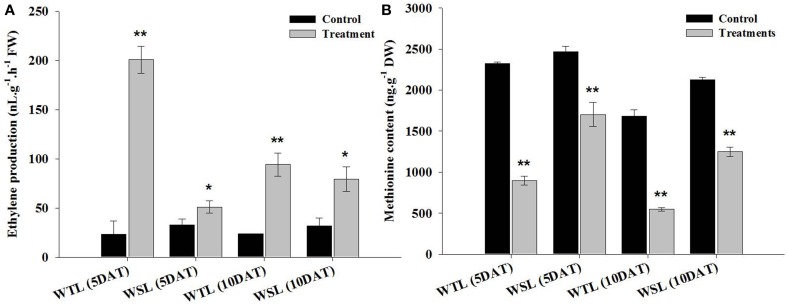
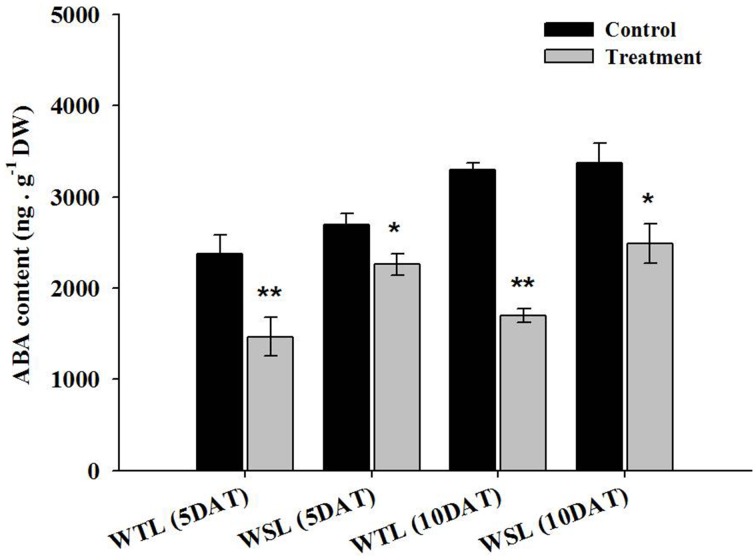
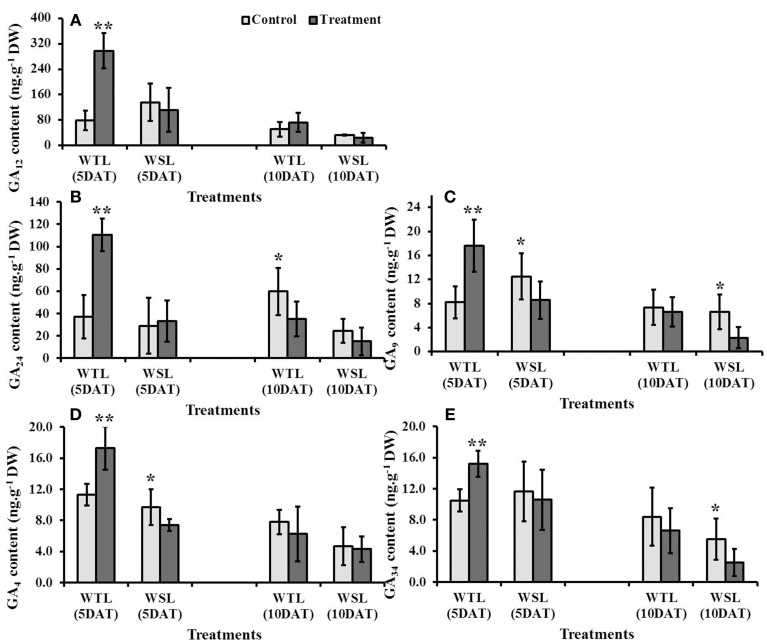
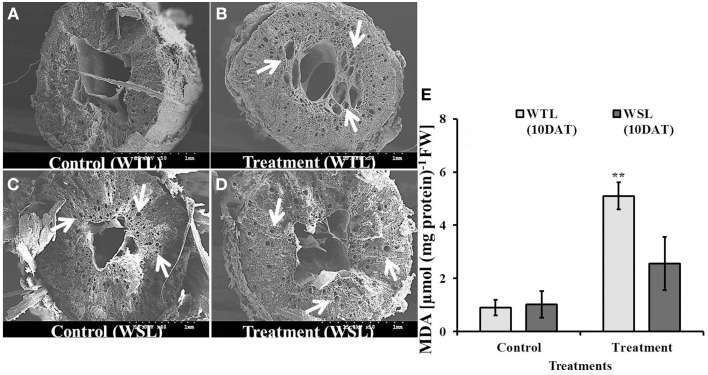
Waterlogged condition due to flooding is one of the major abiotic stresses that drastically affect the soybean growth and yield around the world. As a result, many breeders have focused on the development of waterlogging tolerance in soybean varieties, and thus, several tolerant varieties were developed. However, the physiological mechanism of waterlogging tolerance is not yet fully understood. We particularly studied the endogenous hormones regulation during waterlogging in two contrasting soybean genotypes. According to our results, adventitious roots were better developed in the waterlogging tolerant line (WTL) than in the waterlogging susceptible line (WSL). Endogenous hormones also showed significant differences between WTL and WSL. The ethylene production ratio was higher in WTL than in WSL, and methionine was higher in WTL than in WSL. Other endogenous abscisic acid (ABA) contents were lower in WTL than in WSL. Conversely, gibberellic acid (GA) showed a tendency to be high in WTL, especially the levels of the bioactive GA4. The ratio of total GA and ABA was significantly higher in WTL than in WSL. Anatomical study of the root revealed that aerenchyma cells in the stele were better developed in WTL than in WSL.

Keywords: abscisic acid; adventitious root; aerenchyma cell; ethylene; gibberellin.


Figures

Figure 1
Figure 1
Number of adventitious root and images of adventitious roots at 5 and 10 days after waterlogging stress. In the figure, (A) indicates the number of adventitious roots and WTL indicates the waterlogging tolerant line (PI408105A), and WSL indicates the waterlogging susceptible line (S99-2281). (B–E) Indicate the images of adventitious roots and in each picture, the control plant is on the left, and waterlogging treated plant on the right. In (A), star marks indicate a significant difference between control and treatment at P < 0.05 or P < 0.01. Data show average ± standard error (n = 20) and was collected over three replications.
Figure 2
Figure 2
Ethylene production (A) and amino acid content (B) in two soybean lines (WTL and WSL) after 5 and 10 days of waterlogging treatment. In the figure, WTL denotes the waterlogging tolerant line (PI408105A) and WSL denotes the waterlogging susceptible line (S99-2281). Data is the average ± standard error (n = 3). The * and ** shows the values are significantly different using P < 0.05 and P < 0.01 respectively.
Figure 3
Figure 3
Endogenous ABA content in the two soybean lines after waterlogging treatment. In the figures, WTL denotes the waterlogging tolerant line (PI408105A) and WSL indicates the waterlogging susceptible line (S99-2281). In the figure, star marks indicate a significant difference between control and treatment at P < 0.05 or P < 0.01. Data is the average ± standard error (n = 3).
Figure 4
Figure 4
Proline contents in the two soybean lines after waterlogging treatment. In the figures, WTL denotes the waterlogging tolerant line (PI408105A) and WSL indicates the waterlogging susceptible line (S99-2281). In the figure, star marks indicate a significant difference between control and treatment at P < 0.05 or P < 0.01. Data is the average ± standard error (n = 3).
Figure 5
Figure 5
Endogenous gibberellic acid (GA) contents in two soybean lines after waterlogging treatment. The regulation of different gibberellic acids is shown as (A) G12, (B) G24, (C) GA9, (D) GA4 and (E) GA34. In the figures, WTL indicates the waterlogging tolerant line (PI408105A) and WSL revealed waterlogging susceptible line (S99-2281). In the figure, star marks indicated significantly difference between control and treatment at P < 0.05 or P < 0.01. Data is the average ± standard error (n = 3).
Figure 6
Figure 6
Endogenous jasmonic acid (JA) (A) and salicylic acid (SA) (B) contents in two soybean lines after waterlogging treatment. In the figures, WTL indicates the waterlogging tolerant line (PI408105A) and WSL denotes the waterlogging susceptible line (S99-2281). In the figure, star marks indicate a significant difference between control and treatment at P < 0.05 or P < 0.01. Data is the average ± standard error (n = 3).
Figure 7
Figure 7
The images of root section (A–D) and MDA (E) in root after 10 days waterlogging treatments. In the figure, WTL indicates the waterlogging tolerant line (PI408105A) and WSL indicates the waterlogging susceptible line (S99-2281). The arrows in (B–D) indicate aerenchyma cells in the root. (E) Shows lipid peroxidation (MDA) in the root and star marks indicate a significantly difference between control and treatment at P < 0.05 or P < 0.01. Data is the average ± standard error (n = 3).
Figure 8
Figure 8
The scheme of the waterlogging tolerance mechanism under plant hormones level. In the figure, solid lines indicate induction or increase and dashed line arrows indicate putative response. The line with bars shows suppressed or inhibited.

References

    1. Ahmed F., Rafii M. Y., Ismail M. R., Juraimi A. S., Rahim H. A., Asfaliza R., et al. . (2013). Waterlogging tolerance of crops: breeding, mechanism of tolerance, molecular approaches, and future prospects. Biomed Res. Int. 2013:963525. 10.1155/2013/963525 - DOI - PMC - PubMed
    1. Alam I., Lee D. G., Kim K. H., Park C. H., Sharmin S. A., Lee H., et al. . (2010). Proteome analysis of soybean roots under waterlogging stress at an early vegetative stage. J. Biosci. 35, 49–62. 10.1007/s12038-010-0007-5 - DOI - PubMed
    1. Arc E., Sechet J., Corbineau F., Rajjou L., Marion-Poll A. (2013). ABA crosstalk with ethylene and nitric oxide in seed dormancy and germination. Front. Plant Sci. 4:63. 10.3389/fpls.2013.00063 - DOI - PMC - PubMed
    1. Bacanamwo M., Purcell L. C. (1999). Soybean root morphological and anatomical traits associated with acclimation to flooding. Crop Sci. 39, 143–149. 10.2135/cropsci1999.0011183X003900010023x - DOI
    1. Bailey-Serres J., Fukao T., Gibbs D. J., Holdsworth M. J., Lee S. C., Licausi F., et al. . (2012). Making sense of low oxygen sensing. Trends Plant Sci. 17, 129–138. 10.1016/j.tplants.2011.12.004 - DOI - PubMed