. 2015 Sep 10:6:720.
doi: 10.3389/fpls.2015.00720. eCollection 2015.

Genetic variation of temperature-regulated curd induction in cauliflower: elucidation of floral transition by genome-wide association mapping and gene expression analysis

Affiliations

Genetic variation of temperature-regulated curd induction in cauliflower: elucidation of floral transition by genome-wide association mapping and gene expression analysis

Claudia Matschegewski et al. Front Plant Sci. .

Abstract

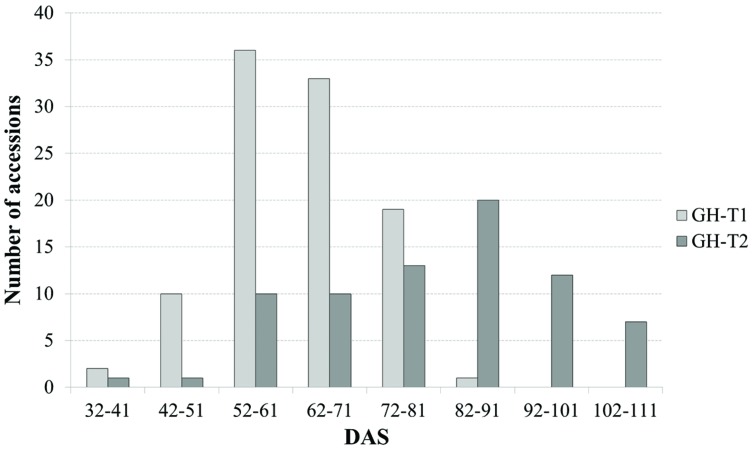
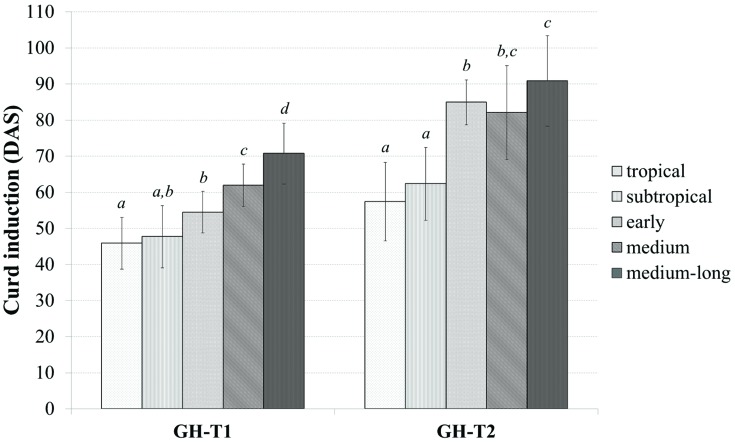
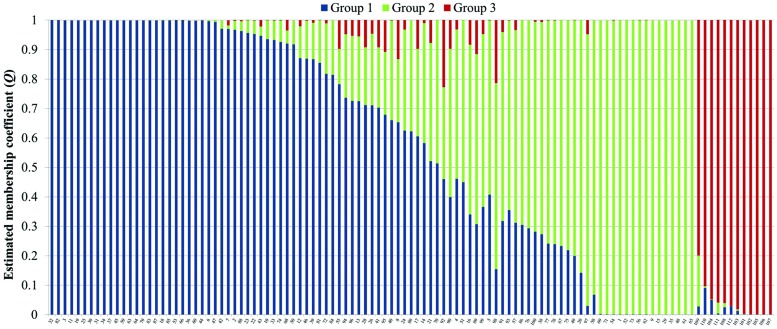
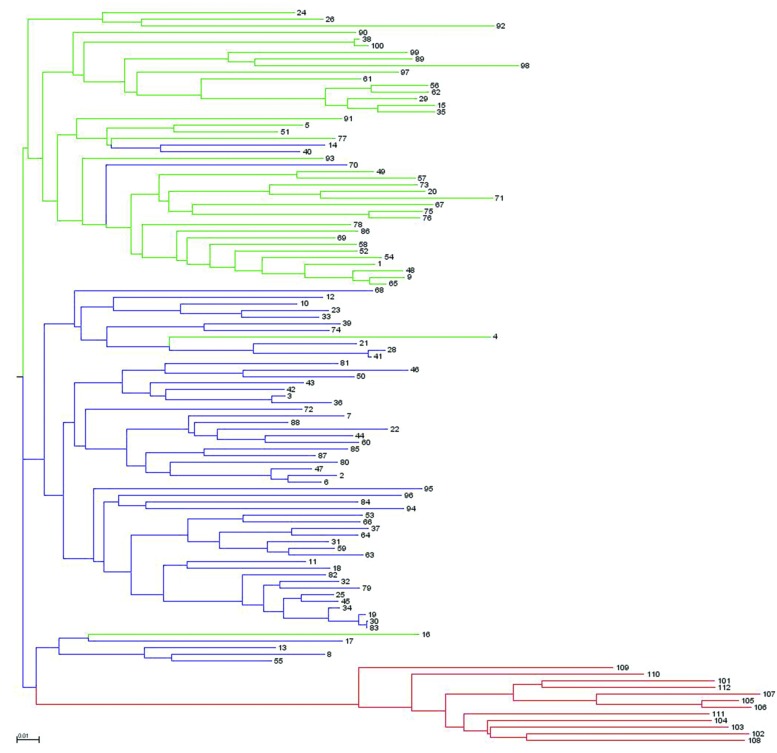
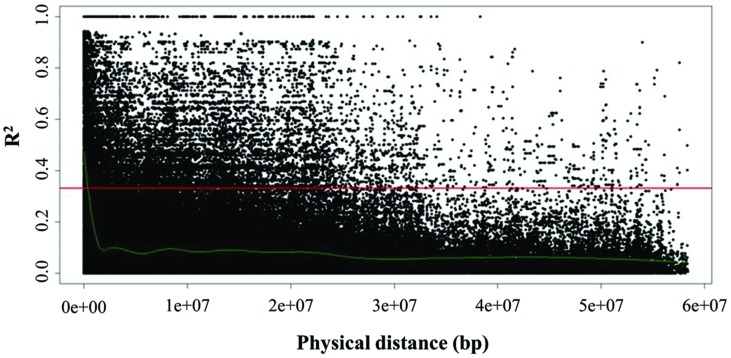
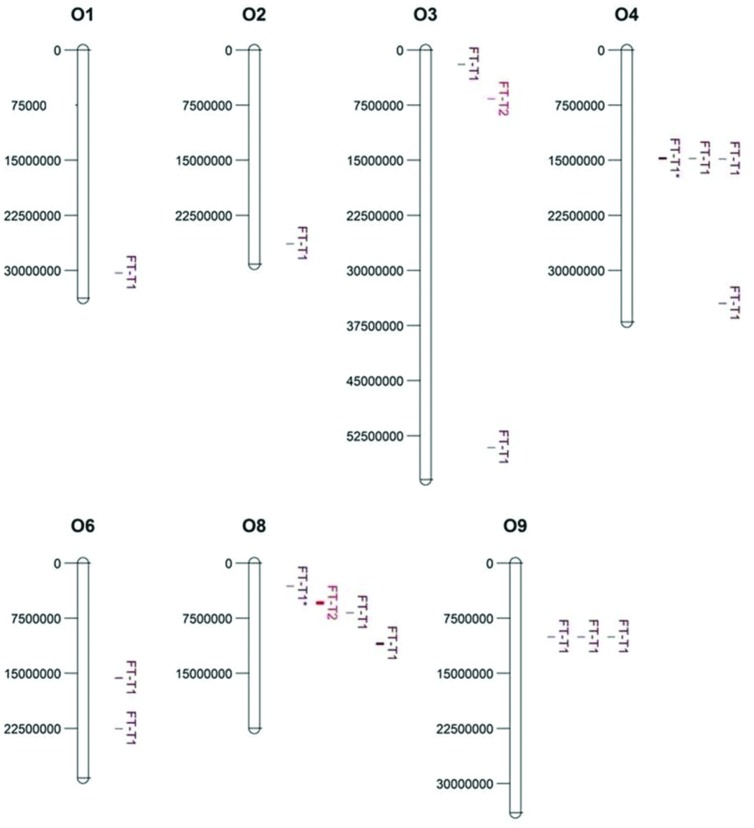
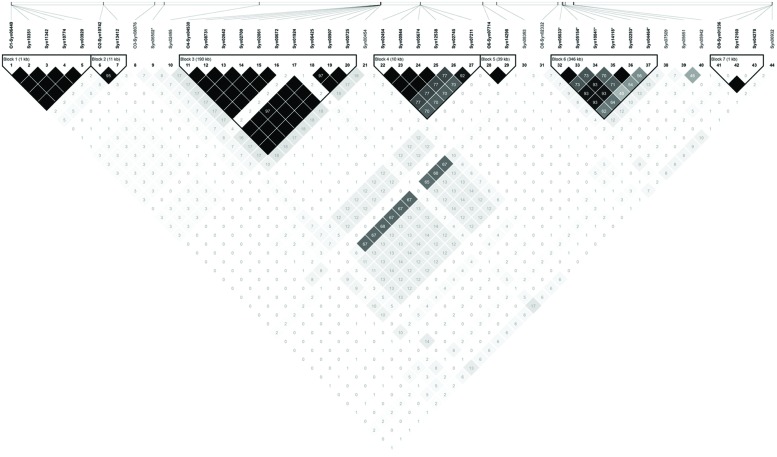
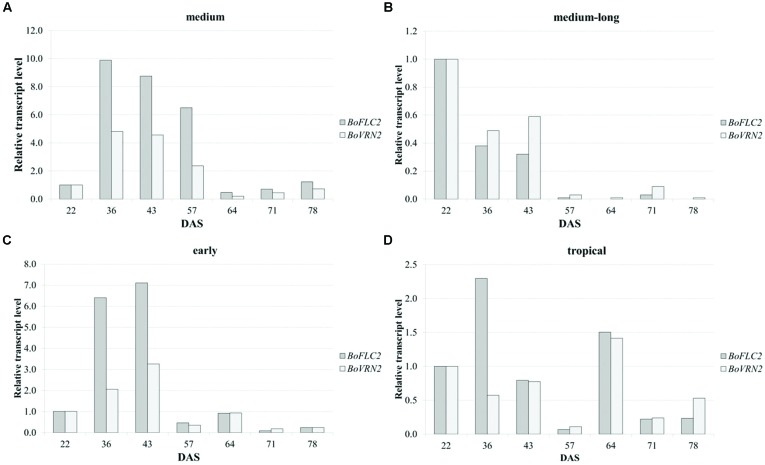
Cauliflower (Brassica oleracea var. botrytis) is a vernalization-responsive crop. High ambient temperatures delay harvest time. The elucidation of the genetic regulation of floral transition is highly interesting for a precise harvest scheduling and to ensure stable market supply. This study aims at genetic dissection of temperature-dependent curd induction in cauliflower by genome-wide association studies and gene expression analysis. To assess temperature-dependent curd induction, two greenhouse trials under distinct temperature regimes were conducted on a diversity panel consisting of 111 cauliflower commercial parent lines, genotyped with 14,385 SNPs. Broad phenotypic variation and high heritability (0.93) were observed for temperature-related curd induction within the cauliflower population. GWA mapping identified a total of 18 QTL localized on chromosomes O1, O2, O3, O4, O6, O8, and O9 for curding time under two distinct temperature regimes. Among those, several QTL are localized within regions of promising candidate flowering genes. Inferring population structure and genetic relatedness among the diversity set assigned three main genetic clusters. Linkage disequilibrium (LD) patterns estimated global LD extent of r(2) = 0.06 and a maximum physical distance of 400 kb for genetic linkage. Transcriptional profiling of flowering genes FLOWERING LOCUS C (BoFLC) and VERNALIZATION 2 (BoVRN2) was performed, showing increased expression levels of BoVRN2 in genotypes with faster curding. However, functional relevance of BoVRN2 and BoFLC2 could not consistently be supported, which probably suggests to act facultative and/or might evidence for BoVRN2/BoFLC-independent mechanisms in temperature-regulated floral transition in cauliflower. Genetic insights in temperature-regulated curd induction can underpin genetically informed phenology models and benefit molecular breeding strategies toward the development of thermo-tolerant cultivars.

Keywords: cauliflower; curd induction; genome-wide association study (GWAS); linkage disequilibrium (LD); quantitative trait loci (QTL); single nucleotide polymorphism (SNP); transcriptional profiling; vernalization.


Figures

FIGURE 1
FIGURE 1
Frequency of days after sowing (DAS) to visible curd induction among the cauliflower diversity set under semi-controlled temperature conditions (GH-T1) and under high ambient temperatures of 22.5°C (GH-T2).
FIGURE 2
FIGURE 2
Phenotypic variation of curd induction (measured in DAS) among the cauliflower diversity set according to the classification into distinct groups consisting of early, medium, medium-long, subtropical and tropical accessions under a natural temperature regime (GH-T1) and high ambient temperatures of 22.5°C (GH-T2; mean ± SD, P < 0.05, Kruskal–Wallis test; similar letters indicate no significant statistical differences).
FIGURE 3
FIGURE 3
Bayesian analysis of population structure in the cauliflower diversity panel assigning the accessions to three subpopulations. Each genotype is represented by a vertical bar, which is partitioned into K colored segments that represent the individual’s estimated membership coefficient (Q) to the K clusters (STRUCTURE 2.3.4).
FIGURE 4
FIGURE 4
Neighbor-joining dendrogram showing genetic relatedness among the 111 cauliflower accessions of the diversity panel based on 4,758 SNP markers. Accessions are color-coded according to the populations’ substructure assignment to cluster G1, G2, and G3 based on STRUTURE results (see Figure 3).
FIGURE 5
FIGURE 5
Linkage disequilibrium (LD) represented as r2 of all intrachromosomal marker pairs plotted against physical distance among all linkage groups (O1–O9). The horizontal line (red) marks critical r2 (r2 = 0.33) as threshold beyond which LD is assumed to result from genetic linkage. The intersection point with the non-linear regression LOESS curve (green), which determines LD decay, marks the physical distance as threshold for the maximum distance between genetically linked markers.
FIGURE 6
FIGURE 6
Physical map and chromosomal position of significant QTL (P < 0.01) associated with temperature-related curd induction in cauliflower under natural temperature regime (GH-T1) and under high ambient temperatures of 22.5°C (GH-T2), denoted as FT-T1 (dark red) and FT-T2 (red), respectively. Significant QTL are located on chromosomes O1, O2, O3, O4, O6, O8, and O9 (left: physical position in bp). Two significant FT-T1 QTL on O4 and O8, marked with an asterisk (FT-T1), were genetically linked (r2 = 0.7).
FIGURE 7
FIGURE 7
Linkage disequilibrium plot showing LD patterns among significant SNPs for temperature-related curd induction. The LD between the SNPs is measured as r2 and shown (×100) in the square at the intersection of the diagonals from each SNP. r2 = 0 is shown in white, 0 < r2 < 1 is shown in gray and r2 = 1 is shown in black. The analysis track at the top shows the SNPs according to their chromosomal location; while separating linkage groups by O1-, O2-, O3-, O4-, O6-, O8-, and O9- prefix, respectively. Seven haplotype blocks (outlined in bold black line) indicate markers that are in high LD.
FIGURE 8
FIGURE 8
Time-dependent relative changes in transcript levels of BoFLC2 and BoVRN2 during curd induction in medium (A), medium-long (B), early (C) and cauliflower accession from the temperate zone and the tropics (D). Values represent mean relative changes in gene expression normalized to the control time point (22 DAS).

Similar articles

Cited by

References

    1. Abrol D. P. (2012). Pollination Biology: Biodiversity Conservation and Agricultural Production. New York, NY: Springer.
    1. Alexandre C. M., Henning L. (2008). FLC or not FLC: The other side of vernalization. J. Exp. Bot. 59 1127–1135. 10.1093/jxb/ern070 - DOI - PubMed
    1. Amasino R. M. (2005). Vernalization and flowering time. Curr. Opin. Biotechnol. 16 154–158. 10.1016/j.copbio.2005.02.004 - DOI - PubMed
    1. Atwell S., Huang Y. S., Vilhjálmsson B. J., Willems G., Horton M., Li Y., et al. (2010). Genome-wide association study of 107 phenotypes in Arabidopsis thaliana inbred lines. Nature 465 627–631. 10.1038/nature08800 - DOI - PMC - PubMed
    1. Axelsson T., Shavorskaya O., Lagercrantz U. (2001). Multiple flowering time QTLs within several Brassica species could be the result of duplicated copies of one ancestral gene. Genome 44 856–864. 10.1139/g01-082 - DOI - PubMed