. 2015 Sep 23:6:728.
doi: 10.3389/fpls.2015.00728. eCollection 2015.

Metabolite profiling and transcript analysis reveal specificities in the response of a berry derived cell culture to abiotic stresses

Affiliations

Metabolite profiling and transcript analysis reveal specificities in the response of a berry derived cell culture to abiotic stresses

Biruk Ayenew et al. Front Plant Sci. .

Abstract

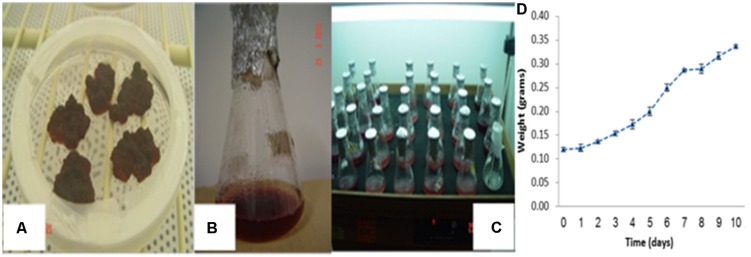
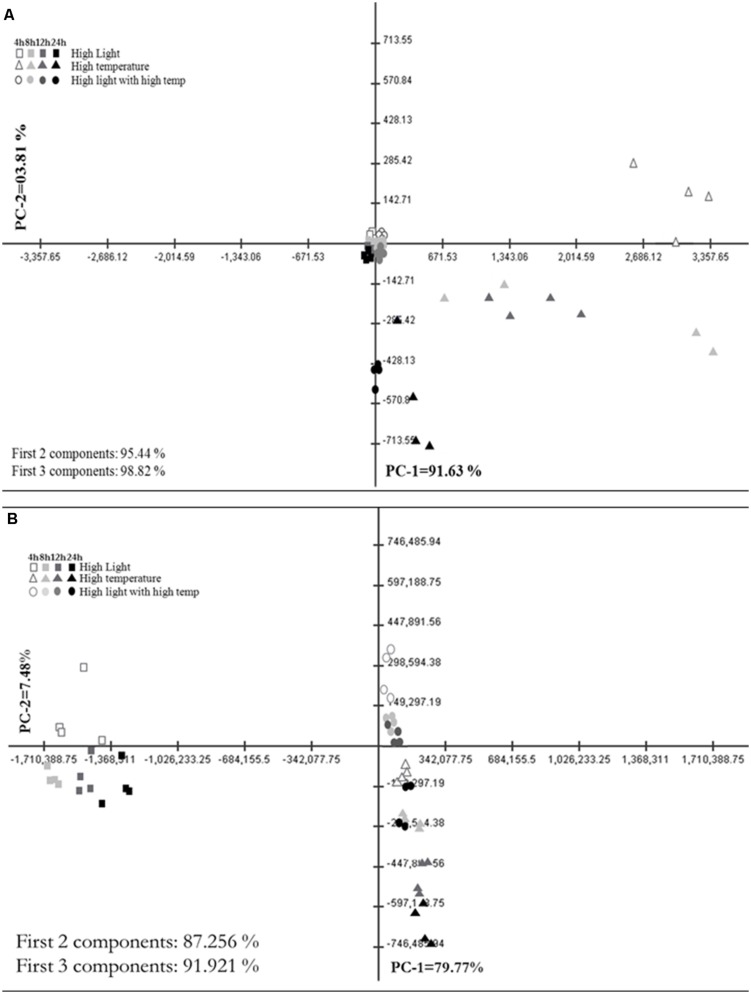
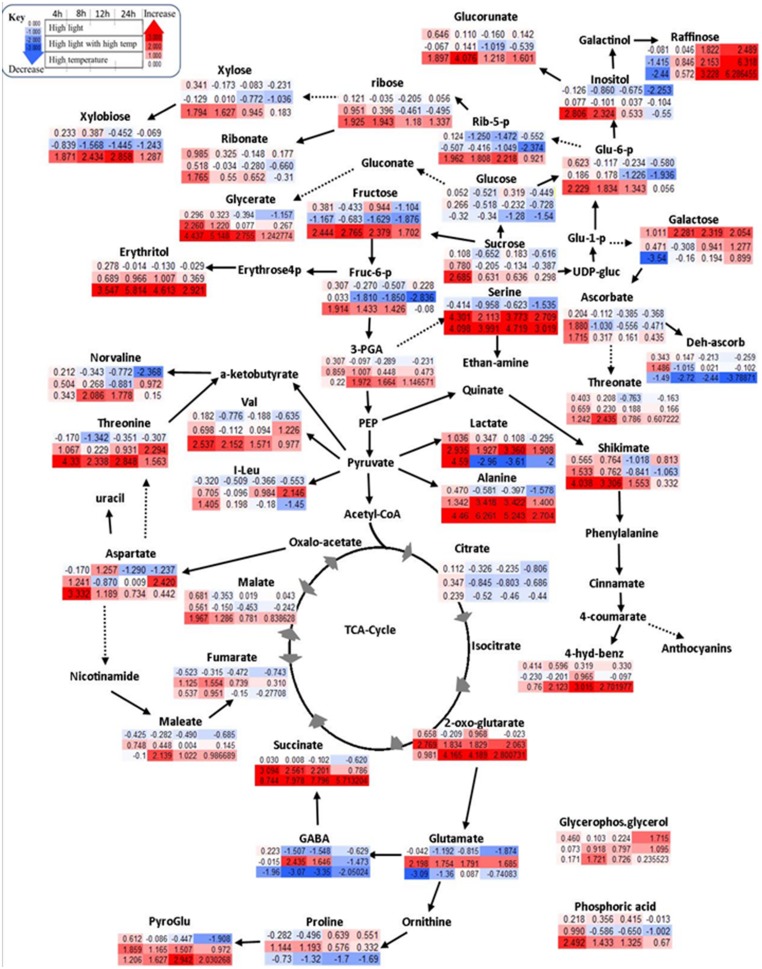
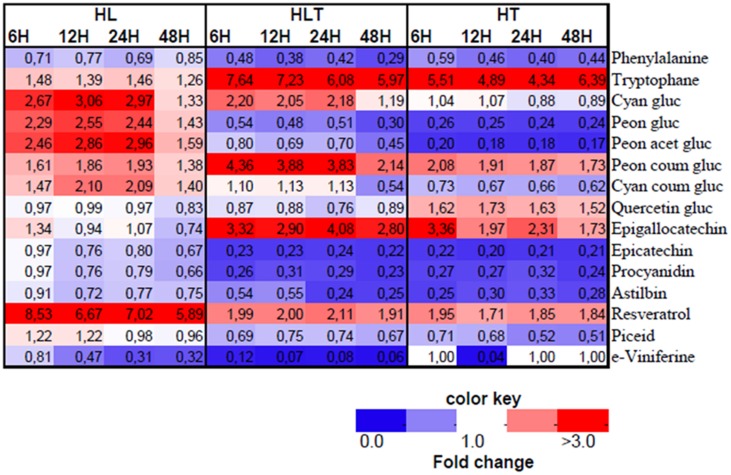
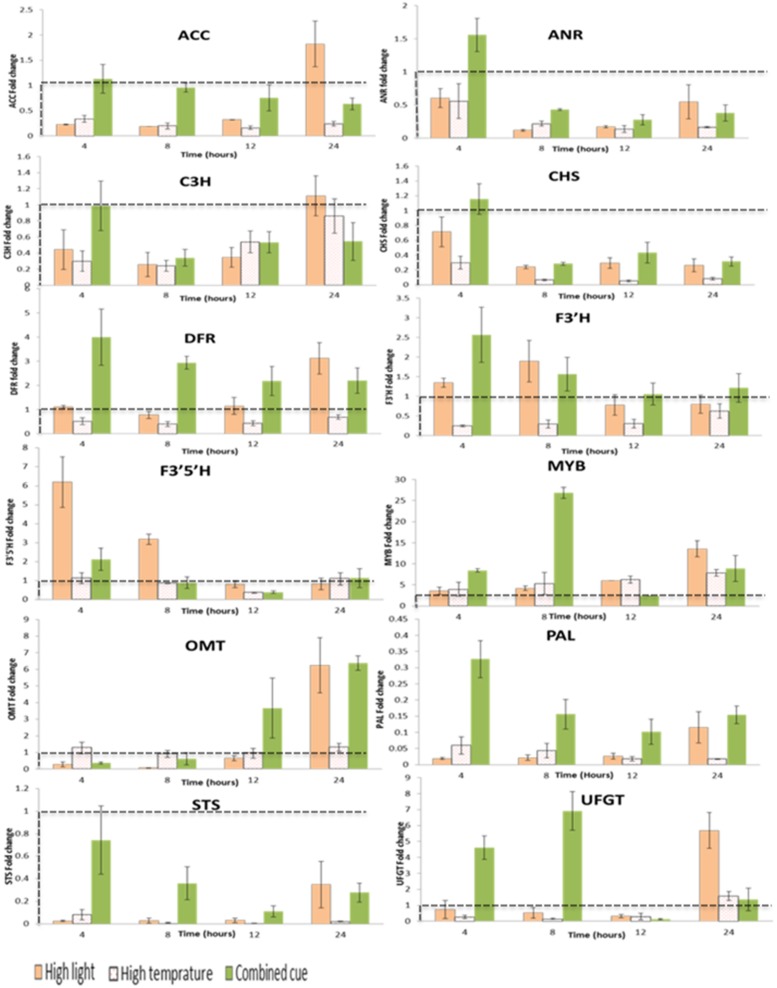
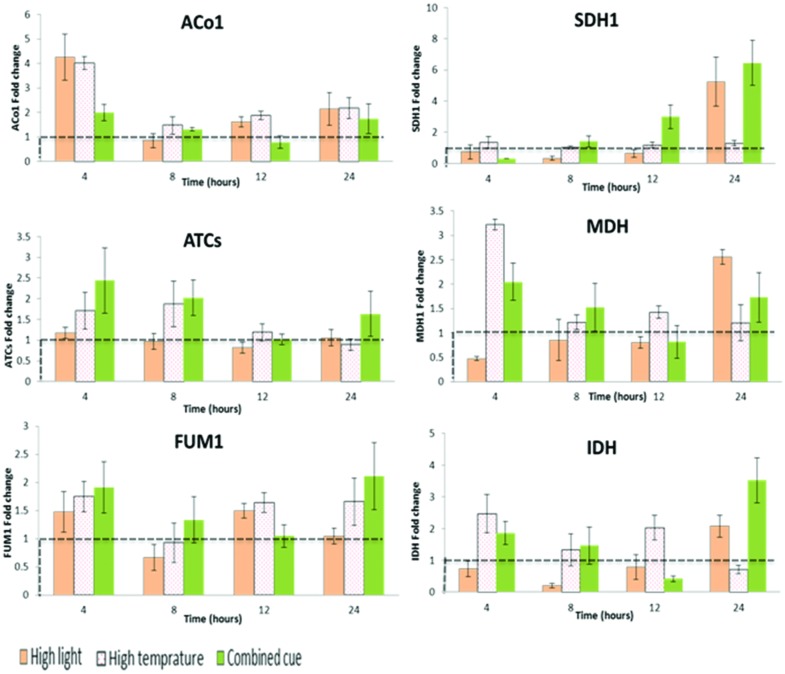
As climate changes, there is a need to understand the expected effects on viticulture. In nature, stresses exist in a combined manner, hampering the elucidation of the effect of individual cues on grape berry metabolism. Cell suspension culture originated from pea-size Gamy Red grape berry was used to harness metabolic response to high light (HL; 2500 μmol m(-2)s(-1)), high temperature (HT; 40°C) and their combination in comparison to 25°C and 100 μmol m(-2)s(-1) under controlled condition. When LC-MS and GC-MS based metabolite profiling was implemented and integrated with targeted RT-qPCR transcript analysis specific responses were observed to the different cues. HL enhanced polyphenol metabolism while HT and its combination with HL induced amino acid and organic acid metabolism with additional effect on polyphenols. The trend of increment in TCA cycle genes like ATCs, ACo1, and IDH in the combined treatment might support the observed increment in organic acids, GABA shunt, and their derivatives. The apparent phenylalanine reduction with polyphenol increment under HL suggests enhanced fueling of the precursor toward the downstream phenylpropanoid pathway. In the polyphenol metabolism, a differential pattern of expression of flavonoid 3',5' hydroxylase and flavonoid 3' hydroxylase was observed under high light (HL) and combined cues which were accompanied by characteristic metabolite profiles. HT decreased glycosylated cyanidin and peonidin forms while the combined cues increased acetylated and coumarylated peonidin forms. Transcription factors regulating anthocyanin metabolism and their methylation, MYB, OMT, UFGT, and DFR, were expressed differentially among the treatments, overall in agreement with the metabolite profiles. Taken together these data provide insights into the coordination of central and secondary metabolism in relation to multiple abiotic stresses.

Keywords: GC–MS; LC–MS; abiotic stress; cell culture; grape; metabolite; transcript.


Figures

FIGURE 1
FIGURE 1
Dark skin derived callus cultures and its subsequent cell suspension cultures for in vitro proliferation. (A) Initiated callus cultures, (B) development of suspension culture, (C) cell suspension cultures and their proliferation using 250 mL Erlenmeyer flasks and (D) cell growth curve across culture period.
FIGURE 2
FIGURE 2
Metabolic shifts in specialized metabolites under high light (HL), high temperature (HT), and combined stress (HLT) across time. Principal Component Analysis (PCA) plot of PC-1 vs. PC-2 of metabolite profile obtained from (A) GC–MS and (B) LC–MS–QTOF stressed grape suspension cultures after 4, 8, 12, and 24 h of exposure. Percentage of the variance by each principal component is indicated on respective axis. Each points represent biological samples (n = 4)
FIGURE 3
FIGURE 3
Schematic representations of primary metabolites in fold change from respective time point control in Log2 values. Different colors represent levels of metabolite fold change where red is increasing and blue is decreasing. Mean values are presented (n = 4). Each row (upper row = HL treatment, middle row = combined HL with high temperature, lower row = HT) shows fold change from respective time point control while each column is different time points after treatment application (4, 8, 12, and 24 h).
FIGURE 4
FIGURE 4
Heatmap of annotated LC–MS based metabolites in fold change from respective time point control. Treatments exposed to HL = 2500 μmol m-2s-1 light intensity, HT = 40°C, HLT = HL with HT for 4, 8, 12, and 48 h. Different colors represent the increase (red) or decrease (blue) of the metabolites fold change as indicated in the color key. Mean values are presented (n = 4).
FIGURE 5
FIGURE 5
Fold change transcript levels of enzymes and transcription factors mediating phenylpropanoid pathway from respective time point control. Fold change values between zero and one (below the dashed line) indicates lower transcrip level compared to the control. ACC, Acetyl-CoA carboxylase 1-like; ANR, Anthocyanidin reductase; C3H, Coumarate 3-hydroxylase; CHS, Chalcone synthase; DFR, Dihydroflavonol 4-reductase; F3′H:flavonoid 3 hydroxylase; F35H: flavonoid 3,5 hydroxylase; MYB, Myb-related transcription factor; OMT, O-methyltransferase; PAL, Phenylalanine ammonia lyase; STS, Stilbene synthase; UFGT, UDP flavonoid 3-O-glucosyltransferase; n = 3, mean values ± SE.
FIGURE 6
FIGURE 6
Fold change in transcript levels of TCA cycle mediating enzymes from respective time point control. Fold change values between zero and one (below the dashed line) indicates lower transcrip level compared to the control. ACo1, Aconitate hydratase 1-like; SDH1, Succinate dehydrogenase; ATCs, Citrate synthase; MDH, Malate dehydrogenase; FUM1, Fumarate hydratase; IDH, Isocitrate dehydrogenase; n = 3, mean values ±SE.

References

    1. AbdElgawad H., Peshev D., Zinta G., Ende W., Janssens I., Asard H. (2014). Climate extreme effects on the chemical composition of temperate grassland species under ambient and elevated CO2: a comparison of fructan and non-fructan accumulators. PLoS ONE 9:e92044 10.1371/journal.pone.0092044 - DOI - PMC - PubMed
    1. Ali K., Maltese F., Choi Y., Verpoorte R. (2010). Metabolic constituents of grapevine and grape-derived products. Phytochem. Rev. 9 357–378. 10.1007/s11101-009-9158-0 - DOI - PMC - PubMed
    1. Arapitsas P., Scholz M., Vrhovsek U., Blasi S., Bartolini A., Masuero D., et al. (2012). A metabolomic approach to the study of wine micro-oxygenation. PLoS ONE 7:e37783 10.1371/journal.pone.0037783 - DOI - PMC - PubMed
    1. Araujo W., Nunes-Nesi A., Nikoloski Z., Sweetlove L., Fernie A. (2012). Metabolic control and regulation of the tricarboxylic acid cycle in photosynthetic and heterotrophic plant tissues. Plant Cell Environ. 35 1–21. 10.1111/j.1365-3040.2011.02332.x - DOI - PubMed
    1. Atkinson N. J., Urwin P. E. (2012). The interaction of plant biotic and abiotic stresses: from genes to the field. J. Exp. Bot. 63 3523–3543. 10.1093/jxb/ers100 - DOI - PubMed