. 2015 Sep 23:6:763.
doi: 10.3389/fpls.2015.00763. eCollection 2015.

Genome-wide gene expression perturbation induced by loss of C2 chromosome in allotetraploid Brassica napus L

Affiliations

Genome-wide gene expression perturbation induced by loss of C2 chromosome in allotetraploid Brassica napus L

Bin Zhu et al. Front Plant Sci. .

Abstract

Aneuploidy with loss of entire chromosomes from normal complement disrupts the balanced genome and is tolerable only by polyploidy plants. In this study, the monosomic and nullisomic plants losing one or two copies of C2 chromosome from allotetraploid Brassica napus L. (2n = 38, AACC) were produced and compared for their phenotype and transcriptome. The monosomics gave a plant phenotype very similar to the original donor, but the nullisomics had much smaller stature and also shorter growth period. By the comparative analyses on the global transcript profiles with the euploid donor, genome-wide alterations in gene expression were revealed in two aneuploids, and their majority of differentially expressed genes (DEGs) resulted from the trans-acting effects of the zero and one copy of C2 chromosome. The higher number of up-regulated genes than down-regulated genes on other chromosomes suggested that the genome responded to the C2 loss via enhancing the expression of certain genes. Particularly, more DEGs were detected in the monosomics than nullisomics, contrasting with their phenotypes. The gene expression of the other chromosomes was differently affected, and several dysregulated domains in which up- or downregulated genes obviously clustered were identifiable. But the mean gene expression (MGE) for homoeologous chromosome A2 reduced with the C2 loss. Some genes and their expressions on C2 were correlated with the phenotype deviations in the aneuploids. These results provided new insights into the transcriptomic perturbation of the allopolyploid genome elicited by the loss of individual chromosome.

Keywords: Brassica napus; aneuploids; monosomy; nullisomy; transcriptome.


Figures

Figure 1
Figure 1
Gene expression evidences for the loss of chromosome C2. (A) Stack column of relative number of mapping reads along all chromosomes. (B) Box plot of Log2(FPKM) of the total expressed genes (FPKM > 0) and those along all chromosomes. *Represents the outlier values. 1% extremely high or low value of gene expression were defined as outlier values in this study.
Figure 2
Figure 2
Differentially expressed genes (DEGs) between B. napus euploid and aneuploids. (A,B) DEGs among three comparisons (A) and 7370 common DEGs (B) between “Oro” vs. mono and “Oro” vs. null were shown in Venn diagram.
Figure 3
Figure 3
More severe dynamic variation of gene expression in monosomics. Coefficient of Variation (COV) of gene expression per chromosome is calculated to measure the gene expression deviation. Red panel represents for “Oro,” blue panel for monosomics, and green panel for nullisomics.
Figure 4
Figure 4
Dysregulated domains of gene expressions on different chromosomes. Log2 fold change of gene expression is performed to measure the expression deviation. Chromosomes A4, A7, A9, C1, C4, C6, and C9 harbor one domain in both comparisons, and C5 and C8 have one only in “Oro” vs. nullisomics comparison. The change between “Oro” and monosomics is shown in blue dot and change between “Oro” and nullisomics in red dot.
Figure 5
Figure 5
The trends of fold change (FC) for mean genes expression along individual chromosome between “Oro” and aneuploidies. The fold change between “Oro” and monosomics [FC(mono/Oro)] is shown in blue solid line and the fold change between “Oro” and nullisomics [FC(null/Oro)] in red solid line. Both of modified fold change (MFC) of A2 are shown in dotted line.
Figure 6
Figure 6
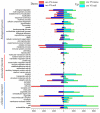
GO assignment of annotated DEGs in “Oro vs. mono” and “Oro vs. null.” DEGs are annotated by three categories: cellular component, molecular functions, and biological process. The left and right of x-axis represent the up-regulated (Red for “Oro vs. mono” and blue for “Oro vs. null”) and down-regulated genes (Green for “Oro vs. mono” and cyan for “Oro vs. null”).
Figure 7
Figure 7
Gene expression compensation of remainder chromosomes in aneuploides. (A) The number of expressed genes (FPKM > 0) along remainder chromosomes. (B,C) Cumulative frequency (B) and relative frequency (C) for expressed genes [log2(FPKM)] are calculated by dividing gene expression into 26 expression bins.

References

    1. Antonarakis S. E., Lyle R., Dermitzakis E. T., Reymond A., Deutsch S. (2004). Chromosome 21 and down syndrome: from genomics to pathophysiology. Nat. Rev. Genet. 5, 725–738. 10.1038/nrg1448 - DOI - PubMed
    1. Birchler J. A., Bhadra U., Bhadra M. P., Auger D. L. (2001). Dosage-dependent gene regulation in multicellular eukaryotes: implications for dosage compensation, aneuploid syndromes, and quantitative traits. Dev. Biol. 234, 275–288. 10.1006/dbio.2001.0262 - DOI - PubMed
    1. Birchler J. A., Newton K. J. (1981). Modulation of protein levels in chromosomal dosage series of maize: the biochemical basis of aneuploid syndromes. Genetics 99, 247–266. - PMC - PubMed
    1. Birchler J. A., Veitia R. A. (2007). The gene balance hypothesis: from classical genetics to modern genomics. Plant Cell 19, 395–402. 10.1105/tpc.106.049338 - DOI - PMC - PubMed
    1. Blakeslee A. F. (1922). Variations in Datura due to changes in chromosome number. Am. Nat. 56, 16–31. 10.1086/279845 - DOI