

An introductory review of parallel independent component analysis (p-ICA) and a guide to applying p-ICA to genetic data and imaging phenotypes to identify disease-associated biological pathways and systems in common complex disorders
- PMID: 26442095
- PMCID: PMC4561364
- DOI: 10.3389/fgene.2015.00276
An introductory review of parallel independent component analysis (p-ICA) and a guide to applying p-ICA to genetic data and imaging phenotypes to identify disease-associated biological pathways and systems in common complex disorders
Abstract
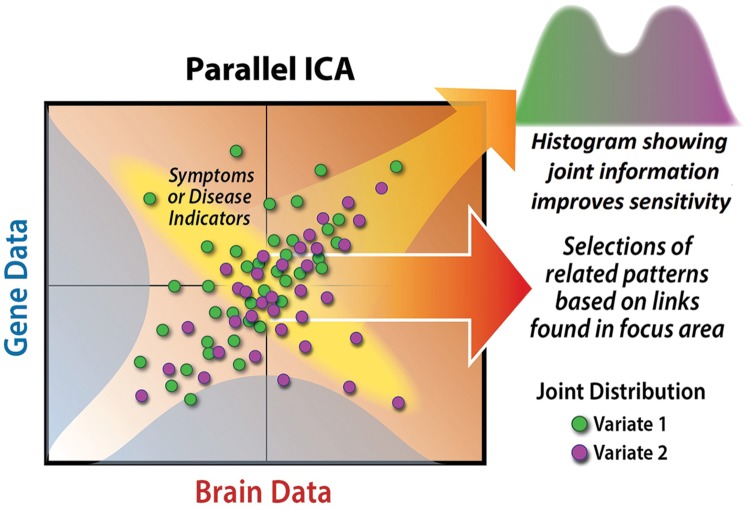
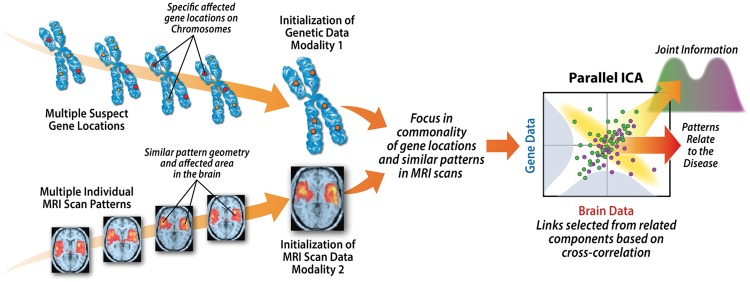
Complex inherited phenotypes, including those for many common medical and psychiatric diseases, are most likely underpinned by multiple genes contributing to interlocking molecular biological processes, along with environmental factors (Owen et al., 2010). Despite this, genotyping strategies for complex, inherited, disease-related phenotypes mostly employ univariate analyses, e.g., genome wide association. Such procedures most often identify isolated risk-related SNPs or loci, not the underlying biological pathways necessary to help guide the development of novel treatment approaches. This article focuses on the multivariate analysis strategy of parallel (i.e., simultaneous combination of SNP and neuroimage information) independent component analysis (p-ICA), which typically yields large clusters of functionally related SNPs statistically correlated with phenotype components, whose overall molecular biologic relevance is inferred subsequently using annotation software suites. Because this is a novel approach, whose details are relatively new to the field we summarize its underlying principles and address conceptual questions regarding interpretation of resulting data and provide practical illustrations of the method.
Keywords: common disease; common variant; genetic risk; imaging genetics; multivariate; parallel independent component analysis.
Figures


Similar articles
-
Multivariate analysis of subjective responses to d-amphetamine in healthy volunteers finds novel genetic pathway associations.Psychopharmacology (Berl). 2015 Aug;232(15):2781-94. doi: 10.1007/s00213-015-3914-1. Epub 2015 Apr 7. Psychopharmacology (Berl). 2015. PMID: 25843748 Free PMC article.
-
Genetic Sources of Subcomponents of Event-Related Potential in the Dimension of Psychosis Analyzed From the B-SNIP Study.Am J Psychiatry. 2015 May;172(5):466-78. doi: 10.1176/appi.ajp.2014.13101411. Epub 2015 Jan 23. Am J Psychiatry. 2015. PMID: 25615564 Free PMC article.
-
Parallel ICA of FDG-PET and PiB-PET in three conditions with underlying Alzheimer's pathology.Neuroimage Clin. 2014 Mar 19;4:508-16. doi: 10.1016/j.nicl.2014.03.005. eCollection 2014. Neuroimage Clin. 2014. PMID: 24818077 Free PMC article.
-
A review of multivariate analyses in imaging genetics.Front Neuroinform. 2014 Mar 26;8:29. doi: 10.3389/fninf.2014.00029. eCollection 2014. Front Neuroinform. 2014. PMID: 24723883 Free PMC article. Review.
-
Imaging genetics and psychiatric disorders.Curr Mol Med. 2015;15(2):168-75. doi: 10.2174/1566524015666150303104159. Curr Mol Med. 2015. PMID: 25732148 Free PMC article. Review.
Cited by
-
Multimodal fusion of brain imaging data: A key to finding the missing link(s) in complex mental illness.Biol Psychiatry Cogn Neurosci Neuroimaging. 2016 May;1(3):230-244. doi: 10.1016/j.bpsc.2015.12.005. Biol Psychiatry Cogn Neurosci Neuroimaging. 2016. PMID: 27347565 Free PMC article.
-
A framework for linking resting-state chronnectome/genome features in schizophrenia: A pilot study.Neuroimage. 2019 Jan 1;184:843-854. doi: 10.1016/j.neuroimage.2018.10.004. Epub 2018 Oct 6. Neuroimage. 2019. PMID: 30300752 Free PMC article.
-
A kernel machine method for detecting higher order interactions in multimodal datasets: Application to schizophrenia.J Neurosci Methods. 2018 Nov 1;309:161-174. doi: 10.1016/j.jneumeth.2018.08.027. Epub 2018 Sep 2. J Neurosci Methods. 2018. PMID: 30184473 Free PMC article.
-
Moving Beyond ERP Components: A Selective Review of Approaches to Integrate EEG and Behavior.Front Hum Neurosci. 2018 Mar 26;12:106. doi: 10.3389/fnhum.2018.00106. eCollection 2018. Front Hum Neurosci. 2018. PMID: 29632480 Free PMC article. Review.
-
The relationship between electrophysiological and hemodynamic measures of neural activity varies across picture naming tasks: A multimodal magnetoencephalography-functional magnetic resonance imaging study.Front Neurosci. 2022 Nov 3;16:1019572. doi: 10.3389/fnins.2022.1019572. eCollection 2022. Front Neurosci. 2022. PMID: 36408411 Free PMC article.
References
-
- Akaike H. (1974). A new look at the statistical model identification. IEEE Trans. Automat. Contr. 19 716–723. 10.1109/TAC.1974.1100705 - DOI
-
- American Psychiatric A., Force D. S. M. T. (2013). Diagnostic and Statistical Manual of Mental Disorders: DSM-5. Washington, DC: American Psychiatric Association.
Publication types
Grants and funding
LinkOut - more resources
Full Text Sources
Other Literature Sources
Miscellaneous