Review
. 2015 Nov;16(11):627-40.
doi: 10.1038/nrg3933. Epub 2015 Oct 7.

Genetic variation and the de novo assembly of human genomes

Affiliations
Review

Genetic variation and the de novo assembly of human genomes

Mark J P Chaisson et al. Nat Rev Genet. 2015 Nov.

Abstract

The discovery of genetic variation and the assembly of genome sequences are both inextricably linked to advances in DNA-sequencing technology. Short-read massively parallel sequencing has revolutionized our ability to discover genetic variation but is insufficient to generate high-quality genome assemblies or resolve most structural variation. Full resolution of variation is only guaranteed by complete de novo assembly of a genome. Here, we review approaches to genome assembly, the nature of gaps or missing sequences, and biases in the assembly process. We describe the challenges of generating a complete de novo genome assembly using current technologies and the impact that being able to perfectly sequence the genome would have on understanding human disease and evolution. Finally, we summarize recent technological advances that improve both contiguity and accuracy and emphasize the importance of complete de novo assembly as opposed to read mapping as the primary means to understanding the full range of human genetic variation.


Figures

Figure 1
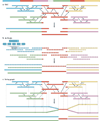
Figure 1. Types of genome assembly gaps
Abstracted images of genome assemblies are illustrated. The genome architecture being resolved is shown at the top of each figure part as thick bars. Repetitive sequences are shown in red. Read overlaps are illustrated below the genome as thin bars (middle of each figure part), with regions overlapping repeats filled as red. The resulting assembly contigs are shown below (bottom of each figure part). Gaps are shown as vertical bars separating contigs to indicate unresolved sequences. a | The absence or reduction in sequence reads due to potential amplification or sequencing biases creates ‘dropouts’, where the assembled sequence is incomplete. b | Large segmental duplications of high sequence identity (orange and green) make read overlaps ambiguous, leading to multiple gaps flanking segmental duplications. The effect becomes exacerbated if the duplications are structurally polymorphic in a diploid genome. Long-range sequence information is required to resolve the complete sequence. c | Satellite-associated gaps are a special case leading to read ‘pileups’ due to higher-order tandem arrays of repetitive sequence, and they cannot be resolved using paired-end sequence information. These occur primarily in centromeric, acrocentric and telomeric areas of genomes. d | Muted gaps arise when the assembly is contracted relative to the true genome when overlaps are consistent with a smaller representation of the genome. These are often associated with repetitive sequences that cannot be easily amplified and/or are incompatible with cloning and propagation (that is, when they are toxic to Escherichia coli), such as simple tandem repeats.
Figure 2
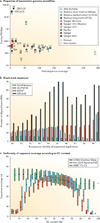
Figure 2. Sequencing and assembly statistics from different platforms
a | A comparison of sequence coverage versus N50 contig length for 30 mammalian genomes from 25 species deposited into the US National Center for Biotechnology Information (NCBI) genome resource, including 5 human genome assemblies (circles). Colours contrast different sequencing platforms and assembly approaches. GRCh38 (human) and GRCm38 (mouse), generated by Sanger sequencing of bacterial artificial chromosome (BAC) clones represent the highest quality of genome. Genomes are enumerated according to species as follows: 1, Ailuropoda melanoleuca GCA_000004335.1; 2, Bos mutus GCA_000298355.1; 3, Bos taurus GCA_000181335.3; 4, Felis silvestris catus GCA_000687225.1; 5, Ursus maritimus GCA_000687225.1; 6, Balaenoptera acutorostrata GCA_000493695.1; 7, Callithrix jacchus GCA_000004665.1; 8, Daubentonia madagascariensis GCA_000241425.1; 9, Lipotes vexillifer GCA_000442215.1; 10, Pteropus alecto GCA_000325575.1; 11 and 12, Mus musculus GCA_000001635.6; 13, Nasalis larvatus GCA_000772465.1; 14, Nomascus leucogenys GCA_000146795.3; 15, Otolemur garnettii GCA_000181295.3; 16, Pan paniscus GCA_000258655.1; 17, Pan troglodytes GCA_000001515.4; 18, Panthera tigris GCA_000464555.1; 19, Papio anubis GCA_000264685.1; 20, Physeter macrocephalus GCA_000472045.1; 21, Pongo abelii GCF_000001545.4; 22, Rattus norvegicus GCA_000001895.4; 23, Saimiri boliviensis GCA_000235385.1; 24, Tarsius syrichta GCA_000164805.2; 25, Tursiops truncatus GCA_000151865.3; 26–30, Homo sapiens (SOAPdenovo, ALLPATHS, HuRef, GRCh38 and MinHash Alignment Process (MHAP), respectively). b | The amount of duplicated sequence represented in different genome assemblies, as determined by whole-genome assembly comparison (WGAC), is shown for SOAPdenovo (YH, GenBank GCA_000004845.2), ALLPATHS (NA12878, GenBank GCA_000185165.1) and MHAP (CHM1, GenBank GCA_000772585), as well as for the human reference genome (GRCh38). None of the de novo assemblies achieves the amount of duplication content resolved by the clone-based GRCh38 assembly, although the resolution of segmental duplication in massively parallel sequencing (MPS)-based assemblies (SOAPdenovo and ALLPATHS) is reduced compared with that of the single-molecule real-time (SMRT) sequence-based assembly MHAP. c | Sequencing read depth is compared to GC composition across the human genome for different platforms: CHM1 Illumina HiSeq (SRP044331), NA12878 Illumina X10 (data from AllSeq) and CHM1 SMRT P5–C3 (SRX533609). (P5–C3 refers to the version of DNA polymerase (P) and chemistry (C) used in the sequencing reaction.) The Illumina bias is decreased in more-modern instruments, whereas the SMRT sequencing coverage is more uniform, with fewer sequence-context gaps. 454, 454 Sequencing; PacBio, Pacific Biosciences.
Figure 3
Figure 3. Genome assembly algorithms
A genome schematic is shown at the top with four unique regions (blue, violet, green and yellow) and two copies of a repeated region (red). Three different strategies for genome assembly are outlined below this schematic. a | Overlap-layout-consensus (OLC). All pairwise alignments (arrows) between reads (solid bars) are detected. Reads are merged into contigs (below the vertical arrow) until a read at a repeat boundary (split colour bar) is detected, leading to a repeat that is unresolved and collapsed into a single copy. b | de Bruijn assembly. Reads are decomposed into overlapping k-mers. An example of the decomposition for k = 3 nucleotides is shown, although in practice k ranges between 31 and 200 nucleotides. Identical k-mers are merged and connected by an edge when appearing adjacently in reads. Contigs are formed by merging chains of k-mers until repeat boundaries are reached. If a k-mer appears in multiple positions (red segment) in the genome, it will fragment assemblies and additional graph operations must be applied to resolve such small repeats. The k-mer approach is ideal for short-read data generated by massively parallel sequencing (MPS). c | String graph. Alignments that may be transitively inferred from all pairwise alignments are removed (grey arrows). A graph is created with a vertex for the endpoint of every read. Edges are created both for each unaligned interval of a read and for each remaining pairwise overlap. Vertices connect edges that correspond to the reads that overlap. When there is allelic variation, alternative paths in the graph are formed. Not shown, but common to all three algorithms, is the use of read pairs to produce the final assembly product.
Figure 4
Figure 4. Assembly of complex regions of human genetic variation
A | Six alternative haplotypes (GRCh38) in the KIR region (chromosome 19q13.42), assembled and sequenced using fosmid clones. The span of each haplotype with respect to the reference genome is denoted by the large rectangle, with the reference genome length being shown as a horizontal line below the rectangle. Deletions (red) are shown within the rectangle and insertions as triangles below, with the base of each triangle representing the length of the insertion. B | A comparison of two GC-rich disease-causing loci, chromosome 9 open reading frame 72 (C9ORF72; which causes frontotemporal dementia (FTD) and amyotrophic lateral sclerosis (ALS)) and fragile X mental retardation 1 (FMR1; which causes fragile X syndrome), in different genome assemblies. The sequence motif associated with the ALS C9ORF72 hexanucleotide repeat (red and blue) is partially resolved in all assemblies except for SOAPdenovo, in which the flanking 3′ region, which contains a divergent repeat motif and interspersed adenine nucleotides, is incomplete (Ba). The FMR1 trinucleotide repeat associated with fragile X syndrome is resolved by the DISCOVAR and MinHash Alignment Process (MHAP) assemblies (Bb). C | Eight different genomic structures associated with direct (H1) and inverted (H2) haplotypes of a gene-rich region on chromosome 17q21.31. The overall length of this region varies from 1.08 Mb to 1.50 Mb owing to variation in segmental duplication content (shown as coloured bars, with the total length given in brackets on the right). The H2D configuration is the only configuration that has large, highly identical duplications in a direct orientation predisposing to deletions that cause Koolen–de Vries syndrome. CRHR1, corticotropin releasing hormone receptor 1; MAPT, microtubule-associated protein tau; NSF, N-ethylmaleimide-sensitive fusion protein. Part C reproduced from REF. , Nature Publishing Group.
Figure 5
Figure 5. Human genetic variation detected with local assembly of single molecules
A | Deletions (red and pink) and insertions (dark and light blue) resolved at base-pair resolution in the genome from the CHM1 cell line through local assembly of the single-molecule real-time (SMRT) reads for events less than 1 kb (Aa) and greater than 1 kb (Ab). Copy number variants found in previous studies,, are in lighter shades, with roughly 85% of events being unique to the CHM1 results. B | An example of a 1.7-kb short tandem repeat (STR) insertion event (represented in a self dot plot) not detected by Illumina resequencing of CHM1 but detected and assembled by SMRT reads. C | This STR insertion contains uniquely identifying 30 bp sequences that, once sequence resolved, may be used to genotype the presence of the insertion in genomes sequenced using Illumina technology. Normalized read depth serves as a proxy for estimating variability of STR length and demonstrates that the STR is highly variable in diverse populations (shown for Western Eurasian (WEA), East Asian (EA), South Asian (SA), African (AFR) and admixed (ADM) individuals). Figure adapted from REF. , Nature Publishing Group.

References

    1. Genomes Project Consortium. An integrated map of genetic variation from 1,092 human genomes. Nature. 2012;491:56–65. - PMC - PubMed
    1. Weinstein JN, et al. The Cancer Genome Atlas Pan-Cancer analysis project. Nat. Genet. 2013;45:1113–1120. - PMC - PubMed
    1. Ng SB, et al. Exome sequencing identifies the cause of a mendelian disorder. Nat. Genet. 2010;42:30–35. - PMC - PubMed
    1. Mills RE, et al. Mapping copy number variation by population-scale genome sequencing. Nature. 2011;470:59–65. - PMC - PubMed
    1. Chaisson MJP, et al. Resolving the complexity of the human genome using single-molecule sequencing. Nature. 2015;517:608–611. Long-read sequencing paired with local assembly reveals structural variation and closes or extends ~50% of the gaps in the reference human genome.

Publication types