. 2015 Oct 20;112(42):E5744-52.
doi: 10.1073/pnas.1510239112. Epub 2015 Oct 6.

Calcineurin mediates homeostatic synaptic plasticity by regulating retinoic acid synthesis

Affiliations

Calcineurin mediates homeostatic synaptic plasticity by regulating retinoic acid synthesis

Kristin L Arendt et al. Proc Natl Acad Sci U S A. .

Abstract

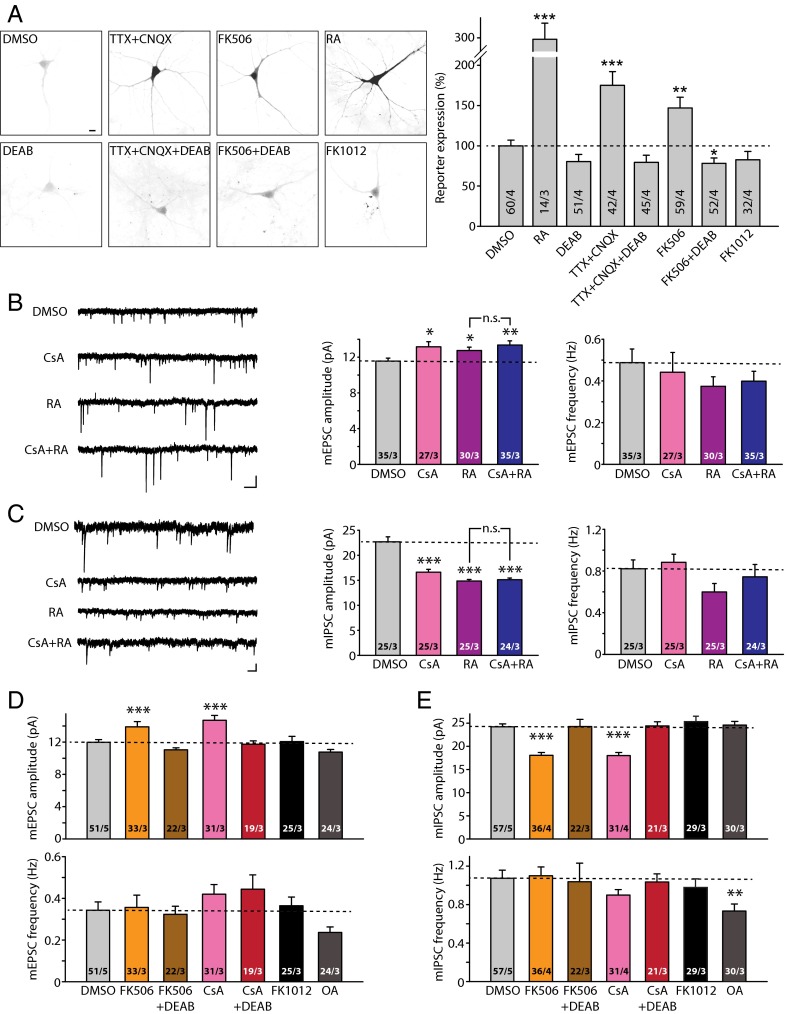
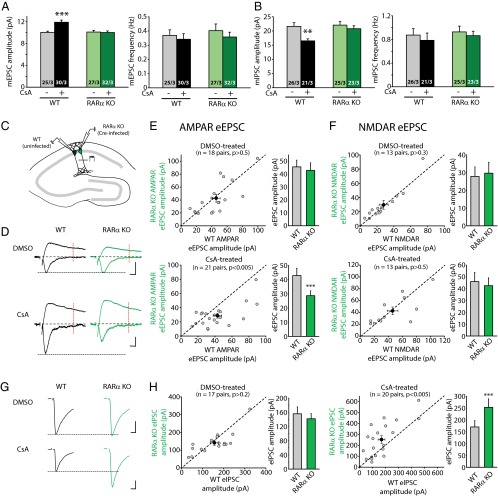
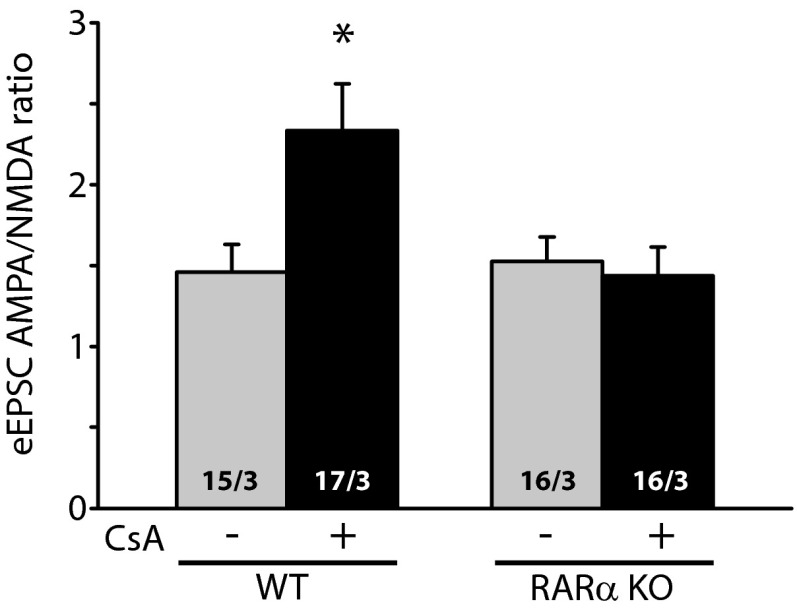
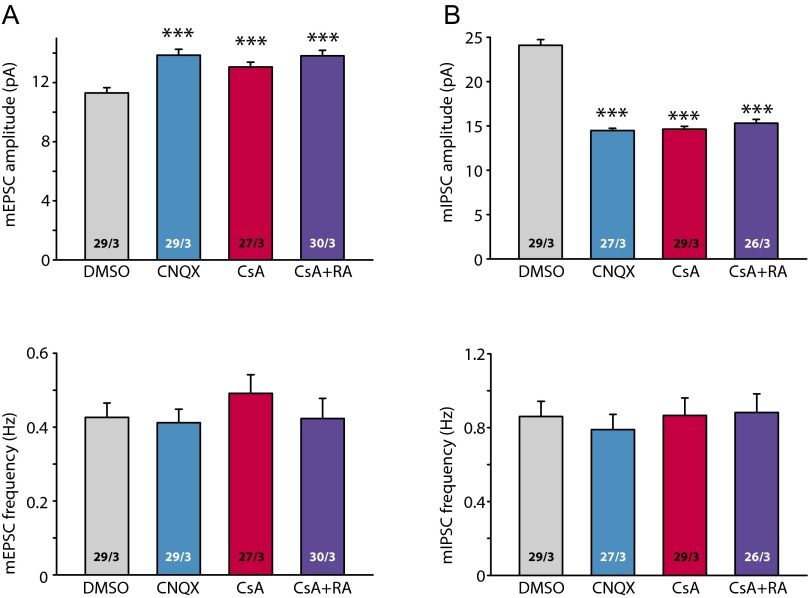
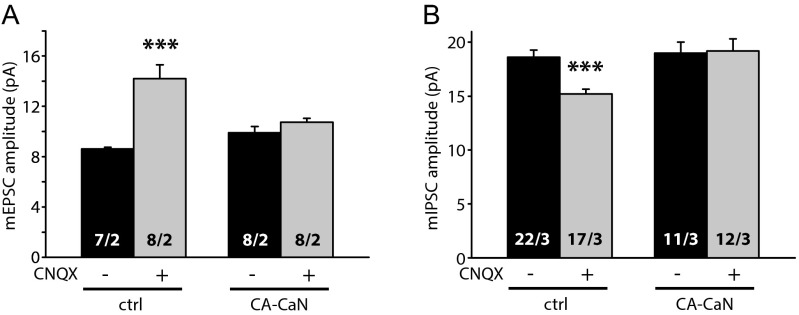
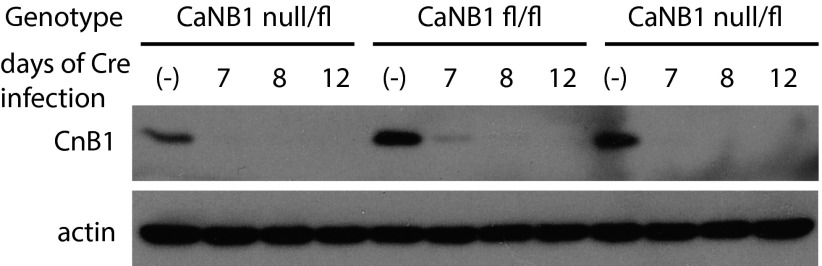
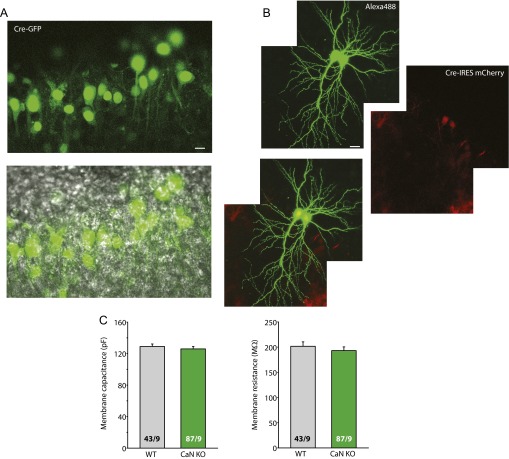
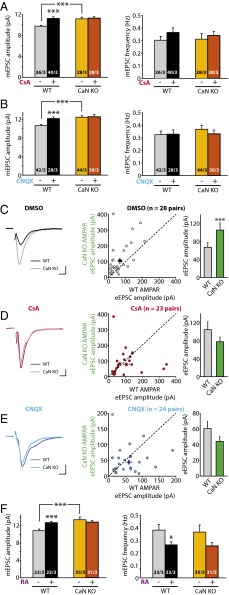
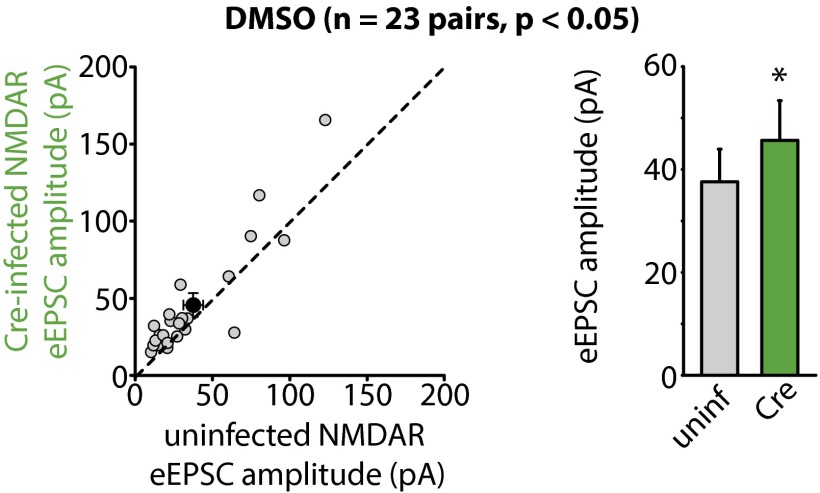
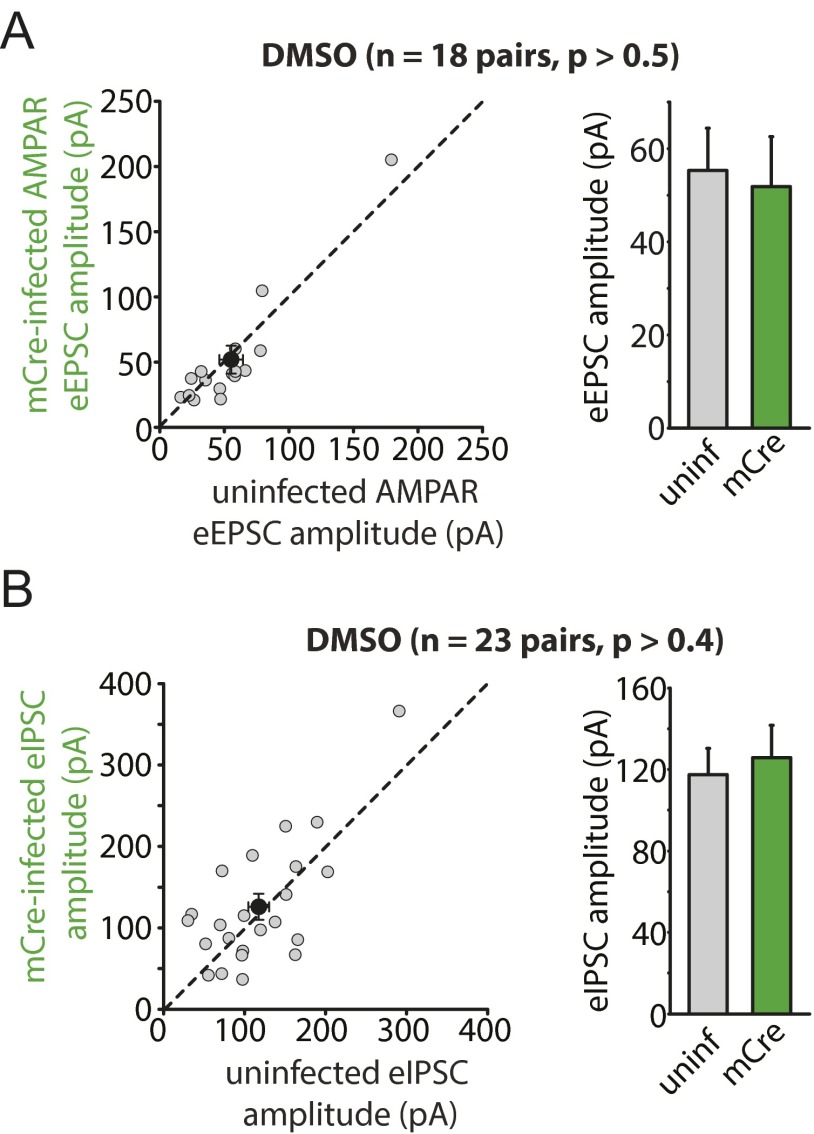
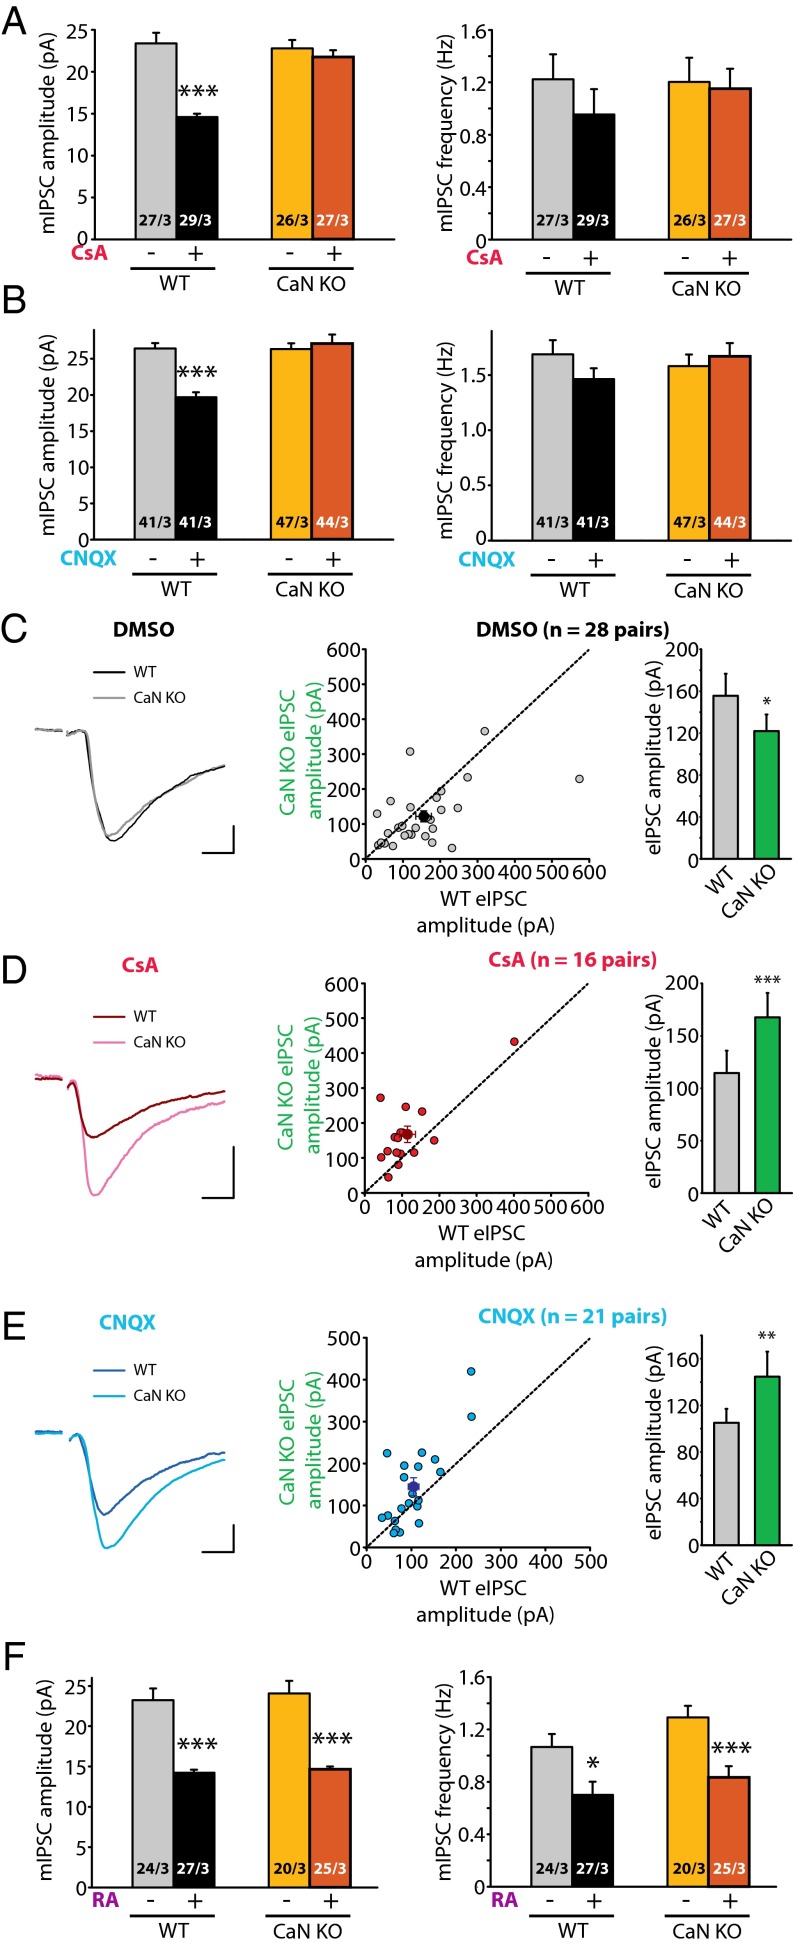
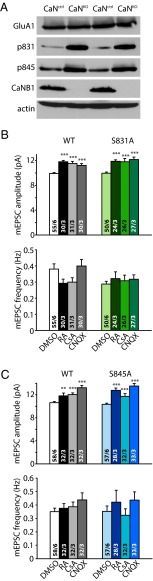
Homeostatic synaptic plasticity is a form of non-Hebbian plasticity that maintains stability of the network and fidelity for information processing in response to prolonged perturbation of network and synaptic activity. Prolonged blockade of synaptic activity decreases resting Ca(2+) levels in neurons, thereby inducing retinoic acid (RA) synthesis and RA-dependent homeostatic synaptic plasticity; however, the signal transduction pathway that links reduced Ca(2+)-levels to RA synthesis remains unknown. Here we identify the Ca(2+)-dependent protein phosphatase calcineurin (CaN) as a key regulator for RA synthesis and homeostatic synaptic plasticity. Prolonged inhibition of CaN activity promotes RA synthesis in neurons, and leads to increased excitatory and decreased inhibitory synaptic transmission. These effects of CaN inhibitors on synaptic transmission are blocked by pharmacological inhibitors of RA synthesis or acute genetic deletion of the RA receptor RARα. Thus, CaN, acting upstream of RA, plays a critical role in gating RA signaling pathway in response to synaptic activity. Moreover, activity blockade-induced homeostatic synaptic plasticity is absent in CaN knockout neurons, demonstrating the essential role of CaN in RA-dependent homeostatic synaptic plasticity. Interestingly, in GluA1 S831A and S845A knockin mice, CaN inhibitor- and RA-induced regulation of synaptic transmission is intact, suggesting that phosphorylation of GluA1 C-terminal serine residues S831 and S845 is not required for CaN inhibitor- or RA-induced homeostatic synaptic plasticity. Thus, our study uncovers an unforeseen role of CaN in postsynaptic signaling, and defines CaN as the Ca(2+)-sensing signaling molecule that mediates RA-dependent homeostatic synaptic plasticity.

Keywords: AMPA receptor trafficking; calcineurin; homeostatic synaptic plasticity; retinoic acid; retinoic acid receptor RARα.


Conflict of interest statement

The authors declare no conflict of interest.

Figures

Fig. 1.
Fig. 1.
Inhibition of CaN activity induces RA synthesis and RA-dependent regulation of synaptic transmission. (A) Sample images (Left) and quantification (Right) of RA synthesis reporter RARE-GFP expression in cultured hippocampal neurons. Here 10 d in vitro (DIV) neurons were transfected with the RARE-GFP reporter and treated with activity blockers or CaN inhibitor. Expression levels are normalized to DMSO controls: RA, 297.86 ± 23.00%; DEAB, 80.30 ± 8.97%; TTX+CNQX, 175.07 ± 17.22%; TTX+CNQX+DEAB, 79.42 ± 8.78%; FK506, 146.95 ± 13.30%; FK+DEAB, 78.18 ± 6.68%; FK1012, 82.57 ± 10.39%. **P < 0.01; ***P < 0.005, one-way ANOVA. (B) Example traces (Left) and quantification (Right) for mEPSC amplitudes and frequencies recorded from neurons treated with DMSO (36 h), CsA (36 h), RA (4 h), and CsA (36 h) + RA (4 h). Amplitudes: DMSO, 11.56 ± 0.34 pA; CsA, 13.16 ± 0.57 pA; RA, 12.75 ± 0.38 pA; CsA+RA, 13.36 ± 0.48 pA. *P < 0.05; **P < 0.01. Frequencies: DMSO, 0.49 ± 0.07 Hz; CsA, 0.44 ± 0.10 Hz; RA, 0.37 ± 0.05 Hz; CsA+RA, 0.40 ± 0.05 Hz. P > 0.5, one-way ANOVA. (C) Example traces (Left) and quantification (Right) for mIPSC amplitudes and frequencies recorded from neurons treated with DMSO (36 h), CsA (36 h), RA (4 h), and CsA (36 h) + RA (4 h). Amplitudes: DMSO, 22.69 ± 1.01 pA; CsA, 16.61 ± 0.58 pA; RA, 14.86 ± 0.30 pA; CsA+RA, 15.10 ± 0.35 pA. ***P < 0.005. Frequencies: DMSO, 0.82 ± 0.08 Hz; CsA, 0.88 ± 0.08 Hz; RA, 0.60 ± 0.08 Hz; CsA+RA, 0.74 ± 0.12 Hz. P > 0.5, one-way ANOVA. (D) Summary of mEPSC amplitudes and frequencies recorded from neurons receiving treatment with CaN inhibitors with or without DEAB, and with FK1012 and okadaic acid (all treatments for 36 h). Amplitudes: DMSO, 11.98 ± 0.33 pA; FK506, 13.90 ± 0.64 pA; FK506+DEAB, 11.05 ± 0.24 pA; CsA, 14.70 ± 0.61 pA; CsA+DEAB, 11.73 ± 0.42 pA; FK1012, 12.07 ± 0.64 pA; OA, 10.77 ± 0.32. ***P < 0.005, one-way ANOVA. Frequencies: DMSO, 0.34 ± 0.04 Hz; FK506, 0.36 ± 0.06 Hz; FK506 ± DEAB, 0.32 ± 0.04 Hz; CsA, 0.42 ± 0.05 Hz; CsA+DEAB, 0.44 ± 0.07 Hz; FK1012, 0.36 ± 0.04 Hz; OA, 0.24 ± 0.03 Hz. (E) Summary of mIPSC amplitudes and frequencies recorded from neurons receiving treatments of CaN inhibitors with or without DEAB, and with FK1012 and okadaic acid (all treatments for 36 h). Amplitudes: DMSO, 24.22 ± 0.64 pA; FK506, 18.05 ± 0.61 pA; FK506+DEAB, 24.29 ± 1.53 pA; CsA, 17.99 ± 0.68 pA; CsA+DEAB, 24.40 ± 0.89 pA; FK1012, 25.27 ± 1.15 pA; OA, 24.58 ± 0.82. ***P < 0.005, one-way ANOVA. Frequencies: DMSO, 1.07 ± 0.08 Hz; FK506, 1.10 ± 0.09 Hz; FK506 ± DEAB, 1.03 ± 0.19 Hz; CsA, 0.90 ± 0.06 Hz; CsA+DEAB, 1.03 ± 0.08 Hz; FK1012, 0.98 ± 0.09 Hz; OA, 0.73 ± 0.07 Hz. In all graphs, data represent average values ± SEM.
Fig. S1.
Fig. S1.
RA synthesis inhibitor DEAB does not change basal synaptic transmission. (A) Quantification of mEPSCs recorded from DMSO- or DEAB-treated hippocampal slices. DMSO or DEAB was added to the cultured slices at 36 h before recording. Amplitudes: DMSO, 9.99 ± 0.33 pA; DEAB, 10.17 ± 0.41 pA. Frequencies: DMSO, 0.35 ± 0.06 Hz; DEAB, 0.31 ± 0.03 Hz. P > 0.5, one-way ANOVA. (B) Quantification of mIPSCs recorded from DMSO- or DEAB-treated hippocampal slices. Amplitudes: DMSO, 22.90 ± 0.91 pA; DEAB, 23.17 ± 1.15 pA. Frequencies: DMSO, 0.67 ± 0.09 Hz; DEAB, 0.68 ± 0.08 Hz. P > 0.5, one-way ANOVA.
Fig. S2.
Fig. S2.
Inhibition of CaN activity does not alter passive membrane properties of neurons. Passive membrane properties of the neurons treated with CaN inhibitors DEAB, FK1012, or OA. (Left) Membrane capacitance. (Right) Membrane resistance.
Fig. S3.
Fig. S3.
Prolonged inhibition of PKC and CaMKII does not alter synaptic transmission. (A) Summary of mEPSCs recorded from neurons treated with a pan-PKC inhibitor Go 6983 (10 μM) for 36 h. Amplitudes: DMSO, 9.20 ± 0.29 pA; Go, 9.04 ± 0.23 pA. Frequencies: DMSO, 0.30 ± 0.06 Hz; Go, 0.25 ± 0.04 Hz. P > 0.4, one-way ANOVA. (B) Summary of mEPSCs recorded from neurons treated with KN-93 (30 μM), a CaMKII inhibitor. Amplitudes: DMSO, 10.27 ± 0.33 pA; Go, 9.94 ± 0.18 pA. Frequencies: DMSO, 0.34 ± 0.04 Hz; Go, 0.29 ± 0.02 Hz. P > 0.7, one-way ANOVA.
Fig. 2.
Fig. 2.
Regulation of synaptic strength by CaN inhibition requires RA signaling. (A) Quantification of mEPSCs recorded from WT and RARα KO neurons treated with CsA for 36 h. WT amplitudes: control, 10.04 ± 0.23 pA; CsA, 11.91 ± 0.39 pA; ***P < 0.005. RARα KO amplitudes: control, 10.11 ± 0.31 pA, CsA, 10.01 ± 0.29 pA; P > 0.5. WT frequencies: control, 0.37 ± 0.04 Hz; CsA, 0.34 ± 0.04 Hz; P > 0.5. RARα KO frequencies: control, 0.40 ± 0.05 Hz; CsA, 0.36 ± 0.03 Hz; P > 0.5, one-way ANOVA. (B) Quantification of mIPSCs recorded from WT and RARα KO neurons treated with CsA for 36 h. WT amplitudes: control, 21.60 ± 1.31 pA; CsA, 16.50 ± 0.72 pA; **P < 0.01. RARα KO amplitudes: control, 22.06 ± 1.23 pA; CsA, 20.78 ± 1.02 pA; P > 0.5. WT frequencies: control, 0.87 ± 0.11 Hz; CsA, 0.78 ± 0.12 Hz; P > 0.5; RARα KO frequencies: control, 0.93 ± 0.10 Hz; CsA, 0.86 ± 0.07 Hz; P > 0.5, one-way ANOVA. (C) Recording configuration for paired recordings of evoked synaptic transmission. (D) Example traces of eEPSCs recorded from WT and RARα KO neurons treated with DMSO or CsA for 36 h. Red lines indicate the time point (60 ms after stimulation) at which NMDAR-mediated response was measured. (Scale bars: 20 pA and 10 ms.) (E) Scatterplots of AMPAR eEPSCs from individual pairs (gray circles) and group mean ± SEM (black circles) of simultaneously recorded WT and neighboring RARα KO neurons. Average amplitudes are summarized on the right. DMSO-treated: WT, 45.61 ± 5.25 pA; RARα KO, 42.87 ± 5.89 pA; P > 0.5. CsA-treated: WT, 42.87 ± 5.15 pA; RARα KO, 28.69 ± 3.42 pA; ***P < 0.005, paired t test. (F) Scatterplots of NMDAR eEPSCs from individual pairs (gray circles) and group mean ± SEM (black circles) of simultaneously recorded WT and neighboring RARα KO neurons. Average amplitudes are summarized on the right. DMSO-treated: WT, 27.87 ± 5.38 pA; RARα KO, 29.67 ± 6.21 pA; P > 0.5. CsA-treated: WT, 46.04 ± 7.67 pA; RARα KO, 42.59 ± 6.57 pA; P > 0.5, paired t test. (G) Example traces of eIPSCs recorded from WT and RARα KO neurons treated with DMSO or CsA for 36 h. (Scale bars: DMSO, 50 pA and 10 ms; CsA, 100 pA and 10 ms.) (H) Scatterplots of eIPSCs from individual pairs (gray circles) and group mean ± SEM (black circles) of simultaneously recorded WT and neighboring RARα KO neurons. Average amplitudes are summarized on the right. DMSO-treated: WT, 155.66 ± 19.57 pA; RARα KO, 141.61 ± 14.79 pA; P > 0.2. CsA-treated: WT, 170.29 ± 26.45 pA; RARα KO, 253.04 ± 35.73 pA; ***P < 0.005, paired t test. In all graphs, data represent average values ± SEM.
Fig. S4.
Fig. S4.
Deletion of RARα does not alter gross morphology or passive membrane properties of neurons. (A) Images of RARα cKO hippocampal pyramidal neurons infected with Cre-expressing lentivirus. (Upper) GFP-Cre. (Lower) GFP-Cre and DIC overlay. Relatively sparse infection, indicated by the GFP-Cre signal, is achieved to facilitate paired recordings of neighboring infected and uninfected neurons. (Scale bar: 10 μm.) (B) Images of two RARα cKO hippocampal neurons infected with Cre-IRES-mCherry–expressing viruses filled with Alexa Fluor 488. (Scale bar: 20 μm.) (C) Passive membrane properties of the WT and RARα KO neurons. (Left) Membrane capacitance. (Right) Membrane resistance. P > 0.5, one-way ANOVA.
Fig. S5.
Fig. S5.
Deletion of RARα blocks the increase in AMPAR/NMDAR ratios of eEPSCs induced by prolonged inhibition of CaN activity. Quantification of AMPAR/NMDAR ratios from WT or RARα KO neurons treated with DMSO or CsA for 36 h. WT: control, 1.46 ± 0.17; CsA, 2.33 ± 0.29; *P < 0.05. RARα KO: control, 1.52 ± 0.15; CsA, 1.43 ± 0.18 pA; P > 0.7, one-way ANOVA.
Fig. S6.
Fig. S6.
mCre infection in RARα cKO neurons does not affect CsA-induced changes in synaptic transmission. (A) Scatterplots of AMPAR eEPSCs from individual pairs (gray circles) and group mean ± SEM (black circles) of simultaneously recorded uninfected and neighboring mCre-infected neurons. Average amplitudes are summarized on the right: DMSO-treated: uninfected, 68.30 ± 12.25 pA; mCre-infected, 67.34 ± 14.10 pA; CsA-treated: uninfected, 51.14 ± 4.20 pA; mCre-infected, 44.69 ± 8.22 pA. P > 0.5, paired t test. (B) Scatterplots of eIPSCs from individual pairs (gray circles) and group mean ± SEM (black circles) of simultaneously recorded uninfected and neighboring mCre-infected neurons. Average amplitudes are summarized on the right: DMSO-treated: uninfected, 164.07 ± 17.64 pA; mCre-infected, 158.66 ± 19.09 pA; CsA-treated, uninfected, 240.18 ± 40.64 pA; mCre-infected, 290.05 ± 68.37 pA. P > 0.5, paired t test.
Fig. S7.
Fig. S7.
CaN inhibitor treatment occludes activity blocker-induced homeostatic synaptic plasticity. (A) Quantification of mEPSCs recorded from neurons treated with DMSO, CNQX, CsA, and CsA+CNQX for 36 h. Amplitudes: DMSO, 11.29 ± 0.36 pA; CNQX, 13.86 ± 0.40 pA; CsA, 13.05 ± 0.33 pA; CsA+CNQX, 13.81 ± 0.38 pA; ***P < 0.001. Frequencies: DMSO, 0.43 ± 0.04 Hz; CNQX, 0.41 ± 0.04 Hz; CsA, 0.49 ± 0.05 Hz; CsA+CNQX, 0.42 ± 0.05 Hz; P > 0.5; one-way ANOVA. (B) Quantification of mIPSCs recorded from neurons treated with DMSO, CNQX, CsA, and CsA+CNQX for 36 h. Amplitudes: DMSO, 24.10 ± 0.64 pA; CNQX, 14.47 ± 0.27 pA; CsA, 14.64 ± 0.31 pA; CsA+CNQX, 15.32 ± 0.42 pA; ***P < 0.001. Frequencies: DMSO, 0.86 ± 0.08 Hz; CNQX, 0.79 ± 0.08 Hz; CsA, 0.87 ± 0.09 Hz; CsA+CNQX, 0.88 ± 0.10 Hz; P > 0.5, one-way ANOVA.
Fig. S8.
Fig. S8.
Constitutively active CaN blocks homeostatic plasticity induced by prolonged CNQX treatment. (A) Summary of mEPSC amplitudes recorded from constitutively active CaN (CA-CaN) treated with DMSO or CNQX. Uninfected: control, 8.61 ± 0.14 pA; CNQX, 14.19 ± 1.10 pA; ***P < 0.001. CA-CaN: control, 9.89 ± 0.51 pA; CNQX, 10.73 ± 0.32 pA; P > 0.1). (B) Summary of mIPSC amplitudes recorded from CA-CaN treated with DMSO or CNQX. Uninfected: control, 18.62 ± 0.65 pA; CNQX, 15.20 ± 0.45 pA; ***P < 0.001. CA-CaN: control, 18.98 ± 1.04 pA; CNQX, 19.18 ± 1.13 pA; P > 0.4.
Fig. S9.
Fig. S9.
Immunoblot of CaNB1 from cultured cortical neurons. Cortical neurons from CaNB1 fl/fl or null/fl mouse brain were cultured and infected with lentiviruses expressing Cre recombinase. Cell lysates were collected at 7, 8, and 12 d after infection and blotted for CaNB1.
Fig. S10.
Fig. S10.
Deletion of CaN does not alter gross morphology or passive membrane properties of neurons. (A) Images of CaNB1 null/fl hippocampal pyramidal neurons infected with Cre-expressing lentivirus. (Upper) GFP-Cre. (Lower) GFP-Cre and DIC overlay. Relatively sparse infection, indicated by the GFP-Cre signal, is achieved to facilitate paired recordings of neighboring infected and uninfected neurons. (Scale bar: 10 μm.) (B) Images of two CaNB1 null/fl hippocampal neurons infected with Cre-IRES-mCherry–expressing viruses filled with Alexa Fluor 488. (Scale bar: 20 μm.) (C) Passive membrane properties of the WT and CaN KO neurons. (Left) Membrane capacitance. (Right) Membrane resistance. P > 0.5, one-way ANOVA.
Fig. 3.
Fig. 3.
CaN deletion blocks homeostatic synaptic plasticity induced by synaptic activity blockade at excitatory synapses. (A) Quantification of mEPSCs recorded from WT and CaN KO neurons treated with DMSO or CsA. WT amplitudes: DMSO control, 9.77 ± 0.17 pA; CsA, 11.25 ± 0.31 pA; ***P < 0.005. CaN KO amplitudes: control, 11.17 ± 0.32 pA; CsA, 11.29 ± 0.32 pA; P > 0.5. WT frequencies: control, 0.30 ± 0.03 Hz; CsA, 0.37 ± 0.04 Hz; P > 0.5. CaN KO frequencies: control, 0.31 ± 0.04 Hz; CsA, 0.34 ± 0.03 Hz; P > 0.5, one-way ANOVA. (B) Quantification of mEPSCs recorded from WT and CaN KO neurons treated with DMSO or CNQX. WT amplitudes: DMSO control, 10.62 ± 0.26 pA; CNQX, 12.15 ± 0.35 pA; ***P < 0.005. CaN KO amplitudes: control, 12.45 ± 0.32 pA; CNQX, 12.54 ± 0.48 pA; P > 0.5. WT frequencies: control, 0.33 ± 0.03 Hz; CNQX, 0.33 ± 0.03 Hz; P > 0.5. CaN KO frequencies: control, 0.37 ± 0.03 Hz; CNQX, 0.33 ± 0.03 Hz; P > 0.5, one-way ANOVA. (C) Example traces (Left) and scatterplot (Right) of eEPSCs recorded from WT and CaN KO pairs treated with DMSO. Individual pairs are plotted in gray circles; group means, in black circles. Average amplitudes are summarized on the right: WT, 67.26 ± 10.73 pA; CaN KO, 105.68 ± 16.36 pA; ***P < 0.005, paired t test. (Scale bars: 20 pA and 10 ms.) (D) Example traces (Left) and scatterplot (Right) of eEPSCs recorded from WT and CaN KO pairs treated with CsA. Average amplitudes are summarized on the right: WT, 104.70 ± 17.88 pA; CaN KO, 77.92 ± 10.34 pA; P > 0.1, paired t test. (Scale bars: 20 pA and 10 ms.) (E) Example traces (Left) and scatterplot (Right) of eEPSCs recorded from WT and CaN KO pairs treated with CNQX. Average amplitudes are summarized on the right: WT, 60.57 ± 9.09 pA; CaN KO, 44.28 ± 6.38 pA; P > 0.05, paired t test. (Scale bars: 20 pA and 10 ms.) (F) Quantification of mEPSCs recorded from WT and CaN KO neurons treated with DMSO or RA. WT amplitudes: DMSO control, 10.90 ± 0.36 pA; RA, 12.73 ± 0.31 pA; ***P < 0.005. CaN KO amplitudes: control, 13.40 ± 0.62 pA; RA, 12.82 ± 0.38 pA; ***P < 0.005. WT frequencies: control, 0.53 ± 0.06 Hz; RA, 0.37 ± 0.03 Hz; *P < 0.05. CaN KO frequencies: control, 0.51 ± 0.08 Hz; RA, 0.36 ± 0.04 Hz; P > 0.05, one-way ANOVA. In all graphs, data represent average values ± SEM.
Fig. S11.
Fig. S11.
Deletion of CaN elevates basal synaptic NMDAR responses. Scatterplots of NMDAR eEPSCs (measured at +40 mV) from individual pairs (gray circles) and group mean ± SEM (black circles) of simultaneously recorded uninfected and neighboring Cre-infected neurons from conditional CaN-B KO slices. Average amplitudes are summarized on the right: uninfected, 37.55 ± 6.38 pA; Cre-infected, 45.60 ± 7.73 pA. *P < 0.05, paired t test.
Fig. S12.
Fig. S12.
mCre infection in CaN conditional KO neurons does not affect basal transmission. (A) Scatterplots of AMPAR eEPSCs from individual pairs (gray circles) and group mean ± SEM (black circles) of simultaneously recorded uninfected and neighboring mCre-infected neurons. Average amplitudes are summarized on the right: uninfected, 55.32 ± 9.04 pA; mCre-infected, 51.84 ± 10.77 pA. P > 0.5, paired t test. (B) Scatterplots of eIPSCs from individual pairs (gray circles) and group mean ± SEM (black circles) of simultaneously recorded uninfected and neighboring mCre-infected neurons. Average amplitudes are summarized on the right: uninfected, 117.43 ± 12.87 pA; mCre-infected, 125.72 ± 15.89 pA. P > 0.5, paired t test.
Fig. 4.
Fig. 4.
CaN deletion blocks homeostatic synaptic plasticity induced by synaptic activity blockade at inhibitory synapses. (A) Quantification of mIPSCs recorded from WT and CaN KO neurons treated with DMSO or CsA. WT amplitudes: DMSO control, 23.38 ± 1.25 pA; CsA, 14.59 ± 0.42 pA; ***P < 0.005. CaN KO amplitudes: control, 22.79 ± 1.01 pA; CsA, 21.76 ± 0.79 pA; P > 0.4. WT frequencies: control, 1.22 ± 0.19 Hz; CsA, 0.95 ± 0.19 Hz; P > 0.3. CaN KO frequencies: control, 1.20 ± 0.19 Hz; CsA, 1.15 ± 0.15 Hz; P > 0.8, one-way ANOVA. (B) Quantification of mIPSCs recorded from WT and CaN KO neurons treated with DMSO or CNQX. WT amplitudes: DMSO control, 26.42 ± 0.76 pA; CNQX, 19.67 ± 0.70 pA; ***P < 0.005. CaN KO amplitudes: control, 26.33 ± 0.83 pA; CNQX, 27.12 ± 1.24 pA; P > 0.5. WT frequencies: control, 1.69 ± 0.13 Hz; CNQX, 1.46 ± 0.10 Hz; P > 0.15. CaN KO frequencies: control, 1.58 ± 0.11 Hz; CNQX, 1.67 ± 0.12 Hz; P > 0.5, one-way ANOVA. (C) Example traces (Left) and scatterplot (Right) of eIPSCs recorded from WT and CaN KO pairs treated with DMSO. Individual pairs are plotted in gray circles; group means, in black circles. Average amplitudes are summarized on the right: WT, 155.53 ± 20.95 pA; CaN KO, 121.83 ± 15.73 pA; *P < 0.05, paired t test. (Scale bars: 50 pA and 10 ms.) (D) Examples traces (Left) and scatterplot (Right) of eIPSCs recorded from WT and CaN KO pairs treated with CsA. Average amplitudes are summarized on the right: WT, 114.50 ± 21.33 pA; CaN KO, 167.73 ± 23.29 pA; ***P < 0.005, paired t test. (Scale bars: 50 pA and 10 ms.) (E) Example traces (Left) and scatterplot (Right) of eIPSCs recorded from WT and CaN KO pairs treated with CNQX. Average amplitudes are summarized on the right: WT, 105.04 ± 11.95 pA; CaN KO, 144.61 ± 21.50 pA; **P < 0.01, paired t test. (Scale bars: 50 pA and 10 ms.) (F) Quantification of mIPSCs recorded from WT and CaN KO neurons treated with DMSO or RA. WT amplitudes: DMSO control, 23.23 ± 1.46 pA; RA, 14.23 ± 0.37 pA; ***P < 0.005. CaN KO amplitudes: control, 24.08 ± 1.56 pA; RA, 14.65 ± 0.35 pA; ***P < 0.005. WT frequencies: control, 1.07 ± 0.10 Hz; RA, 0.70 ± 0.10 Hz; *P < 0.05. CaN KO frequencies: control, 1.29 ± 0.09 Hz; RA, 0.83 ± 0.08 Hz; ***P < 0.005, one-way ANOVA. In all graphs, data represent average values ± SEM.
Fig. 5.
Fig. 5.
Phosphorylation of GluA1 at S831 and S845 sites is not required for regulation of synaptic strength by RA or CaN inhibitors. (A) Immunoblot of phosphorylated GluA1 S831 and S845 in P21 WT and Emx-Cre CaN KO hippocampus. (B) Quantification of mEPSCs recorded from S831A KI mice treated with RA, CsA, or CNQX. WT amplitudes: DMSO, 9.91 ± 0.16 pA; RA, 11.80 ± 0.23 pA; CsA, 11.53 ± 0.34 pA; CNQX, 11.22 ± 0.28 pA; ***P < 0.005. S831A KI amplitudes: DMSO, 9.97 ± 0.18 pA; RA, 11.88 ± 0.24 pA; CsA, 11.80 ± 0.54 pA; CNQX, 12.16 ± 0.41 pA ***P < 0.005. WT frequencies: DMSO, 0.38 ± 0.03 Hz; RA, 0.29 ± 0.03 Hz; CsA, 0.30 ± 0.03 Hz; CNQX, 0.40 ± 0.04 Hz, P > 0.1. S831A KI frequencies: DMSO, 0.29 ± 0.02 Hz; RA, 0.32 ± 0.04 Hz; CsA, 0.31 ± 0.03 Hz; CNQX, 0.32 ± 0.03 Hz, P > 0.3, one-way ANOVA. (C) Quantification of mEPSCs recorded from S845A KI mice treated with RA, CsA, or CNQX. WT amplitudes: DMSO, 10.62 ± 0.20 pA; RA, 11.81 ± 0.49 pA; CsA, 12.04 ± 0.29 pA; CNQX, 13.23 ± 0.38 pA; **P < 0.01; ***P < 0.005. S845A KI amplitudes: DMSO, 10.34 ± 0.21 pA; RA, 12.78 ± 0.39 pA; CsA, 11.72 ± 0.49 pA; CNQX, 13.51 ± 0.44 pA; ***P < 0.005. WT frequencies: DMSO, 0.35 ± 0.03 Hz; RA, 0.37 ± 0.03 Hz; CsA, 0.39 ± 0.04 Hz; CNQX, 0.44 ± 0.05 Hz; P > 0.3. S845A KI frequencies: DMSO, 0.35 ± 0.04 Hz; RA, 0.42 ± 0.09 Hz; CsA, 0.32 ± 0.05 Hz; CNQX, 0.44 ± 0.06 Hz; P > 0.2, one-way ANOVA. In all graphs, data represent average values ± SEM.

References

    1. Turrigiano G. Homeostatic synaptic plasticity: Local and global mechanisms for stabilizing neuronal function. Cold Spring Harb Perspect Biol. 2012;4(1):a005736. - PMC - PubMed
    1. Davis GW, Müller M. Homeostatic control of presynaptic neurotransmitter release. Annu Rev Physiol. 2015;77:251–270. - PubMed
    1. Chen L, Lau AG, Sarti F. Synaptic retinoic acid signaling and homeostatic synaptic plasticity. Neuropharmacology. 2014;78:3–12. - PMC - PubMed
    1. Aoto J, Nam CI, Poon MM, Ting P, Chen L. Synaptic signaling by all-trans retinoic acid in homeostatic synaptic plasticity. Neuron. 2008;60(2):308–320. - PMC - PubMed
    1. Sarti F, Zhang Z, Schroeder J, Chen L. Rapid suppression of inhibitory synaptic transmission by retinoic acid. J Neurosci. 2013;33(28):11440–11450. - PMC - PubMed

Publication types

LinkOut - more resources