. 2015 Oct 7;10(10):e0140025.
doi: 10.1371/journal.pone.0140025. eCollection 2015.

Endoplasmic Reticulum Stress-Induced Autophagy Provides Cytoprotection from Chemical Hypoxia and Oxidant Injury and Ameliorates Renal Ischemia-Reperfusion Injury

Affiliations

Endoplasmic Reticulum Stress-Induced Autophagy Provides Cytoprotection from Chemical Hypoxia and Oxidant Injury and Ameliorates Renal Ischemia-Reperfusion Injury

Bhavya B Chandrika et al. PLoS One. .

Abstract

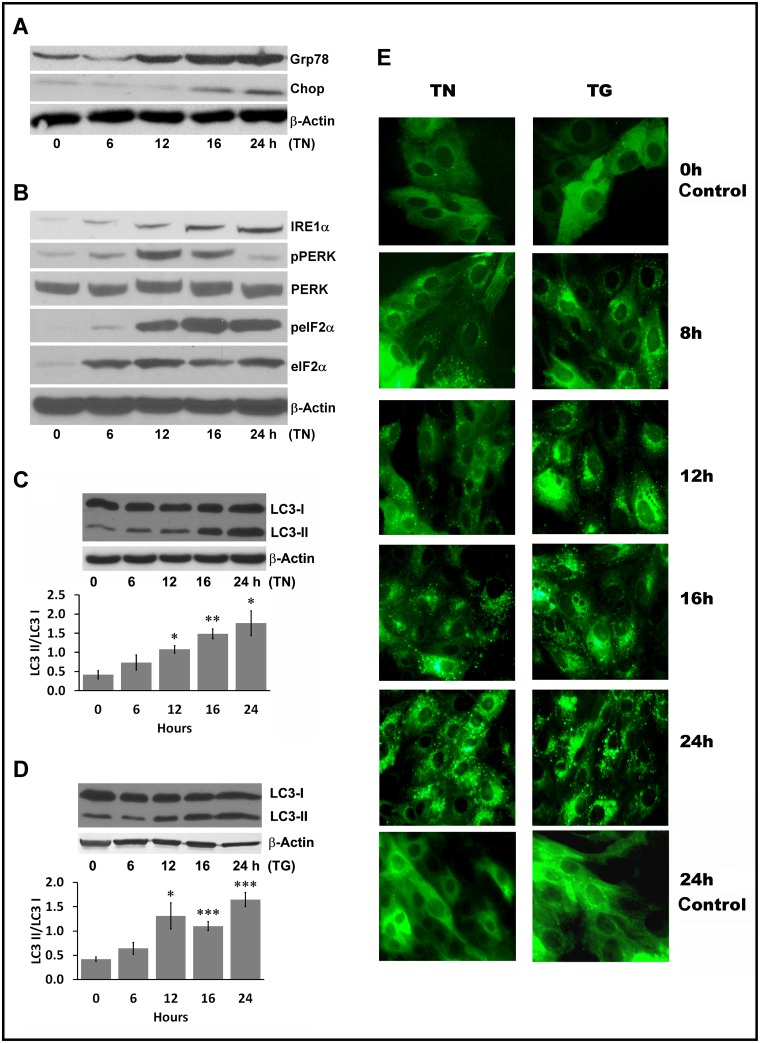
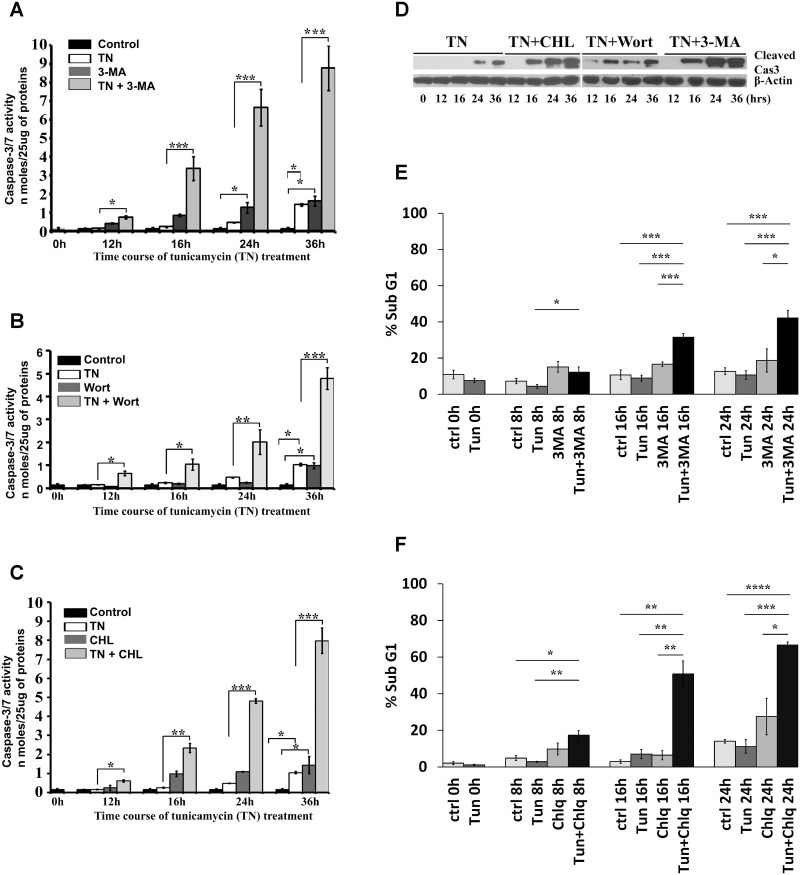
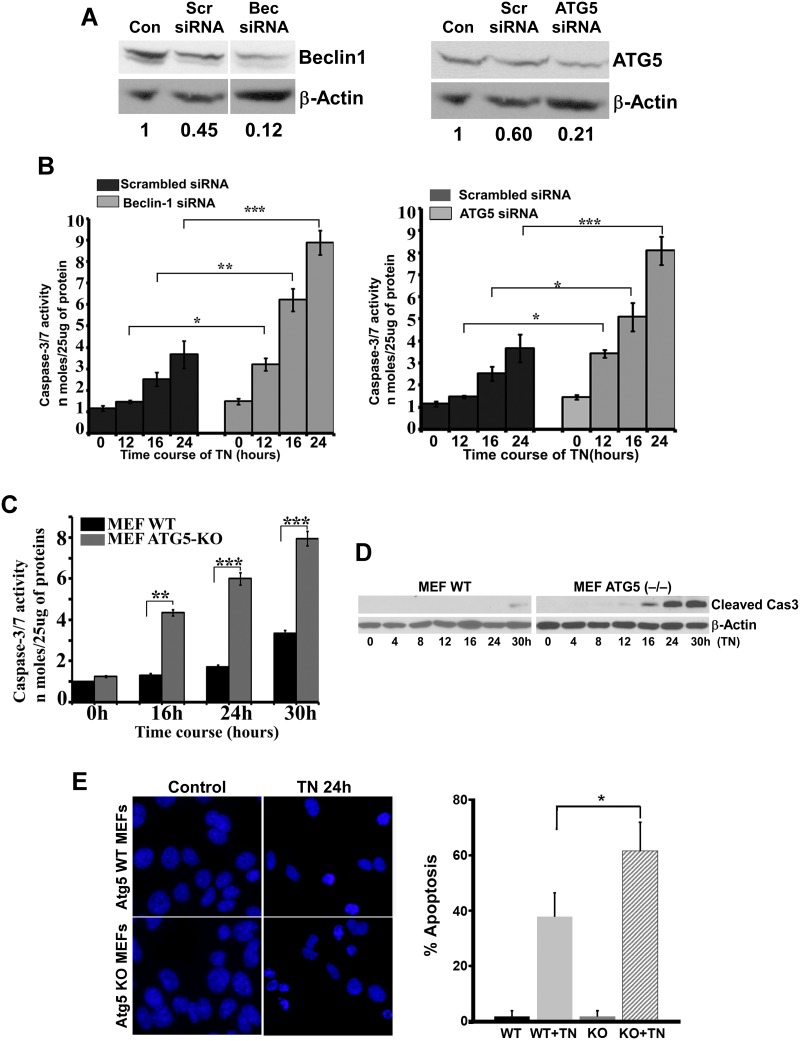
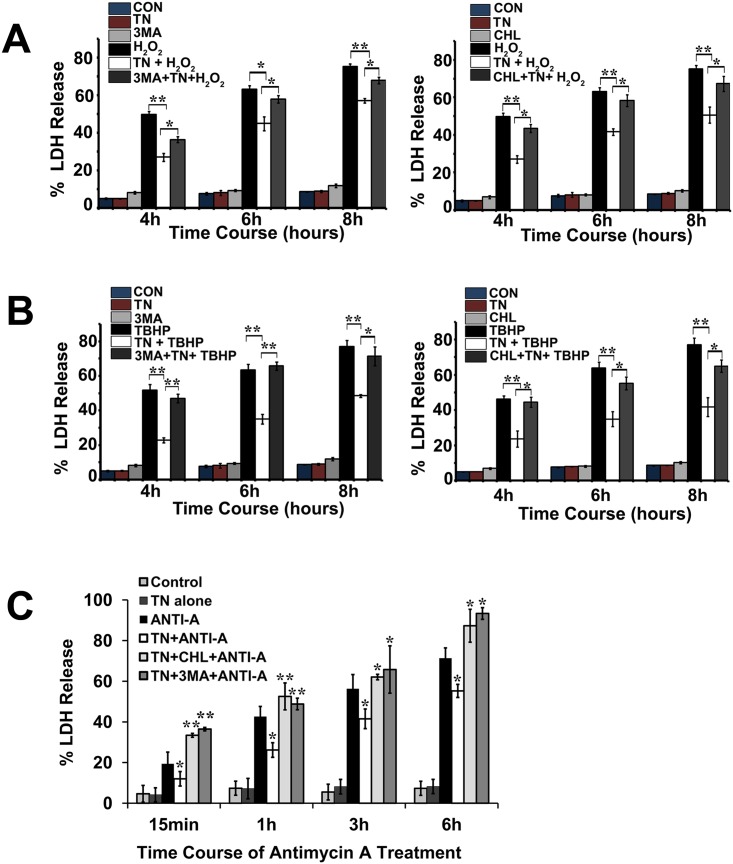
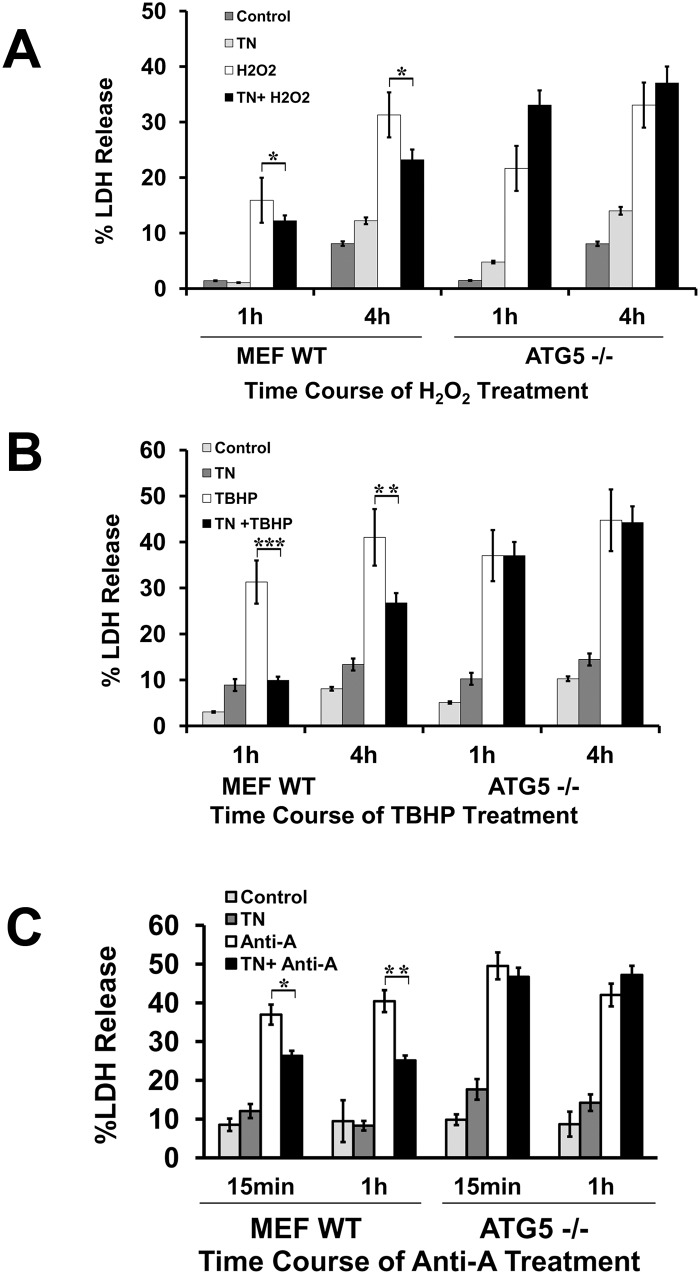
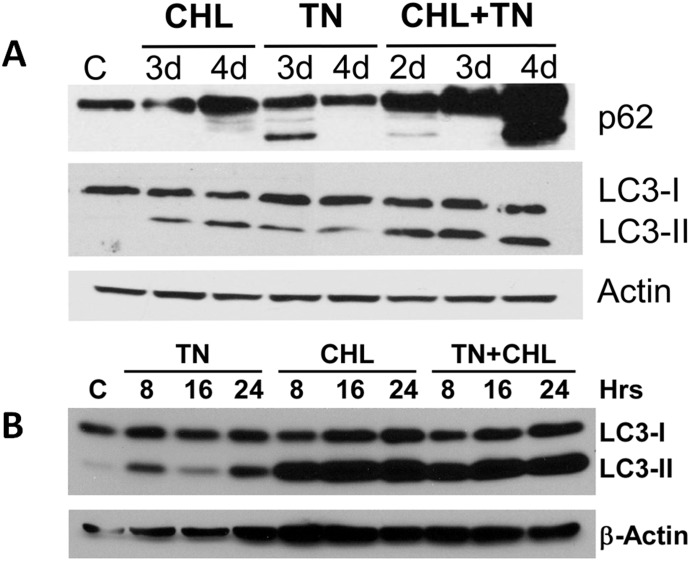
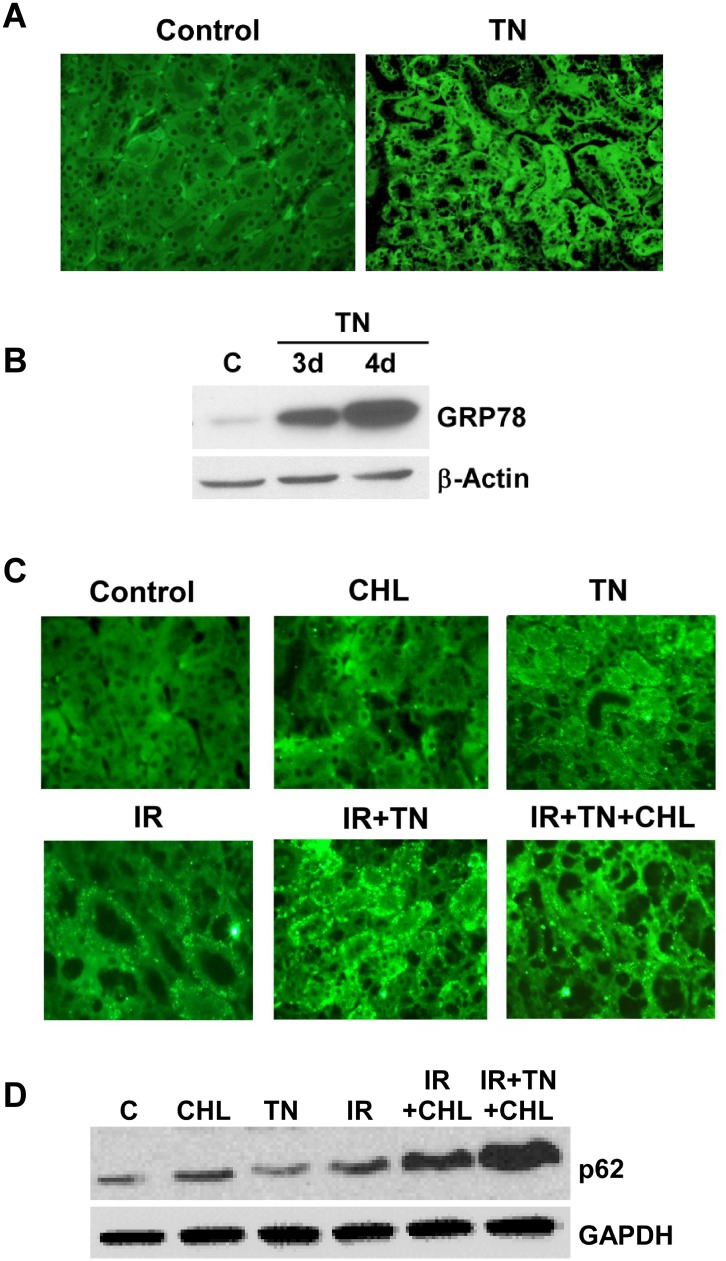
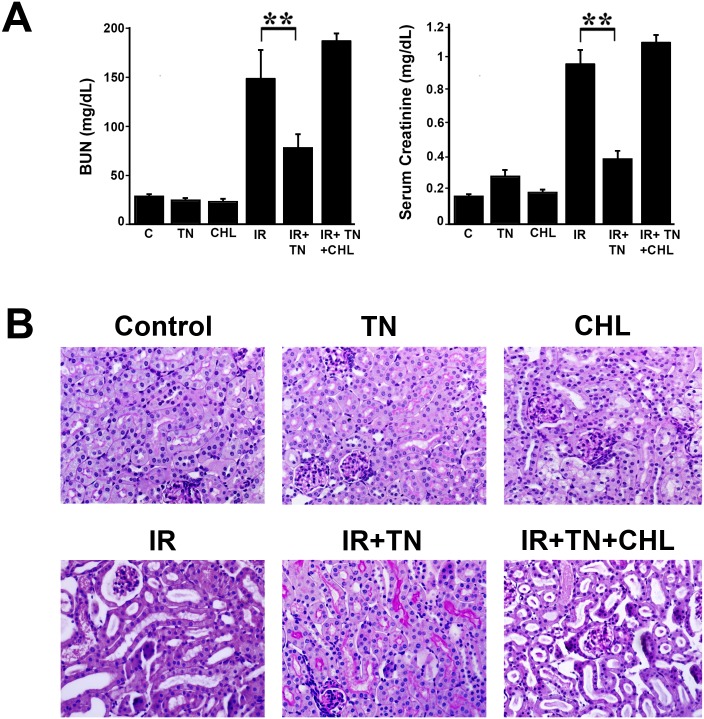
We examined whether endoplasmic reticulum (ER) stress-induced autophagy provides cytoprotection from renal tubular epithelial cell injury due to oxidants and chemical hypoxia in vitro, as well as from ischemia-reperfusion (IR) injury in vivo. We demonstrate that the ER stress inducer tunicamycin triggers an unfolded protein response, upregulates ER chaperone Grp78, and activates the autophagy pathway in renal tubular epithelial cells in culture. Inhibition of ER stress-induced autophagy accelerated caspase-3 activation and cell death suggesting a pro-survival role of ER stress-induced autophagy. Compared to wild-type cells, autophagy-deficient MEFs subjected to ER stress had enhanced caspase-3 activation and cell death, a finding that further supports the cytoprotective role of ER stress-induced autophagy. Induction of autophagy by ER stress markedly afforded cytoprotection from oxidants H2O2 and tert-Butyl hydroperoxide and from chemical hypoxia induced by antimycin A. In contrast, inhibition of ER stress-induced autophagy or autophagy-deficient cells markedly enhanced cell death in response to oxidant injury and chemical hypoxia. In mouse kidney, similarly to renal epithelial cells in culture, tunicamycin triggered ER stress, markedly upregulated Grp78, and activated autophagy without impairing the autophagic flux. In addition, ER stress-induced autophagy markedly ameliorated renal IR injury as evident from significant improvement in renal function and histology. Inhibition of autophagy by chloroquine markedly increased renal IR injury. These studies highlight beneficial impact of ER stress-induced autophagy in renal ischemia-reperfusion injury both in vitro and in vivo.


Conflict of interest statement

Competing Interests: The authors have declared that no competing interests exist.

Figures

Fig 1
Fig 1. Induction of ER stress, UPR response, and autophagy by the pharmacological ER stress inducers tunicamycin and thapsigargin.
A. LLC-PK1 cells were treated with 1 μg/ml tunicamycin (TN) for varying lengths of time as indicated. Cell lysates (100 μg protein per lane) were analyzed by western blot with antibodies specific to Grp78 and Chop to monitor the induction of the ER stress response. β-Actin served as a loading control. B. LLC-PK1 cells were treated with 1 μg/ml tunicamycin (TN) for varying lengths of time as indicated and cell lysates were immunoblotted for IRE1, pPERK, PERK, peIF2α, and eIF2α. β-Actin served as a loading control. C and D. LLC-PK1 cells were treated with (C) 1μg/ml tunicamycin (TN) or (D) 100 nM thapsigargin (TG) for varying times as indicated and autophagy induction was analyzed by monitoring LC3-I to LC3-II conversion by western blot. β-Actin served as a loading control. Bar graphs depict ratio of LC3 II/LC3 I quantified by densitometry. *P <0.05 compared with control untreated cells (0 h). **P <0.01 compared with control untreated cells (0 h). ***P <0.001 compared with control untreated cells (0 h). E. LLC-PK1 cells were grown on coverslips and transient transfection was carried out with a Baculovirus GFP-LC3 vector for 16 h. Treatments with 1 μg/ml tunicamycin (TN) or 100 nM thapsigargin (TG) were performed for different time points as indicated. Cells were fixed after each time points and images were captured using an Olympus fluorescent microscope. Representative images reveal increased punctate formation over treatment time.
Fig 2
Fig 2. Inhibition of ER stress-induced autophagy by pharmacological inhibitors triggered caspase–3/7 activation and apoptotic cell death in LLC-PK1 cells.
A, B, and C. LLC-PK1 cells were treated with the ER stress inducer tunicamycin (TN) for 12 h before treatment with the pharmacological autophagy inhibitors 10 mM 3-MA (A), 200 nM wortmannin (Wort) (B), or 50 μg/ml chloroquine (CHL) (C) for varying lengths of time as specified. Cell lysates (25 μg protein) were used for spectrofluorimetric caspase–3/7 activity assays. Control is untreated cells. Results are presented as mean±SEM of three independent experiments. *P< 0.05 compared with control or tunicamycin-treated cells. **P <0.01 compared with tunicamycin-treated cells. ***P <0.001 compared with tunicamycin-treated cells. D. LLC-PK1 cells were treated with the ER stress inducer tunicamycin (TN) without and with the indicated autophagy inhibitors. Cell lysates (50 μg protein) were processed for western blots to detect active caspase–3 using a cleaved caspase-3-specific antibody. β-actin served as a loading control. E and F. LLC-PK1 cells were treated with the ER stress inducer tunicamycin (1 μg/ml) for 12 h before treatment with 10 mM 3-MA (E) or 50 μg/ml chloroquine (F) for varying lengths of time as specified. The percentage of apoptotic cells under these treatments were determined by FACS analysis using the propidium iodide staining method. Results are represented as mean±SEM of three independent experiments. *P< 0.05 compared with control or tunicamycin-treated cells. **P <0.01 compared with tunicamycin-treated cells. ***P <0.001 compared with tunicamycin-treated cells.
Fig 3
Fig 3. Silencing of Atg5 and beclin–1 by siRNA in renal cells and Atg5-KO MEFs triggered caspase activation upon tunicamycin treatment.
A. LLC-PK1 cells were untreated (Con) or transfected with Atg5 or beclin–1 siRNAs or scrambled siRNA for 24 h as described in Materials and Method section and the cell lysates were immunoblotted for Atg5 and beclin–1. Protein levels were quantified by densitometry. siRNA-mediated silencing was evaluated as the ratio of beclin or Atg5 to β-Actin relative to untreated (Con) cells set to 1. The relative ratio for each treatment is indicated below each lane. B. LLC-PK1 cells silenced with Atg5 or beclin–1 siRNAs were treated with 1μg/ml tunicamycin for 12h, 16h, and 24h and caspase–3/7 activity assays were performed using a fluorogenic substrate. Results represented as mean±SEM of three independent experiments. *P < 0.05, **P<0.01, and ***P <0.001 shown are compared with scrambled siRNA-treated cells. C. Wild-type and Atg5-KO MEFs were treated with the ER stress inducer tunicamycin (1 μg/ml) for 16h, 24h, and 30h. Cell lysates (25 μg protein) were taken for spectrofluorimetric caspase–3/7 activity assays. Control is vehicle-treated cells. Results are presented as mean±SEM of three independent experiments. *P < 0.05, **P<0.01, and ***P <0.001 shown are compared with WT tunicamycin-treated MEFs. D. Wild-type and Atg5-KO MEFs were treated with the ER stress inducer tunicamycin (1μg/ml) for 16h, 24h, and 30h. Cell lysates (50 μg protein) were used for western blot using a specific antibody to active caspase–3. β-actin was used as a loading control. The results shown are representative of three independent experiments. E. Wild-type and Atg5-KO MEFs were treated with the ER stress inducer tunicamycin (1μg/ml) for 24h. Fragmented and condensed nuclei as well as cell shrinkage, as morphological feature of apoptosis, were measured using DAPI staining in four independent experiments. Quantification of apoptosis is shown (right). *P < 0.05 shown is compared with WT tunicamycin-treated MEFs.
Fig 4
Fig 4. Tunicamycin pretreatment protects renal epithelial cells from oxidant injury and chemical hypoxia and protection is reversed when treated with autophagy inhibitors.
A. LLC-PK1 cells were pretreated with 1 μg/ml tunicamycin (TN) for 12 h before a one hour treatment with 10 mM 3-MA (left) or 50 μg/ml chloroquine (CHL) (right) followed by 200 μM H202 for different time durations as indicated. LDH release assays were carried out as an indicator of cytotoxicity. Results represent mean±SEM of four independent experiments. *P < 0.05 compared with tunicamycin +H202-treated cells. **P < 0.01 compared with H202-treated cells. B. LLC-PK1 cells were pretreated with 1 μg/ml tunicamycin (TN) for 12 h before a one hour treatment with 10 mM 3-MA (left) or 50 μg/ml chloroquine (CHL) (right) followed by 50 μM TBHP for different time durations as indicated. LDH release assay was carried out as an indicator of cytotoxicity. Results represent mean±SEM of four independent experiments. *P <0.05 compared with TBHP+tunicamycin-treated cells. **P < 0.01 compared with TBHP or tunicamycin+TBHP-treated cells. C. LLC-PK1 cells were pretreated with 1 μg/ml tunicamycin (TN) for 12 h before a one hour treatment with 10 mM 3-MA or 50 μg/ml chloroquine followed by 10 μM antimycin A (ANTI-A)for time durations indicated. LDH release assay was carried out as an indicator of cytotoxicity. Results are expressed as mean±SEM of four different experiments. *P<0.05 compared with antimycin A or antimycin + TN-treated cells. **P<0.01 compared with TN+antimycin A-treated cells.
Fig 5
Fig 5. Tunicamycin pretreatment protects Atg5-KO MEFs from oxidant injury and chemical hypoxia compared to wild-type MEFs.
A. Wild-type and Atg5-KO MEFs were pretreated with 1 μg/ml tunicamycin for 12 h before treatment with 200 μM H2O2. H2O2 treatment was given in the time durations indicated. LDH release assay was carried out as an indicator of cytotoxicity. Results are indicated as means of three independent experiments. *P<0.05 compared with H2O2-treated cells. B. Wild-type and Atg5-KO MEFs were pretreated with 1 μg/ml tunicamycin for 12 h before treatment with 50 μM TBHP. TBHP treatment was given in the time durations indicated. LDH release assay was carried out as an indicator of cytotoxicity. Results represent means of three independent experiments. **P<0.01, and ***P <0.001 compared TBHP-treated cells. C. Wild-type and Atg5-KO MEFs were pretreated with 1 μg/ml tunicamycin for 12 h before treatment with 10 uM antimycin A. Antimycin A treatment was given in the time durations indicated. LDH release assay was carried out as an indicator of cytotoxicity. Results represent means±SEM of three independent experiments. *P<0.05 and **P<0.01 compared with antimycin A-treated cells.
Fig 6
Fig 6. Tunicamycin treatment does not impair autophagic flux in renal cells and kidney.
A. Kidney tissue obtained from mice treated with 1 mg/kg b.w. tunicamycin alone, 50 mg/kg (b. w.)/day chloroquine alone or tunicamycin + chloroquine for 2d, 3d, and 4d or vehicle (30% DMSO + 70% saline) for 4d was homogenized with lysis buffer containing protease inhibitors. Tissue lysate (50 μg protein) was subjected to western blot analysis using specific antibodies to p62, LC3, and β-actin. β-actin was used as a loading control. The results shown are representative of three independent experiments. B. LLC-PK1 cells were treated with 1μg/ml tunicamycin (TN), chloroquine (CHL), and tunicamycin + chloroquine for 8 h, 16h, and 24 h. Cell lysates (50 μg protein) were subjected to western blot using specific antibodies to LC3 and β-actin. β-actin was served as a loading control. The results shown are representative of three independent experiments.
Fig 7
Fig 7. Induction of Grp78 in response to tunicamycin administration and activation of autophagy in the kidney and during renal ischemia-reperfusion injury.
A. Kidneys from mice treated with tunicamycin (TN) or vehicle (30% DMSO + 70% saline) for 48 hours were processed for immunofluorescence staining as described in Methods. Deparaffinized 5 μm sections were immunostained with a polyclonal rabbit Grp78 antibody followed with an anti-rabbit Alexafluor-488-labeled secondary antibody and images were recorded using an Olympus BX51 fluorescence microscope (40x magnification). The results represent three independent experiments. B. Kidney tissue from mice treated with tunicamycin (TN) or vehicle (30% DMSO + 70% saline) for 48 hours was homogenized with lysis buffer containing protease inhibitors. Tissue lysate (50 μg protein) was subjected to western blot analysis using antibodies to Grp78 and β-actin. β-actin was used as a loading control. The results represent three independent experiments. C. Mice were treated with tunicamycin or vehicle (30% DMSO +70% saline) for 48 hours and then were subjected to IR. Chloroquine was administered i.p. one hour before IR surgery. Kidneys were processed for immunofluorescent staining as described in Methods. Deparaffinized 5 μm sections were immunostained with polyclonal rabbit anti-LC3 followed with anti-rabbit Alexafluor-488-labeled secondary antibody and pictures recorded on an Olympus BX51 fluorescence microscope at 40x magnification. The results represent three independent experiments. D. Mice were treated with tunicamycin or vehicle (30% DMSO +70% saline) for 48 hours and then were subjected to IR. Chloroquine was administered i.p. one hour before IR surgery. Kidney tissue lysates were subjected to western blot analysis using antibody to p62. GAPDH was used as a loading control. The results represent three independent experiments.
Fig 8
Fig 8. Prior ER stress-induced autophagy ameliorates renal ischemia-reperfusion injury.
A. Mice were administered 1 mg/kg b.w. tunicamycin (TN) or vehicle (30% DMSO + 70% saline) for 2 d before being subjected to IR injury. For inhibition of autophagy, 50 mg/kg/day chloroquine (CHL) was administered 1 h before ischemia. At the indicated times BUN and serum creatinine were determined. The results are expressed as mean±SEM, n = 5, **P<0.01 for BUN compared with IR alone and **P<0.01for serum creatinine compared with IR alone. B. Renal histology in response to vehicle (control), tunicamycin (3d TN), chloroquine (3d CHL), ischemia-reperfusion (IR for 1d), IR+TN, and IR+TN+CHL Kidney sections were stained with PAS staining. The results represent three independent experiments.

Similar articles

Cited by

References

    1. Klionsky DJ (2007) Autophagy: from phenomenology to molecular understanding in less than a decade. Nat Rev Mol Cell Biol 8: 931–937. - PubMed
    1. Weidberg H, Shvets E, Elazar Z (2011) Biogenesis and cargo selectivity of autophagosomes. Annu Rev Biochem 80: 125–156. 10.1146/annurev-biochem-052709-094552 - DOI - PubMed
    1. He C, Klionsky DJ (2009) Regulation mechanisms and signaling pathways of autophagy. Annu Rev Genet 43: 67–93. 10.1146/annurev-genet-102808-114910 - DOI - PMC - PubMed
    1. Xie Z, Klionsky DJ (2007) Autophagosome formation: core machinery and adaptations. Nat Cell Biol 9: 1102–1109. - PubMed
    1. Kroemer G, Levine B (2008) Autophagic cell death: the story of a misnomer. Nat Rev Mol Cell Biol 9: 1004–1010. 10.1038/nrm2529 - DOI - PMC - PubMed

Publication types

MeSH terms