. 2016 Jan;89(1):68-81.
doi: 10.1038/ki.2015.293. Epub 2016 Jan 4.

Src inhibition blocks renal interstitial fibroblast activation and ameliorates renal fibrosis

Affiliations

Src inhibition blocks renal interstitial fibroblast activation and ameliorates renal fibrosis

Yanli Yan et al. Kidney Int. 2016 Jan.

Expression of concern in

Abstract

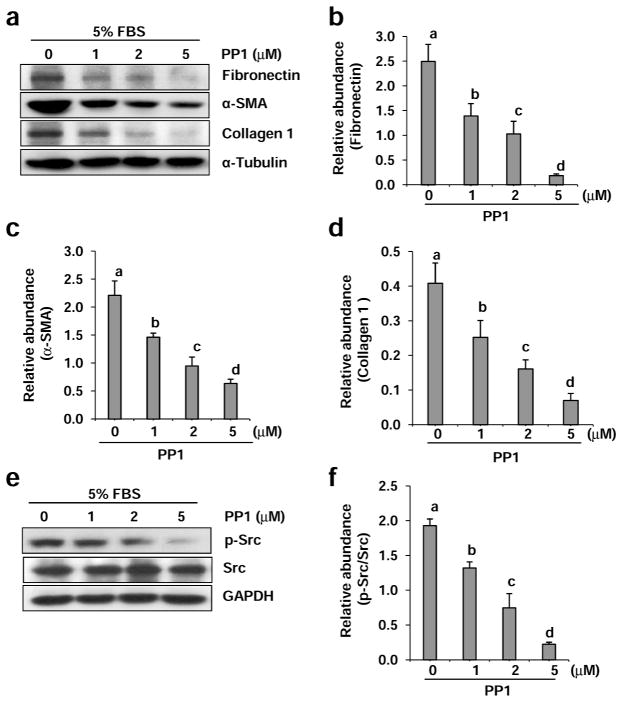
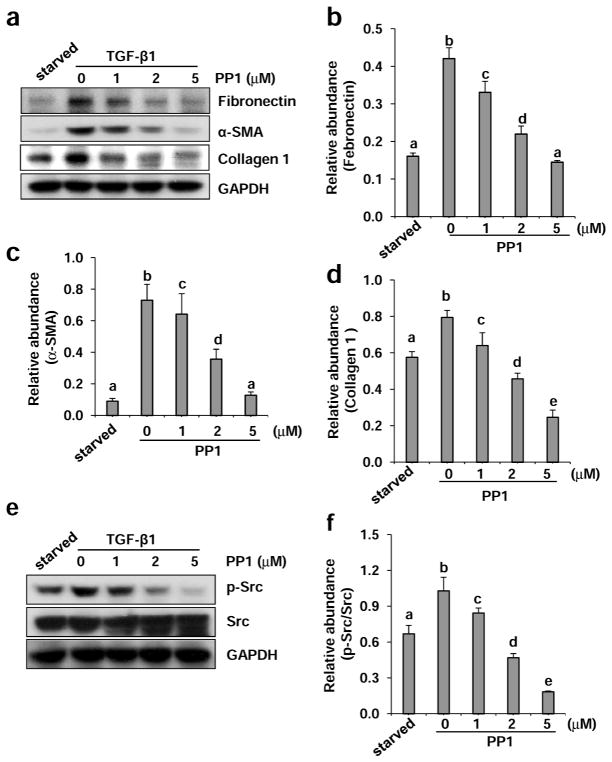
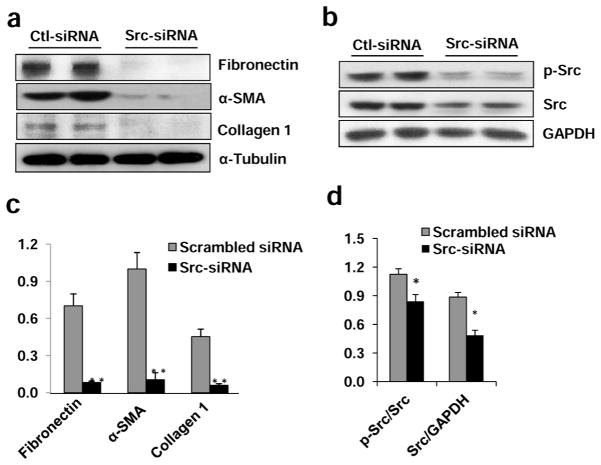
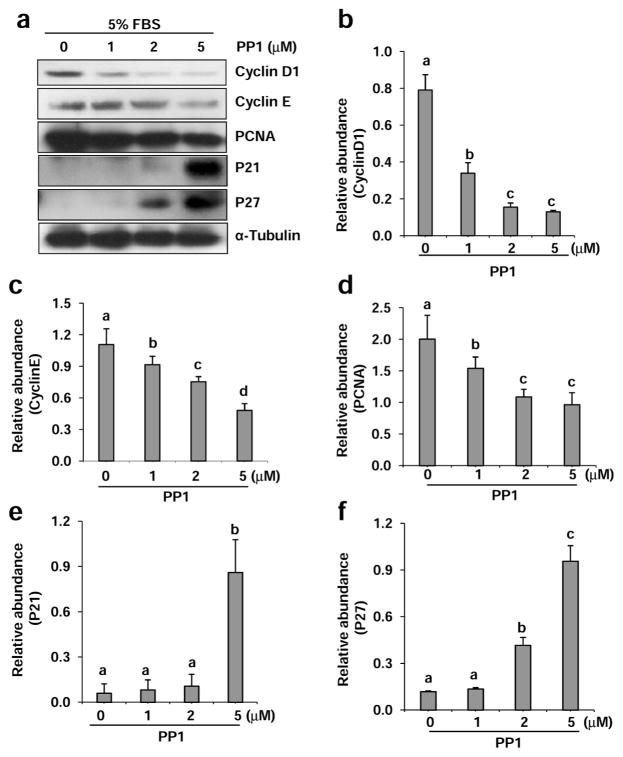
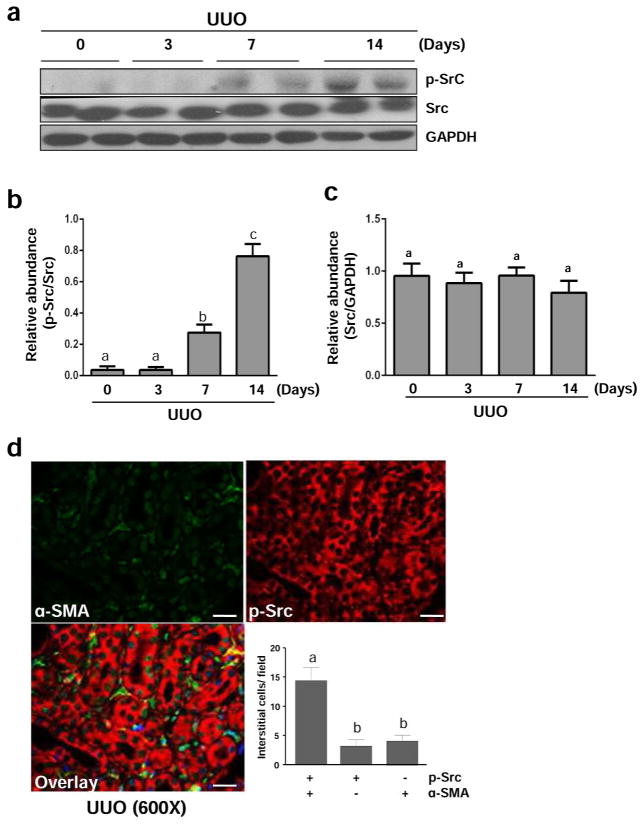
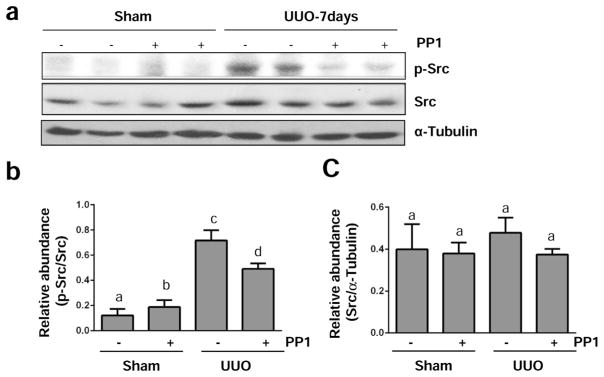
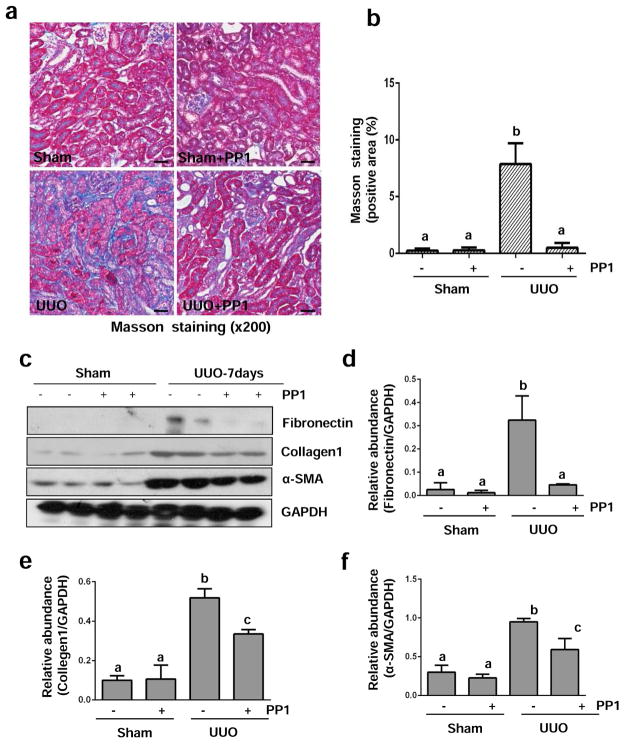
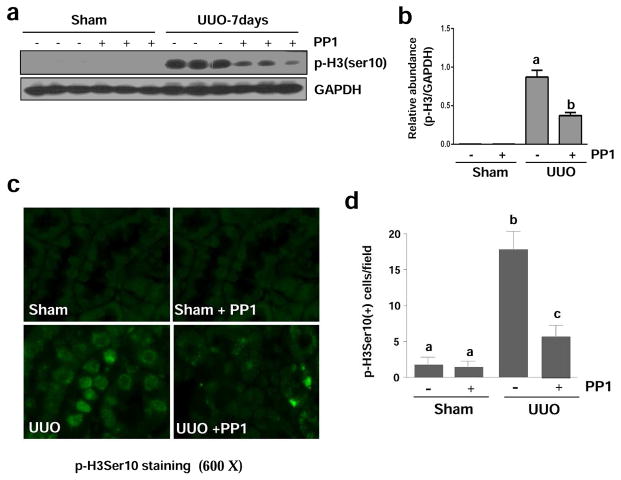
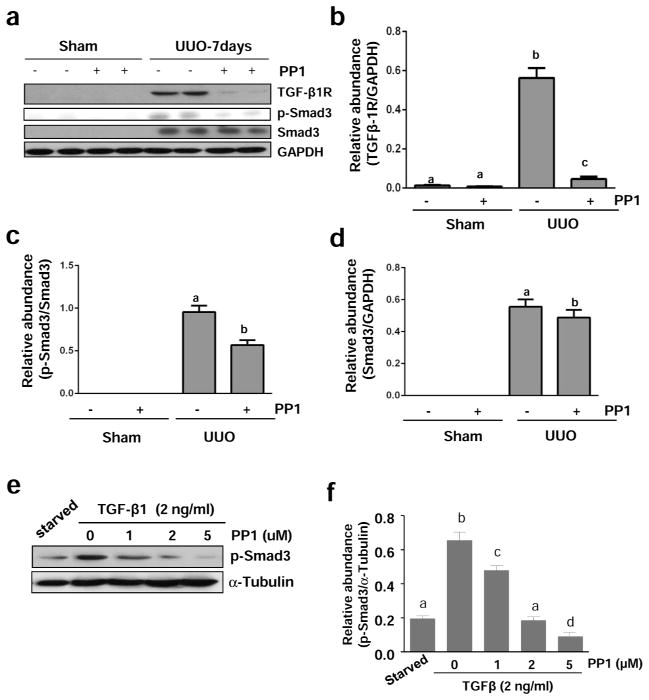
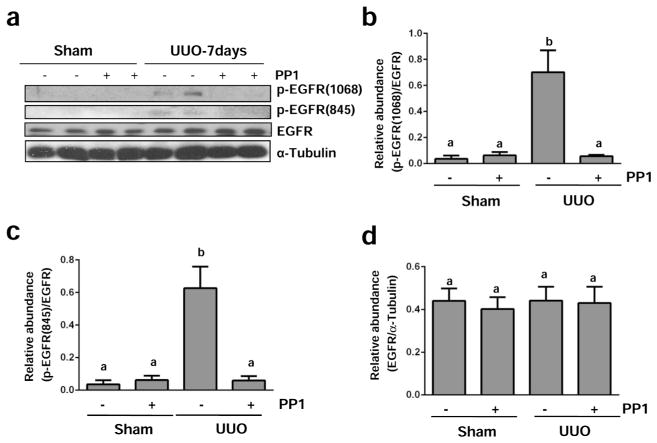
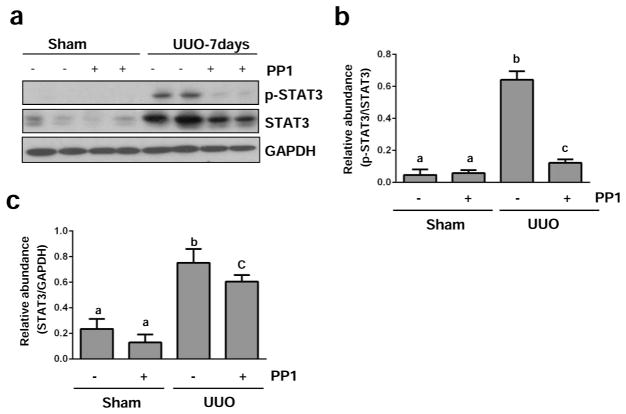
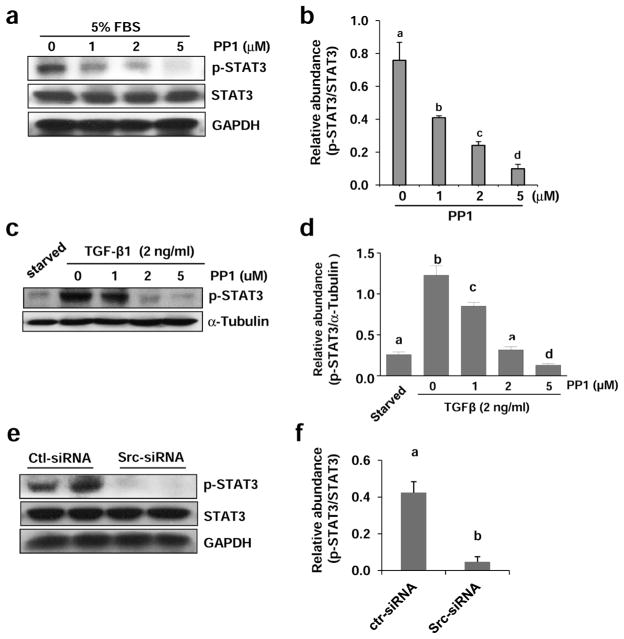
Increased Src activity has been associated with the pathogenesis of renal tumors and some glomerular diseases, but its role in renal interstitial fibrosis remains elusive. To evaluate this, cultured renal interstitial fibroblasts (NRK-49F) were treated with PP1, a selective inhibitor of Src. This resulted in decreased expression of α-smooth muscle actin, fibronectin, and collagen I in response to serum, angiotension II, or transforming growth factor-β1 (TGF-β1). Silencing Src with siRNA also inhibited expression of those proteins. Furthermore, inhibition of Src activity blocked renal fibroblast proliferation. In a murine model of renal interstitial fibrosis induced by unilateral ureteral obstruction, the active form of Src (phopsho-Src Tyr416) was upregulated in both renal interstitial fibroblasts and renal tubular cells of the fibrotic kidney. Its inactivation reduced renal fibroblast activation and attenuated extracellular matrix protein deposition. Src inhibition also suppressed activation of TGF-β1 signaling, activation of the epidermal growth factor receptor and STAT3, and reduced the number of renal epithelial cells arrested at the G2/M phase of the cell cycle after ureteral obstruction. Thus, Src is an important mediator of renal interstitial fibroblast activation and renal fibrosis, and we suggest that Src is a potential therapeutic target for treatment of chronic renal fibrosis.

Keywords: Src; epidermal growth factor receptor; renal fibrogenesis; renal interstitial fibroblasts; transforming growth factor-β1; α-smooth muscle actin.


Figures

Figure 1
Figure 1. Inhibition of Src with PP1 inhibits expression of fibronectin, α-SMA, and collagen 1 in cultured renal interstitial fibroblasts
Cells were incubated in complete medium containing 5% FBS and were exposed to PP1 (1, 2, and 5 μM) for 24 h. Cell lysates were subject to immunoblot analysis with antibodies to Collagen 1, α-SMA, fibronectin, or α-Tubulin (a) and phospho-Src (Tyr416), Src and glyceroldehyde-3-phosphate dehydrogenase (GAPDH) (e). Representative immunoblots from three or more experiments are shown. Expression levels of indicated proteins were quantified by densitometry and normalized with α-Tubulin (b, c, d) or GAPDH (f). Data are represented as the mean ± SEM. Bars with different letters (a–d) are significantly different from one another (P<0.05).
Figure 2
Figure 2. Inhibition of Src with PP1 reduces TGF-β 1-induced expression of collagen 1, α-SMA, and fibronectinin cultured renal interstitial fibroblasts
Serum-starvedNRK-49F cells were incubated with 2 ng/ml TGF-β1 for 24 h in the presence of PP1 (1, 2, and 5 μM). Cell lysates were subject to immunoblot analysis with antibodies to collagen 1, α-SMA, fibronectin, or GAPDH (a), and phospho-Src (Tyr416), Src, and GAPDH (e). Representative immunoblots from three or more experiments are shown. Expression levels of indicated proteins were quantified by densitometry and normalized with GAPDH (b, c, d, f). Data are represented as the mean ± SEM. Bars with different letters (a–e) are significantly different from one another (P<0.05).
Figure 3
Figure 3. Silencing of Src with siRNA inhibits expression of fibronectin, α-SMA and collagen 1 in cultured renal interstitial fibroblasts
NRK-49F cells were transfected with scrambled siRNA or siRNA specific to Src and incubated for 48 h in DMEM-F12 with 5% FBS. Cells were harvested and cell lysates were subjected to immunoblot analysis (a, b). Representative immunoblots from three or more experiments are shown. Expression levels of indicated proteins were quantified by densitometry. Collagen 1, α-SMA, and fibronectin were normalized with α-Tubulin (c). The phospho-Src and Src were normalized with Src and GAPDH, respectively (d). Data are represented as the mean ± SEM. Bars with * (P< 0.05) or ** (P< 0.01) are significantly different from controls.
Figure 4
Figure 4. Inhibition of Src with PP1 alters expression of cycle proteins in renal interstitial fibroblasts
Cells were incubated in complete medium containing 5% FBS and were exposed to PP1 (1, 2, 5 μM). Cell lysates were subject to immunoblot analysis with antibodies to Cyclin D1, Cyclin E, PCNA, p21, p27 or α-Tubulin. Representative immunoblots from three or more experiments are shown (a). Expression levels of indicated proteins were quantified by densitometry and normalized with α-Tubulin (b–f). Data are represented as the mean ± SEM. Bars with different letters (a–d) are significantly different from one another (P<0.05). Scale bar=50 μM
Figure 5
Figure 5. Src is activated in the kidney after UUO injury
The left ureter was ligated for 3, 7, and 14 days. The kidneys were taken for immunoblot analysis of phospho-Src (Tyr-416) (p-Src), Src, GAPDH as indicated (a). Representative immunoblots from 3 experiments are shown. Expression levels of p-Src and Src were quantified by densitometry and normalized with GAPDH as indicated (b, c). Photomicrographs illustrate immunoflurecent staining of kidney tissue taken from the kidney subjected to UUO for 7 days with the antibodies to p-Src and α-SMA (600 x). The number of interstitial cells expressing p-Src, α-SMA, or p-Src + α-SMA were accounted respectively (d). Data are represented as the mean ± SEM (n=6). Bars with different letters (a–c) are significantly different from one another (P<0.05). Scale bar=20 μM.
Figure 6
Figure 6. PP1 inhibits UUO injury –induced activation of Src in the kidney
The left ureter was ligated for 7 days (a–c) with or without treatment of PP1 (2 mg/kg). The kidneys were taken for immunoblot analysis of phospho-Src (Tyr-416), Src, or α-tubulin as indicated (a). Representative immunoblots from 3 experiments are shown. Expression levels of phospho-Src and Src were quantified by densitometry and normalized with α-tubulin as indicated (b, c). Data are represented as the mean ± SEM (n=6). Bars with different letters (a–d) are significantly different from one another (P<0.05).
Figure 7
Figure 7. Src inhibition blocks the deposition of ECM and development of fibrosis in obstructed kidneys
(a) Photomicrographs illustrate Masson trichrome staining of kidney tissue after treatment with or without PP1 for 7 days. (b) The Masson trichrome-positive tubulointerstitial area (blue) relative to the whole area from 10 random cortical fields (200 X) was analyzed. Data are represented as the mean ± SEM. Means with different superscript letters are significantly different from one another (P< 0.05). (c) Kidney tissue lysates were subjected to immunoblot analysis with antibodies against fibronectin, collagen 1, α-SMA, or GAPDH. The levels of these proteins were quantified by densitometry and normalized with GAPDH (d–f). Values are means ± SEM (n=6). Bars with different letters (a–c) are significantly different from one another (P<0.05). Scale bar=50 μM
Figure 8
Figure 8. Src inhibition attenuates renal expression of p-Histone H3 (Ser 10) in mice after UUO injury
Lysates of kidney tissue collected at day 7 after sham and UUO injury with or without PP1 were subject to immunoblot analysis with specific antibodies against p-Histone H3 (ser 10) or GAPDH (a). Expression levels of p-Histone H3 were quantified by densitometry and normalized with GAPDH (b). Photomicrographs illustrate staining of H3Ser10 in the tissue section of the kidney after treatments as indicated (c). The tubular cells with positive staining of H3Ser10 were calculated in 10 high-power fields and expressed as means ± SEM (d). Data are represented as the mean ± SEM. Bars with different letters (a–c) are significantly different from one another (P<0.05). Scale bar=20 μM.
Figure 9
Figure 9. Src inhibition blocks TGF-β 1 expression and Smad-3 phosphorylation in the kidney after UUO injury
The kidneys were collected at day 7 after sham and UUO injury with or without PP1 (a). NRK-49F cells were harvested after treatment with TGF-β1 (2 ng/ml) for 24 hours in the absence or presence of PP1 (e). Tissue or cell lysates were subject to immunoblot analysis with specific antibodies against TGF-β1, GAPDH (a), phospho-Smad3, and Smad3 (a, e) or α-Tubulin. Expression levels of indicated proteins were quantified by densitometry and normalized with GAPDH (b–d) or α-Tubulin (f). Data are represented as the mean ± SEM. Bars with different letters (a–d) are significantly different from one another (P<0.05).
Figure 10
Figure 10. Src inhibition blocks EGFR phosphorylation in the kidney after UUO injury
Lysates of kidney tissue collected at day 7 after sham and UUO injury with or without PP1 were subject to immunoblot analysis with specific antibodies against phospho-EGFR (Tyr1068), phospho-EGFR (Tyr845), total EGFR or α-Tubulin (a). Expression levels of indicated proteins were quantified by densitometry; phosphorylated EGFR Tyr1068 and Tyr845 were normalized with total EGFR and total EGFR was normalized with α-Tubulin (b–d). Data are represented as the mean ± SEM. Bars with different letters (a–b) are significantly different from one another (P<0.05).
Figure 11
Figure 11. Src inhibition blocks STAT3 phosphorylation in the kidney after UUO injury
Lysates of kidney tissue collected at day 7 after sham and UUO injury with or without PP1 were subject to immunoblot analysis with specific antibodies against phospho-STAT3 (Tyr705), STAT3, or GAPDH (a). Expression levels of indicated proteins were quantified by densitometry; phospho-STAT3 was normalized with corresponding total protein, and total STAT3 was normalized with GAPDH (b, c). Data are represented as the mean ± SEM. Bars with different letters (a–c) are significantly different from one another (P<0.05).
Figure 12
Figure 12. Inhibition of Src with PP1 inhibits phosphorylation of STAT3 in cultured renal interstitial fibroblasts
NRK-49F cells were cultured in the medium with 5% FBS (A, B) or 2 ng/ml TGF-β1 (c, d) were exposed to PP1 (1, 2, 5 μM) for 24 h (a) or transfected with scrambled siRNA or siRNA specific to Src and then incubated for 48 h (e, f). Cell lysates were subjected to immunoblot analysis with antibodies to phospho-STAT3 (Tyr705), STAT3, GAPDH or α-tubulin. Expression levels of indicated proteins were quantified by densitometry. Phosphorylated STAT3 was normalized with total STAT3 (b, e). Phosphorylated STAT3 was normalized with α-tubulin (d). Data are represented as the mean ± SEM. Bars with different letters (a–d) are significantly different from one another (P<0.05).

References

    1. Liu Y. Rapamycin and chronic kidney disease: beyond the inhibition of inflammation. Kidney Int. 2006;69:1925–1927. - PubMed
    1. Ruggenenti P, Cravedi P, Remuzzi G. Mechanisms and treatment of CKD. J Am Soc Nephrol. 2012;23:1917–1928. - PubMed
    1. Liu Y. Cellular and molecular mechanisms of renal fibrosis. Nat Rev Nephrol. 2011;7:684–696. - PMC - PubMed
    1. Liu N, Tolbert E, Pang M, et al. Suramin inhibits renal fibrosis in chronic kidney disease. J Am Soc Nephrol. 2011;22:1064–1075. doi:1010.1681/ASN.2010090956. - PMC - PubMed
    1. Samarakoon R, Dobberfuhl AD, Cooley C, et al. Induction of renal fibrotic genes by TGF-beta1 requires EGFR activation, p53 and reactive oxygen species. Cell Signal. 2013;25:2198–2209. - PubMed

Publication types

MeSH terms