

A Bayesian model for highly accelerated phase-contrast MRI
- PMID: 26444911
- PMCID: PMC4824680
- DOI: 10.1002/mrm.25904
A Bayesian model for highly accelerated phase-contrast MRI
Abstract
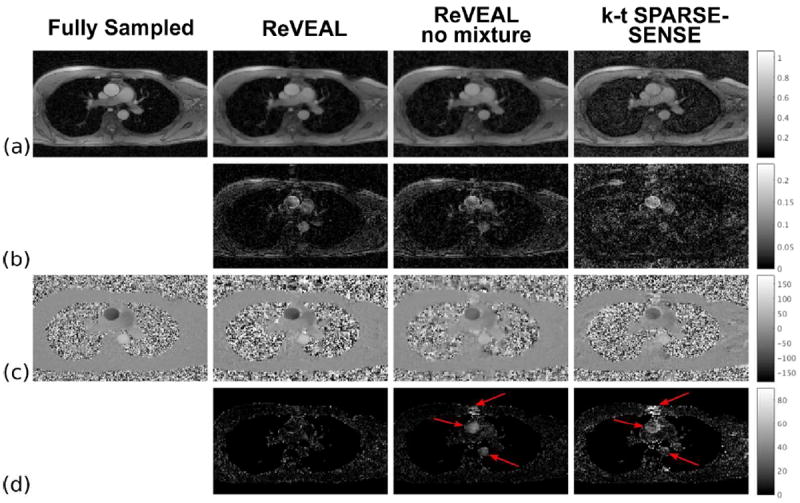
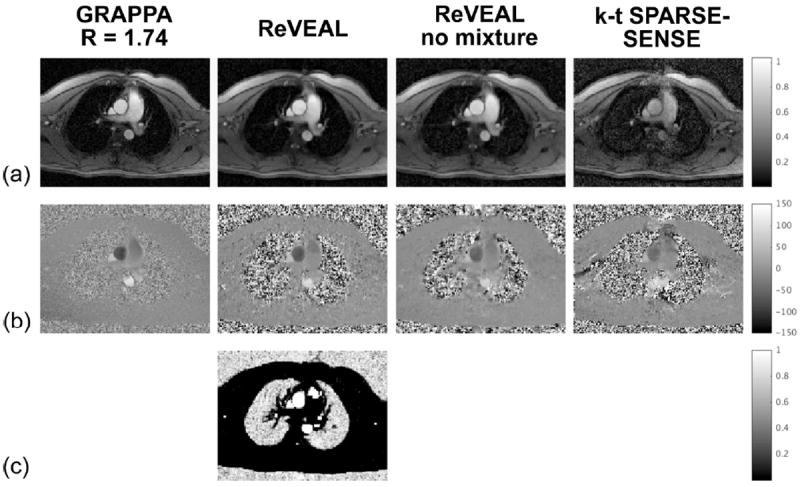
Purpose: Phase-contrast magnetic resonance imaging is a noninvasive tool to assess cardiovascular disease by quantifying blood flow; however, low data acquisition efficiency limits the spatial and temporal resolutions, real-time application, and extensions to four-dimensional flow imaging in clinical settings. We propose a new data processing approach called Reconstructing Velocity Encoded MRI with Approximate message passing aLgorithms (ReVEAL) that accelerates the acquisition by exploiting data structure unique to phase-contrast magnetic resonance imaging.
Theory and methods: The proposed approach models physical correlations across space, time, and velocity encodings. The proposed Bayesian approach exploits the relationships in both magnitude and phase among velocity encodings. A fast iterative recovery algorithm is introduced based on message passing. For validation, prospectively undersampled data are processed from a pulsatile flow phantom and five healthy volunteers.
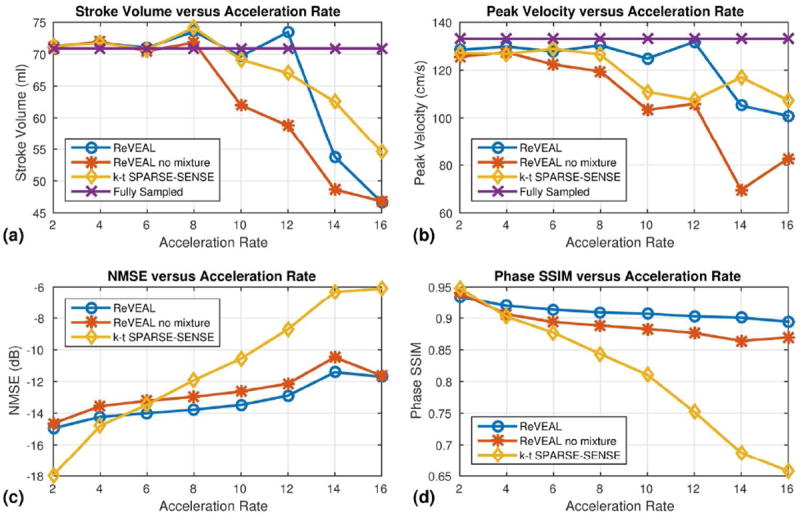
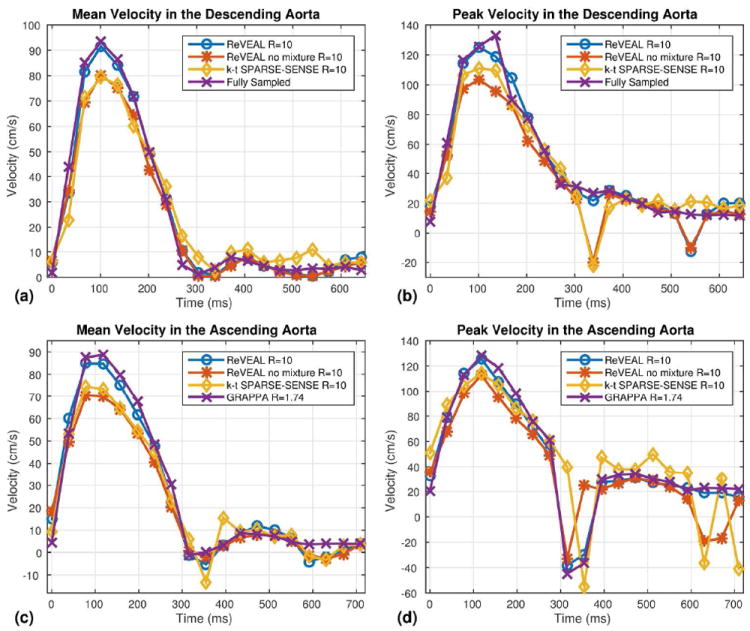
Results: The proposed approach is in good agreement, quantified by peak velocity and stroke volume (SV), with reference data for acceleration rates R≤10. For SV, Pearson r≥0.99 for phantom imaging (n = 24) and r≥0.96 for prospectively accelerated in vivo imaging (n = 10) for R≤10.
Conclusion: The proposed approach enables accurate quantification of blood flow from highly undersampled data. The technique is extensible to four-dimensional flow imaging, where higher acceleration may be possible due to additional redundancy. Magn Reson Med 76:689-701, 2016. © 2015 Wiley Periodicals, Inc.
Keywords: Bayesian inference; approximate message passing; cardiac MRI; factor graph; flow imaging; minimum mean squared error estimation; peak blood flow; velocity.
© 2015 Wiley Periodicals, Inc.
Figures
Similar articles
-
Accelerated phase contrast flow imaging with direct complex difference reconstruction.Magn Reson Med. 2017 Mar;77(3):1036-1048. doi: 10.1002/mrm.26184. Epub 2016 Mar 26. Magn Reson Med. 2017. PMID: 27016025 Free PMC article.
-
Convex gradient optimization for increased spatiotemporal resolution and improved accuracy in phase contrast MRI.Magn Reson Med. 2014 Dec;72(6):1552-64. doi: 10.1002/mrm.25059. Epub 2013 Dec 17. Magn Reson Med. 2014. PMID: 24347040
-
Phase-contrast MRI with hybrid one and two-sided flow-encoding and velocity spectrum separation.Magn Reson Med. 2017 Jul;78(1):182-192. doi: 10.1002/mrm.26366. Epub 2016 Aug 9. Magn Reson Med. 2017. PMID: 27504987 Free PMC article.
-
Phase-Contrast MRI: Physics, Techniques, and Clinical Applications.Radiographics. 2020 Jan-Feb;40(1):122-140. doi: 10.1148/rg.2020190039. Radiographics. 2020. PMID: 31917664 Review.
-
Susceptibility-weighted imaging: clinical angiographic applications.Magn Reson Imaging Clin N Am. 2009 Feb;17(1):47-61. doi: 10.1016/j.mric.2008.12.002. Magn Reson Imaging Clin N Am. 2009. PMID: 19364599 Free PMC article. Review.
Cited by
-
CArtesian sampling with Variable density and Adjustable temporal resolution (CAVA).Magn Reson Med. 2020 Jun;83(6):2015-2025. doi: 10.1002/mrm.28059. Epub 2019 Nov 12. Magn Reson Med. 2020. PMID: 31721303 Free PMC article.
-
MAXIMIZING UNAMBIGUOUS VELOCITY RANGE IN PHASE-CONTRAST MRI WITH MULTIPOINT ENCODING.Proc IEEE Int Symp Biomed Imaging. 2022 Mar;2022:10.1109/isbi52829.2022.9761589. doi: 10.1109/isbi52829.2022.9761589. Epub 2022 Apr 26. Proc IEEE Int Symp Biomed Imaging. 2022. PMID: 35646241 Free PMC article.
-
Multipoint 5D flow cardiovascular magnetic resonance - accelerated cardiac- and respiratory-motion resolved mapping of mean and turbulent velocities.J Cardiovasc Magn Reson. 2019 Jul 22;21(1):42. doi: 10.1186/s12968-019-0549-0. J Cardiovasc Magn Reson. 2019. PMID: 31331353 Free PMC article.
-
Divergence-Free Constrained Phase Unwrapping and Denoising for 4D Flow MRI Using Weighted Least-Squares.IEEE Trans Med Imaging. 2021 Dec;40(12):3389-3399. doi: 10.1109/TMI.2021.3086331. Epub 2021 Nov 30. IEEE Trans Med Imaging. 2021. PMID: 34086567 Free PMC article.
-
A bayesian method for accelerated magnetic resonance elastography of the liver.Magn Reson Med. 2018 Sep;80(3):1178-1188. doi: 10.1002/mrm.27083. Epub 2018 Jan 15. Magn Reson Med. 2018. PMID: 29334131 Free PMC article.
References
-
- Kondo C, Caputo GR, Semelka R, Foster E, Shimakawa A, Higgins CB. Right and left ventricular stroke volume measurements with velocity-encoded cine MR imaging: in vitro and in vivo validation. Am J of Roentgenology. 1991;157(1):9–16. - PubMed
-
- Uren NG, Melin JA, De Bruyne B, Wijns W, Baudhuin T, Camici PG. Relation between myocardial blood flow and the severity of coronary-artery stenosis. New Eng J Med. 1994;330:1782–1788. - PubMed
-
- Kieran R. O’Brien et al. MRI phase contrast velocity and flow errors in turbulent stenotic jets. J of Magn Reson Imaging. 2008;28:210–218. - PubMed
-
- Debl K, Djavidani B, Buchner S, Heinicke N, Poschenrieder F, Feuerbach S, Riegger G, Luchner A. Quantification of left-to-right shunting in adult congenital heart disease: phase-contrast cine MRI compared with invasive oximetry. Br J Radiol. 2009;82(977):386–391. - PubMed
Publication types
MeSH terms
Grants and funding
LinkOut - more resources
Full Text Sources
Other Literature Sources
