. 2015 Oct 6:8:106.
doi: 10.1186/s13045-015-0209-2.

PTTG1 expression is associated with hyperproliferative disease and poor prognosis in multiple myeloma

Affiliations

PTTG1 expression is associated with hyperproliferative disease and poor prognosis in multiple myeloma

Jacqueline E Noll et al. J Hematol Oncol. .

Abstract

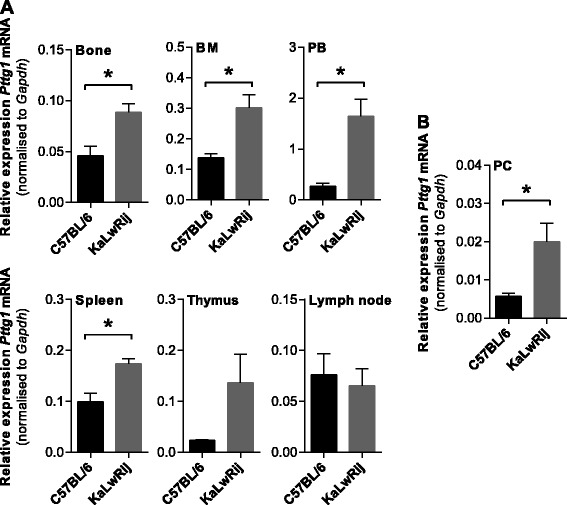
Background: Multiple myeloma (MM) is an incurable haematological malignancy characterised by the clonal proliferation of malignant plasma cells within the bone marrow. We have previously identified pituitary tumour transforming gene 1 (Pttg1) as a gene that is significantly upregulated in the haematopoietic compartment of the myeloma-susceptible C57BL/KaLwRij mouse strain, when compared with the myeloma-resistant C57BL/6 mouse. Over-expression of PTTG1 has previously been associated with malignant progression and an enhanced proliferative capacity in solid tumours.

Methods: In this study, we investigated PTTG1 gene and protein expression in MM plasma cells from newly diagnosed MM patients. Gene expression profiling was used to identify gene signatures associated with high PTTG1 expression in MM patients. Additionally, we investigated the effect of short hairpin ribonucleic acid (shRNA)-mediated PTTG1 knockdown on the proliferation of the murine myeloma plasma cell line 5TGM1 in vitro and in vivo.

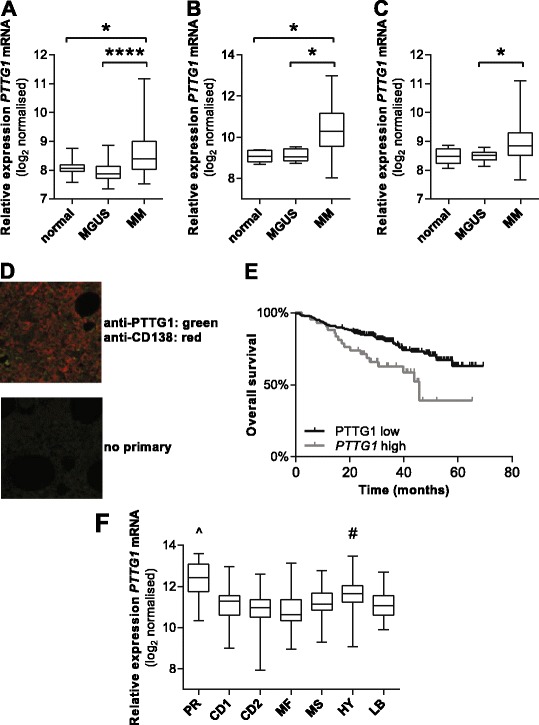
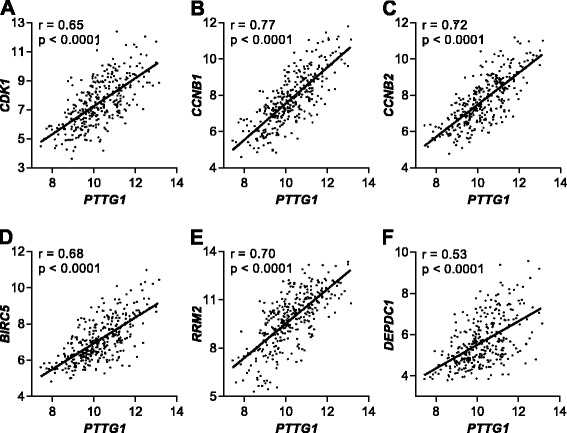
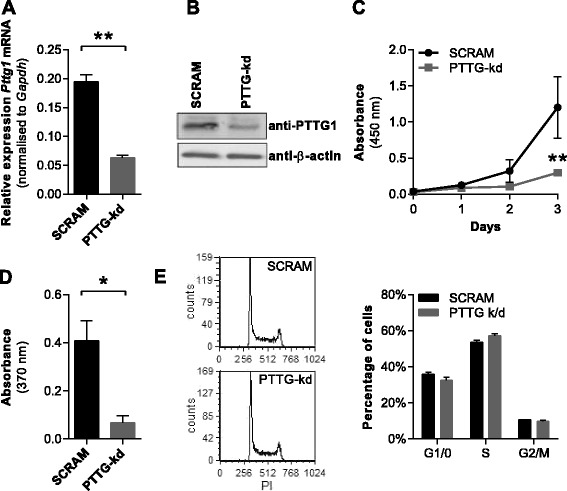
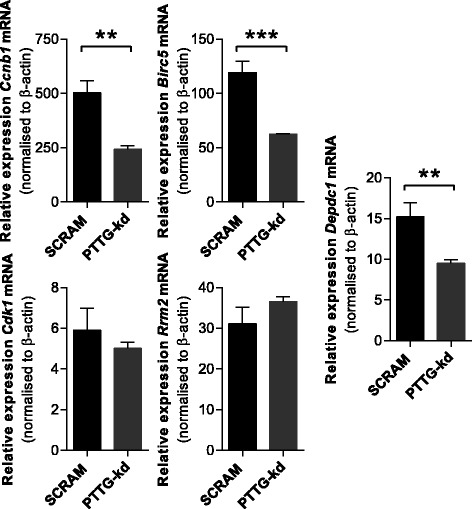
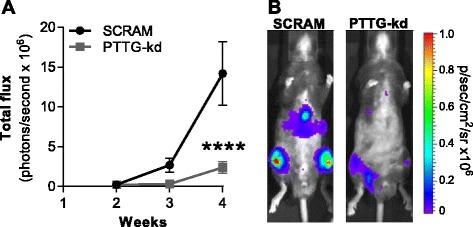
Results: PTTG1 was found to be over-expressed in 36-70 % of MM patients, relative to normal controls, with high PTTG1 expression being associated with poor patient outcomes (hazard ratio 2.49; 95 % CI 1.28 to 4.86; p = 0.0075; log-rank test). In addition, patients with high PTTG1 expression exhibited increased expression of cell proliferation-associated genes including CCNB1, CCNB2, CDK1, AURKA, BIRC5 and DEPDC1. Knockdown of Pttg1 in 5TGM1 cells decreased cellular proliferation, without affecting cell cycle distribution or viability, and decreased expression of Ccnb1, Birc5 and Depdc1 in vitro. Notably, Pttg1 knockdown significantly reduced MM tumour development in vivo, with an 83.2 % reduction in tumour burden at 4 weeks (p < 0.0001, two-way ANOVA).

Conclusions: This study supports a role for increased PTTG1 expression in augmenting tumour development in a subset of MM patients.


Figures

Fig. 1
Fig. 1
Pttg1 expression is increased in haematopoietic tissues of C57BL/KaLwRij mice. a Bone, bone marrow (BM), peripheral blood (PB), spleen and thymus and combined popliteal, inguinal and axillary lymph node tissues were isolated from C57BL/6 and C57BL/KaLwRij mice (n = 3/group) and total RNA extracted. Pttg1 mRNA expression was determined by qRT-PCR analysis. *p < 0.05, t test. b CD138+ plasma cells (PC) were isolated from the BM of C57BL/6 and C57BL/KaLwRij mice (n = 3/group). Pttg1 mRNA was significantly increased in KaLwRij-derived plasma cells compared with C57BL/6 controls. Graphs depict mean + SEM; *p < 0.05, t test
Fig. 2
Fig. 2
PTTG1 is over-expressed in MM patients. In silico analysis was performed on publically available gene expression datasets from CD138+ plasma cells isolated by MACS from MM (n = 73) and MGUS (n = 22) patients and healthy controls (n = 15) (E-GEOD-6477) (a), MM (n = 155) and MGUS (n = 5) patients and healthy controls (n = 5) (E-MTAB-363) (b) and MM (n = 133) and MGUS (n = 11) patients and healthy controls (n = 5) (E-GEOD-16122) (c). Box and whiskers plots show the median and interquartile ranges for each cohort. *p < 0.05; **** p < 0.0001; Kruskal-Wallis test with Dunn’s multiple comparison tests. d Representative image of a BM trephine section from an MM patient stained with anti-CD138 (red) and anti-PTTG1 (green), showing plasma cell-specific protein expression of PTTG1. A negative (no primary antibody) control is shown. e Kaplan-Meier plot of PTTG1 high patients (quartile 4; n = 71) vs PTTG1 low patients (quartiles 1–3; n = 214) (TT2 patients from GSE4581). f MM patients from GSE4581 (n = 414) were stratified into subgroups based on the UAMS criteria; namely, patients characterised by increased proliferation-related genes (PR), chromosomal translocations involving cyclin D1 and cyclin D3 (CD1 and CD2), MAF (MF) or MMSET (MS), as well as patients exhibiting hyperdiploidy (HY) and decreased prevalence of lytic bone disease (LB) [4]. The expression of PTTG1 was analysed in each subset. Box and whiskers plots show the median and interquartile ranges for each cohort; ^p < 0.0001 relative to CD1, CD2, MF, MS, HY and LB; #p < 0.01 relative to CD2, MF, MS, LB; Kruskal-Wallis test with Dunn’s multiple comparison tests
Fig. 3
Fig. 3
PTTG1 expression strongly correlates with expression of cell proliferation-related genes in MM patients. PTTG1 expression in 328 newly diagnosed MM patients (E-GEOD-19784) plotted against expression of cell cycle-related genes CDK1 (a), CCNB1 (b), CCNB2 (c), BIRC5 (d), RRM2 (e) and the non-cell cycle gene DEPCD1 (f). r and p values are shown for Pearson correlation analyses
Fig. 4
Fig. 4
Pttg1 knockdown reduces 5TGM1 proliferation in vitro. a A 70 % knockdown of Pttg1 mRNA was confirmed in 5TGM1-PTTG-kd cells compared with 5TGM1-SCRAM controls by qRT-PCR. b Reduced protein expression of Pttg1 was confirmed by Western blot. c Cells were seeded at 1 × 105 cells/mL in a 96-well plate, and cell numbers over 3 days were quantitated by WST-1 assay, read at 450 nm. d Cells were seeded at 4 × 105 cells/mL in a 96-well plate, BrdU substrate was added and BrdU incorporation was quantitated after 2 h by ELISA, measured by absorbance at 370 nm. *p < 0.05, t test. e Cells were seeded at 4 × 105 cells/mL in a six-well plate and cultured for 24 h, and cell cycle distribution was assessed following PI staining. Representative FACS plots (PI histograms) are shown. Graphs depict mean + SEM of three independent experiments
Fig. 5
Fig. 5
Pttg1 knockdown results in deregulation of proliferation-related genes in 5TGM1 cells. Expression of Ccnb1, Birc5, Cdk1, Rrm2 and Depcd1 was quantitated in 5TGM1-PTTG-kd cells compared with 5TGM1-SCRAM controls by qRT-PCR. Graphs depict mean + SD of triplicates from a single experiment. *p < 0.05, t test
Fig 6
Fig 6
Pttg1 knockdown reduces tumour growth in vivo. a Total tumour burden was measured at 2-, 3- and 4-weeks post-tumour cell inoculation using bioluminescence imaging techniques. A significant reduction in total tumour burden was observed in the Pttg kd group (n = 15) compared with SCRAM controls (n = 10); ****p < 0.001, two-way ANOVA with Sidak’s post-test. b Representative bioluminescent images of mice injected with 5TGM1-SCRAM control (left) and 5TGM1-PTTG-kd (right) cells at 4-weeks post-tumour cell inoculation are shown

References

    1. Al-Farsi K. Multiple myeloma: an update. Oman Med J. 2013;28(1):3–11. doi: 10.5001/omj.2013.02. - DOI - PMC - PubMed
    1. Landgren O, Morgan GJ. Biologic frontiers in multiple myeloma: from biomarker identification to clinical practice. Clin Cancer Res. 2014;20(4):804–13. doi: 10.1158/1078-0432.CCR-13-2159. - DOI - PMC - PubMed
    1. Dzikiewicz-Krawczyk A. MicroRNA-binding site polymorphisms in hematological malignancies. J Hematol Oncol. 2014;7(1):83. doi: 10.1186/s13045-014-0083-3. - DOI - PMC - PubMed
    1. Zhan F, Huang Y, Colla S, Stewart JP, Hanamura I, Gupta S, et al. The molecular classification of multiple myeloma. Blood. 2006;108(6):2020–8. doi: 10.1182/blood-2005-11-013458. - DOI - PMC - PubMed
    1. Shaughnessy JD, Jr, Zhan F, Burington BE, Huang Y, Colla S, Hanamura I, et al. A validated gene expression model of high-risk multiple myeloma is defined by deregulated expression of genes mapping to chromosome 1. Blood. 2007;109(6):2276–84. doi: 10.1182/blood-2006-07-038430. - DOI - PubMed

Publication types

MeSH terms

Substances