. 2015 Oct 7;10(10):e0138334.
doi: 10.1371/journal.pone.0138334. eCollection 2015.

A World at Risk: Aggregating Development Trends to Forecast Global Habitat Conversion

Affiliations

A World at Risk: Aggregating Development Trends to Forecast Global Habitat Conversion

James R Oakleaf et al. PLoS One. .

Abstract

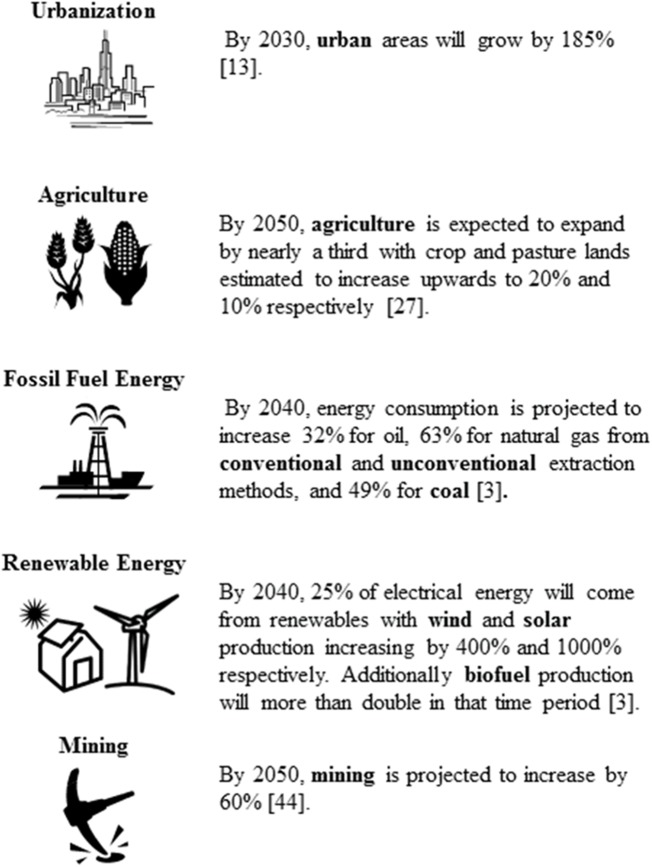
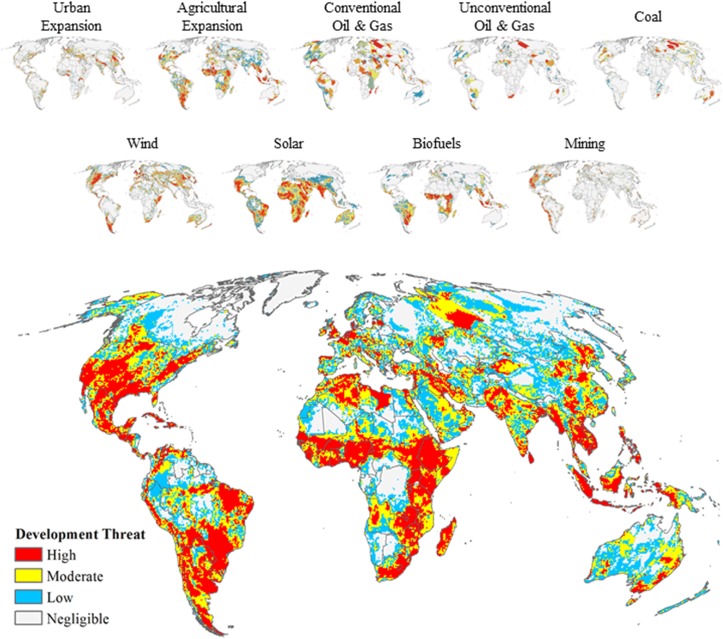
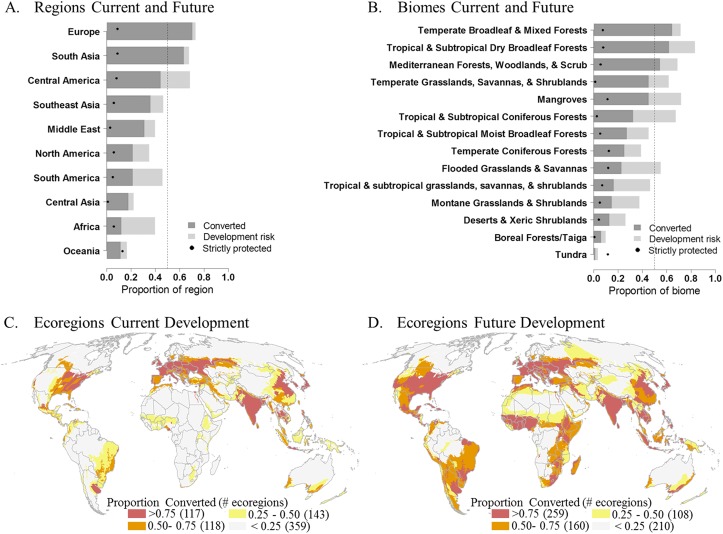
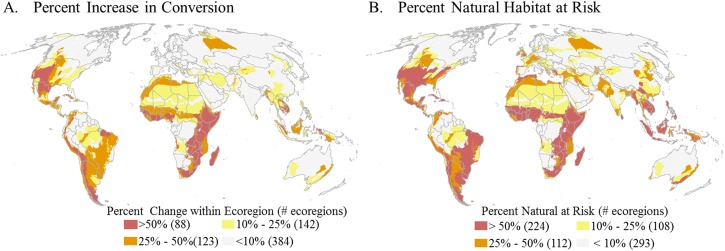
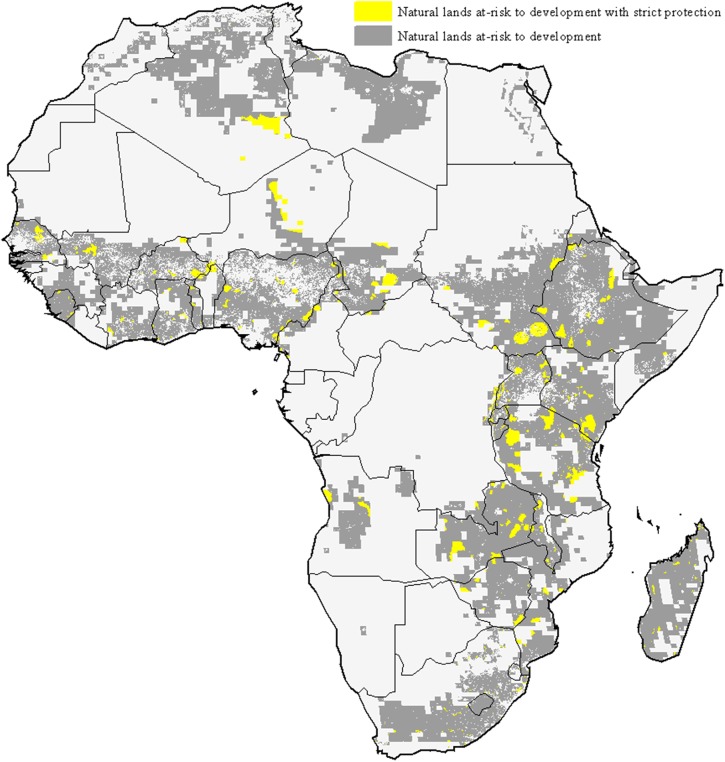
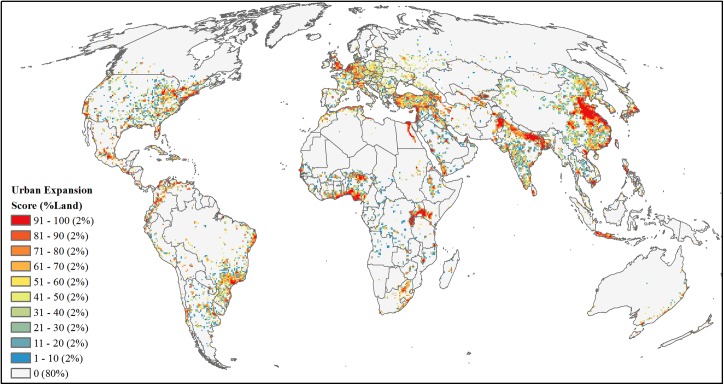
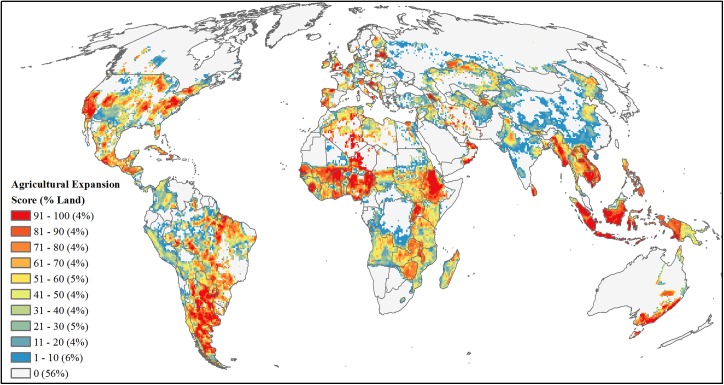
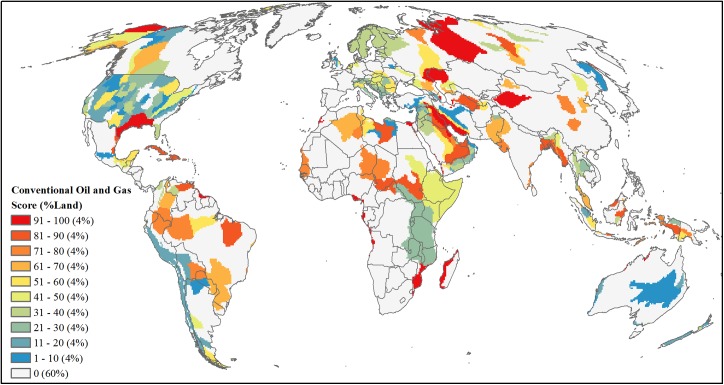
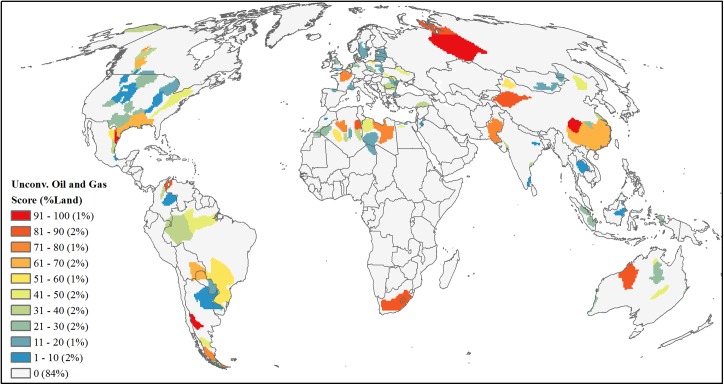
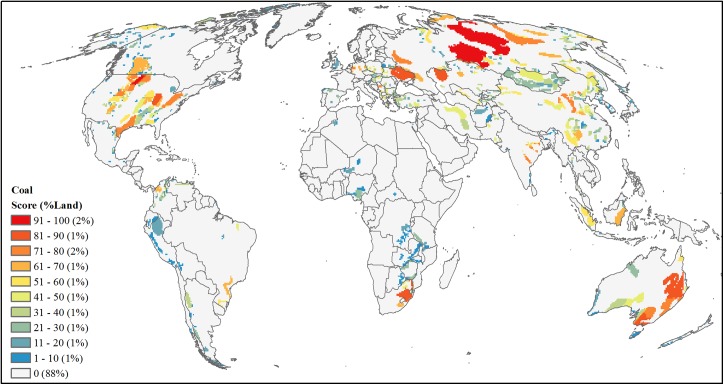
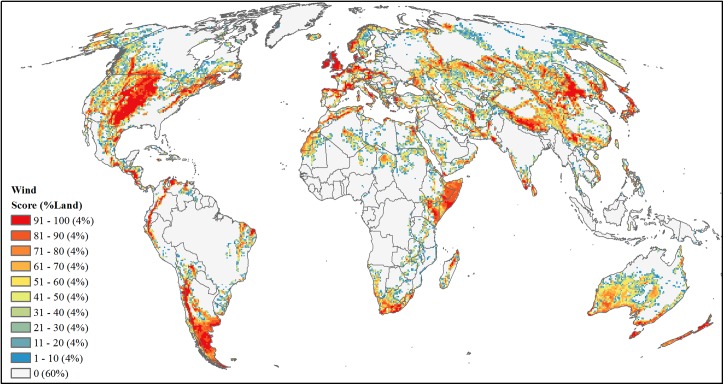
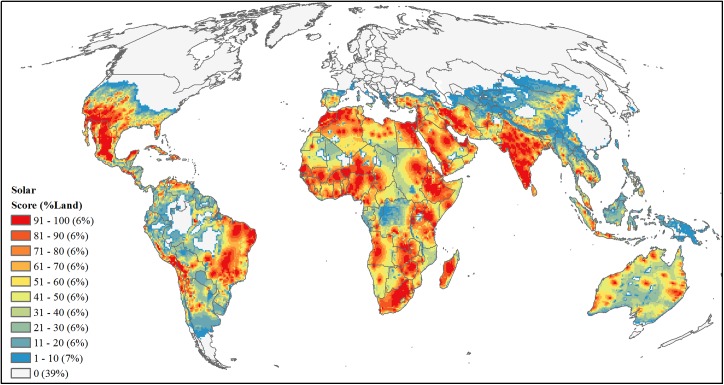
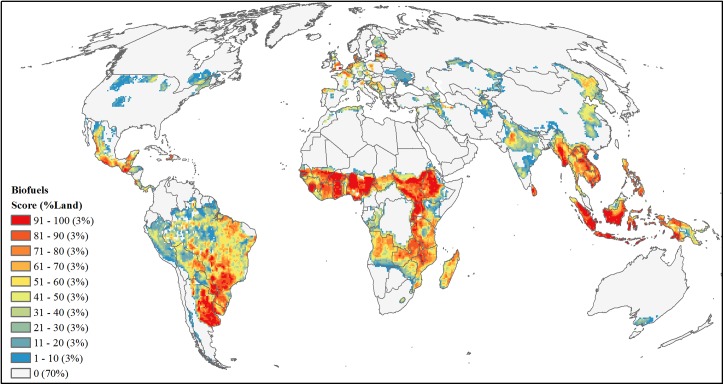
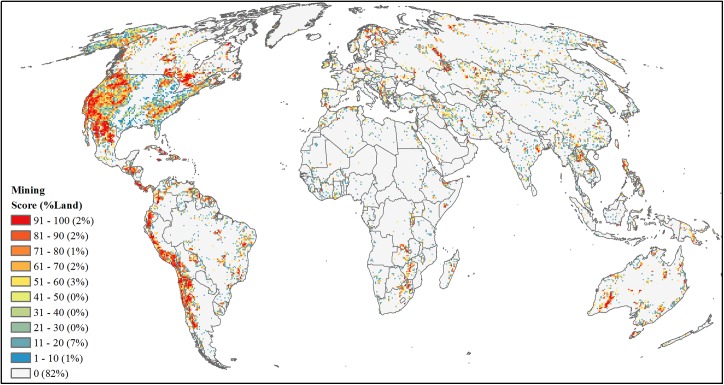
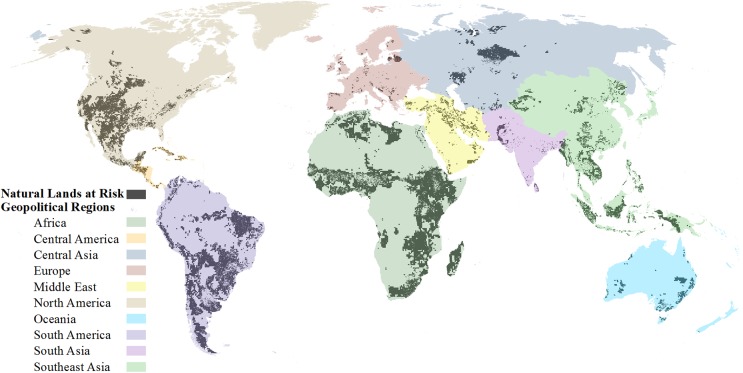
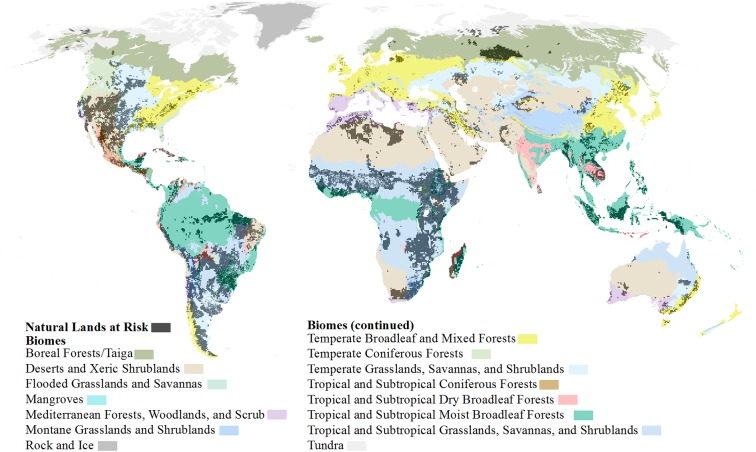
A growing and more affluent human population is expected to increase the demand for resources and to accelerate habitat modification, but by how much and where remains unknown. Here we project and aggregate global spatial patterns of expected urban and agricultural expansion, conventional and unconventional oil and gas, coal, solar, wind, biofuels and mining development. Cumulatively, these threats place at risk 20% of the remaining global natural lands (19.68 million km2) and could result in half of the world's biomes becoming >50% converted while doubling and tripling the extent of land converted in South America and Africa, respectively. Regionally, substantial shifts in land conversion could occur in Southern and Western South America, Central and Eastern Africa, and the Central Rocky Mountains of North America. With only 5% of the Earth's at-risk natural lands under strict legal protection, estimating and proactively mitigating multi-sector development risk is critical for curtailing the further substantial loss of nature.


Conflict of interest statement

Competing Interests: The authors have declared that no competing interests exist.

Figures

Fig 1
Fig 1. Global development pressures.
Published estimates of potential expansion for the nine development sectors included into the cumulative development threat analysis (as indicated in bold).
Fig 2
Fig 2. Future global development threat.
Individual sector development threat maps (top and also shown in Figs 5–13) used to calculate the cumulative future development threat (bottom) identified by binning global lands (except Antarctica) into four equal-area categories with the “High” category defined as the quarter of the globe with the highest cumulative threat scores.
Fig 3
Fig 3. Proportion of land currently converted and future conversion per geopolitical region, biome, and ecoregion.
The proportion of land in each geopolitical region (A) and biome (B) that is currently converted (dark grey), the proportion of natural lands at high risk to development (light grey), total future conversion (dark grey + light grey), and the proportion of strictly-protected natural lands at risk (dashed lines indicate the 50% threshold). Distribution of terrestrial ecoregions with > 0.75, 0.50, 0.25, and < 0.25 proportion of converted lands under (C) current conversion and (D) potential future land conversion including high development risk areas.
Fig 4
Fig 4. Ecoregions facing substantial change based on development risk to natural habitats.
Distribution of ecoregions binned into four categories > 50, 25, 10, and < 10 percent displaying A) the potential percent change in conversion within an ecoregion from current to future and B) the percent natural habitat within an ecoregion at risk to future development.
Fig 5
Fig 5. Africa natural lands at risk to future development.
Africa natural lands at high risk to future development (grey and yellow) and current at-risk natural lands benefiting from strict legal protection (yellow only).
Fig 6
Fig 6. Projected future development threat of urban expansion.
Area-ranked threat scores based on mean probabilities of global urban expansion by 2030, after excluding current urban areas.
Fig 7
Fig 7. Projected future development threat of agricultural expansion.
Area-ranked threat scores based on estimates of fractional amount of agricultural expansion by 2030 extrapolated from 2000–2011 cropland and pasture time series maps.
Fig 8
Fig 8. Projected future development threat of conventional oil and gas.
Area-ranked threat scores based on province-level estimates of undiscovered million barrels of oil equivalent for oil, natural gas, and liquid natural gas resources.
Fig 9
Fig 9. Projected future development threat of unconventional oil and gas.
Area-ranked threat scores based on basin-level estimates of technically recoverable billion barrels of oil equivalent for unconventional oil, natural gas, and liquid natural gas resources.
Fig 10
Fig 10. Projected future development threat of coal.
Area-ranked threat scores based on coal basin reserve estimates in million short tons attributed form country- and state-level coal reserve data.
Fig 11
Fig 11. Projected future development threat of utility-scale wind power.
Area-ranked threat scores based on combined metric of wind resources (m/s), land suitability, and economic feasibility for wind power development.
Fig 12
Fig 12. Projected future development threat of utility-scale solar power.
Area-ranked threat scores based on combined metric of solar resources (W/m2), land suitability, and economic feasibility for solar power development.
Fig 13
Fig 13. Projected future development threat of first generation biofuels.
Area-ranked threat scores based on values of maximum potential gallons of gasoline equivalent multiplied by fraction of agriculture expansion by 2030.
Fig 14
Fig 14. Projected future development threat of mining.
Area-ranked threat scores based on number of minerals and geologic materials deposit occurrences and prospects.
Fig 15
Fig 15. Natural lands at risk within geopolitical regions.
Global natural lands at high risk to future development (dark grey) overlaid on geopolitical regions of the world.
Fig 16
Fig 16. Natural lands at risk within biomes.
Global natural lands at high risk to future development (dark grey) overlaid on terrestrial biomes of the world.

References

    1. Gerland P, Raftery AE, Ev Ikova H, Li N, Gu D, Spoorenberg T, et al. World population stabilization unlikely this century. Science. 2014;346: 234–237. 10.1126/science.1257469 - DOI - PMC - PubMed
    1. Godfray HCJ, Beddington JR, Crute IR, Haddad L, Lawrence D, Muir JF, et al. Food security: the challenge of feeding 9 billion people. Science. 2010;327: 812–8. 10.1126/science.1185383 - DOI - PubMed
    1. US Energy Information Administration. International Energy Outlook 2013; 2013.
    1. Tilman D, Balzer C, Hill J, Befort BL. Global food demand and the sustainable intensification of agriculture. Proc Natl Acad Sci U S A. 2011;108: 20260–4. 10.1073/pnas.1116437108 - DOI - PMC - PubMed
    1. McDonald RI, Fargione J, Kiesecker J, Miller WM, Powell J. Energy sprawl or energy efficiency: climate policy impacts on natural habitat for the United States of America. Añel JA, editor. PLoS One. Public Library of Science; 2009;4: e6802 10.1371/journal.pone.0006802 - DOI - PMC - PubMed

Publication types

LinkOut - more resources