. 2016 Jan 1;115(1):434-44.
doi: 10.1152/jn.00194.2015. Epub 2015 Oct 7.

Testing the odds of inherent vs. observed overdispersion in neural spike counts

Affiliations

Testing the odds of inherent vs. observed overdispersion in neural spike counts

Wahiba Taouali et al. J Neurophysiol. .

Abstract

The repeated presentation of an identical visual stimulus in the receptive field of a neuron may evoke different spiking patterns at each trial. Probabilistic methods are essential to understand the functional role of this variance within the neural activity. In that case, a Poisson process is the most common model of trial-to-trial variability. For a Poisson process, the variance of the spike count is constrained to be equal to the mean, irrespective of the duration of measurements. Numerous studies have shown that this relationship does not generally hold. Specifically, a majority of electrophysiological recordings show an "overdispersion" effect: responses that exhibit more intertrial variability than expected from a Poisson process alone. A model that is particularly well suited to quantify overdispersion is the Negative-Binomial distribution model. This model is well-studied and widely used but has only recently been applied to neuroscience. In this article, we address three main issues. First, we describe how the Negative-Binomial distribution provides a model apt to account for overdispersed spike counts. Second, we quantify the significance of this model for any neurophysiological data by proposing a statistical test, which quantifies the odds that overdispersion could be due to the limited number of repetitions (trials). We apply this test to three neurophysiological data sets along the visual pathway. Finally, we compare the performance of this model to the Poisson model on a population decoding task. We show that the decoding accuracy is improved when accounting for overdispersion, especially under the hypothesis of tuned overdispersion.

Keywords: decoding; negative-binomial distribution; overdispersion; spike counts; tuning function..


Figures

Fig. 1.
Fig. 1.
Trial-to-trial variability of neural responses. A: we show the spiking activity of a representative cell of the area middle temporal cortex (MT) of a macaque monkey (see materials and methods) in response to oriented drifting gratings. Each subplot corresponds to a raster plot of the responses to 16 equally distributed motion directions. There is a high trial-to-trial variability in the spiking responses. B: to quantify this variability, we plot the directional tuning curves in response to the same 16 directions (mean spike count, black lines) along with the range of ± SD (dark gray lines) for a population of 16 cells from the same area. The subplot with a star corresponds to the representative cell in A. The area corresponding to the mean ± SD expected under Poisson distribution hypothesis (σ = μ) is plotted in light gray. In this experiment, most of the cells show a higher variability than expected from the Poisson model (PM).
Fig. 2.
Fig. 2.
Overdispersion may result from extrinsic sensory noise: Negative-Binomial distribution model (NBM) as a mixture of Poisson and Log-Normal distributions. We show here a simple linear/nonlinear spiking model with 3 processing steps. A: correlation between an noisy Gabor image (input) and a population of Gabor filters at different orientations models the linear processing in the receptive field (RF) of a visual neuron. The gray, black, and dashed lines correspond, respectively, to 1 trial (simulation), the average, and the average ± SD (within 1,000 trials). B: this input is transformed using a static, exponential nonlinearity multiplied by a scaling factor corresponding to the maximum spike count. The input drive resulting from a Gaussian input noise and the nonlinearity follows a Log-Normal distribution that is closely fitted by a Gamma distribution. C: this drive is finally transformed into spike counts using a Poisson point process with the mean as the input drive. The resulting tuning curve (mean spike count) is plotted in black along with the range of ± SD (dashed line). The area corresponding to the mean ± SD expected given the PM (σ = μ) is plotted in gray. The resulting spike counts variance is higher than what is expected by a PM, as can be observed in neurophysiological data (see Fig. 1B).
Fig. 3.
Fig. 3.
Overdispersion may result from redundancy within a neural population. NBM as mixture of Poisson and Exponential distributions. Let us consider, within a neural population, a subset of ϕ cells with a similar selectivity and thus driven by a similar correlation measure λ = C(θ). This measures the correlation between the input Gabor and the Gabor representing the orientation θ characteristic of their RF. Let us further assume that the filter cells exhibit an exponential distribution of spike counts ε(1λ) with mean λ, thus maximizing the entropy of the input drive. Then, the pooling of the resulting spike counts results in an input drive G(ϕ, λ) equal to the sum of exponential variables having the same mean equal to λ. It can be shown that the Poisson spiking process driven by this input drive is equivalently described by a Negative-Binomial probability distribution function with parameters λ (mean) and ϕ (inverse-dispersion) (see Eq. 2). Such a distribution describes observed trial-to-trial variability well and in this model, the parameter of dispersion is directly correlated with the redundancy, i.e., the convergence of similar input cells.
Fig. 4.
Fig. 4.
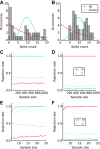
Evaluating the power of χ2-test vs. Fano Gamma test (FG) when testing evidence against PM (in blue) and NBM (in red). A and B: 2 examples of spike count histograms resulting from artificially generated data (surrogate data) using the NBM (A) and the PM (B). These examples were chosen such that, when using the χ2-test, the model used to synthesize the data is rejected. For each histogram, we plotted in blue the expected distribution from a PM and in red the expected distribution from an NBM. For these examples, the sample size is 50. C–F: χ2-test (dashed lines) and FG test (solid lines) were applied to Negative-Binomial (C) and Poisson (D) surrogate data for different sample sizes with a significance level of 0.025. The mean is fixed to 10 spikes, the dispersion parameter is equal to 1 spike and the test was repeated 1,000 times for each sample size. E and F: results in C and D, respectively, corresponding to small sample sizes. The rejection rate is higher for χ2-test when the null hypothesis is the correct distribution (the model generating the data) and lower for the incorrect distribution than for the proposed FG test. The results thus show this test is more powerful than the classically used χ2-test.
Fig. 5.
Fig. 5.
Evaluating evidence against PM and NBM on visual neurophysiological data. A: FG test results: evidence against the PM. Each subplot shows the measures of variability for the different cells and conditions as points on a (mean, variance) plot. The straight line corresponds to Fano factor (FF) = 1 (Poisson), while dots correspond to observations. Blue dots correspond to observations with no evidence against Poisson, red dots correspond to no evidence against the NBM, and black dots correspond to strong evidence against the PM on the top and against NBM on the bottom based on the empiric distribution of the FF (FG test). The results show that there is more evidence of overdispersion in MT and that the proportion of cells showing overdispersion seems to increase along the visual hierarchy. B: percentage of observations with evidence against PM and NBM are given with respect to 3 criteria: the FF test discards the observations with a FF value higher or lower than its formal expected value (equal to 1 for the PM), the χ2-test, and the FG test with a significance level of 0.025. The bar plots correspond to the percentage of observations with evidence against the NBM (left) and the PM (right). The tests were applied to 3 data sets (from the left to the right, respectively): lateral geniculate nucleus (LGN) cells (mouse), primary visual cortex (V1) cells (awake macaque monkey), and MT cells (anaesthetized macaque monkeys). The results show that the FF values are misleading when the number of trials is not taken into account. Looking only at the FF gives strong evidence against PM and NBM that is not confirmed by the other tests. The χ2-test shows slightly more evidence against the PM than the FG test, which could be explained by categorization issues. It shows also very strong evidence against the NBM known to be suitable for over dispersed data. In summary, the FG test gives more coherent results: weak evidence of overdispersion in LGN and V1 data sets and low evidence against the NBM in MT data set.
Fig. 6.
Fig. 6.
Mean and dispersion tunings. A and C: box plots represent the distribution of cells' mean spike count (A) and the distribution of their inverse-dispersion values (C) function of the different directions centered around the preferred direction of each cell. The “whiskers” for each direction indicate the 25th and the 75th percentiles. The dashes (black in A for mean and black in C for inverse dispersion) represent the median values. The inverse-dispersion parameter (C) shows a tuning less regular than the mean (A) but that could, as a first approximation, be fitted by a bell-shaped function. B and D: tuning curves of the mean spike count (B, in gray) and the inverse-dispersion (D, in gray) for 16 cells resulting from, respectively, the fit of a von Mises function (equivalent to a circular Gaussian) to each cell estimated parameters from their repeated responses to the 16 directions used for training (gray points). Each subplot corresponds to a cell. The tuning functions of the inverse-dispersion are supposed to be centered on the cell's preferred direction deduced from the mean fit.
Fig. 7.
Fig. 7.
Population decoding: PM vs. NBM. Variation of decoding error values using the NBM function compared with that using the PM both applied to real MT data (A and C) and then to surrogate data generated using the parameters inferred from the real data (B and D). We tested two alternatives of the NBM: one with an overdispersion parameter stimulus-independent (nontuned dispersion) and the other fitting this parameter by a von Mises function of the direction centered on the preferred direction (tuned dispersion). Points correspond to the median error values and bars to 25–75% confidence interval within 100 trials (horizontal for PM and vertical for NBM). The PM and The NBM with nontuned dispersion show similar results. However, the NBM with stimulus-dependent dispersion parameters shows better results compared with the 2 others. This suggests that tuned overdispersion could play a role in the neural code.
Fig. 8.
Fig. 8.
Complex tuning of FF values for different motion directions. A: example of a mean response tuning curve. B: example of an inverse-dispersion tuning curve. A and B were analytically generated by Von Mises (circular Gaussian) functions centered on a given preferred direction (PD). C: let us suppose that the spiking count of a cell is driven from an NBM characterized by mean values given in A and inverse dispersion values given in B. The expected resulting FF values are given by the relationship equation (FF = 1 + fϕ). For example, the mean value (7.14) and the inverse dispersion value (21.47) corresponding to the PD result in an FF value of 1.33. The resulting FF profile could not be explained only by the mean response tuning as in a PM.

References

    1. Alitto HJ, Moore BD, Rathbun DL, Usrey MM. A comparison of visual responses in the lateral geniculate nucleus of alert and anesthetized macaque monkeys. J Physiol 589: 87–99, 2011. - PMC - PubMed
    1. Amarasingham A, Chen TL, Geman S, Harrison MT, Sheinberg DL. Spike count reliability and the Poisson hypothesis. J Neurosci 26: 801–809, 2006. - PMC - PubMed
    1. Anscombe FJ. Sampling theory of the negative binomial and logarithmic series distributions. Biometrika 37: 358–382, 1950. - PubMed
    1. Arieli A, Sterkin A, Grinvald A, Aertsen A. Dynamics of ongoing activity: explanation of the large variability in evoked cortical responses. Science 273: 1868–1871, 1996. - PubMed
    1. Atkinson AC. Regression diagnostics, transformations and constructed variables. J R Stat Soc Series B Stat Methodol 44: 1–36, 1982.

Publication types