. 2015 Oct 8:5:14871.
doi: 10.1038/srep14871.

FSP1(+) fibroblast subpopulation is essential for the maintenance and regeneration of medullary thymic epithelial cells

Affiliations

FSP1(+) fibroblast subpopulation is essential for the maintenance and regeneration of medullary thymic epithelial cells

Lina Sun et al. Sci Rep. .

Abstract

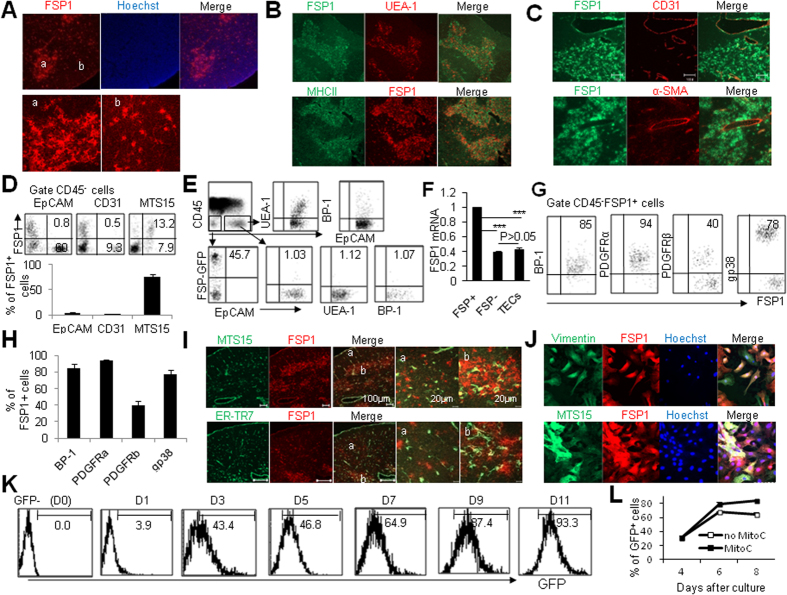
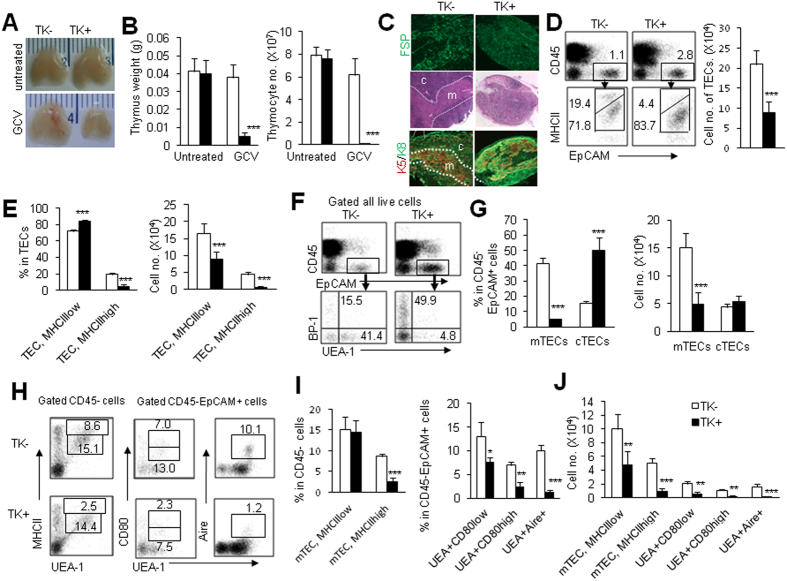
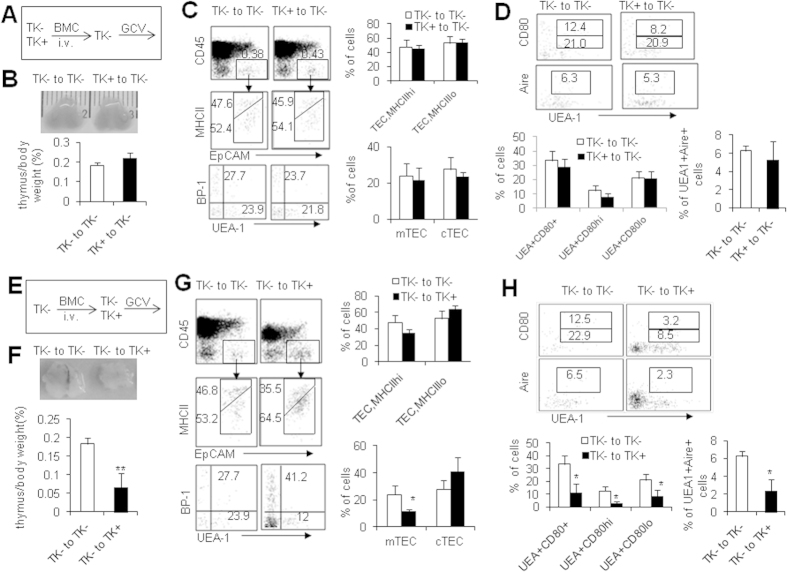
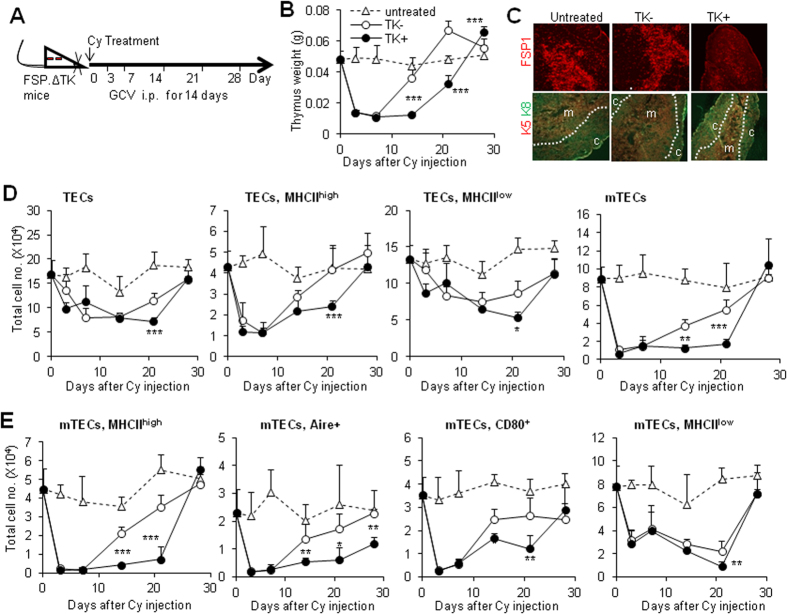
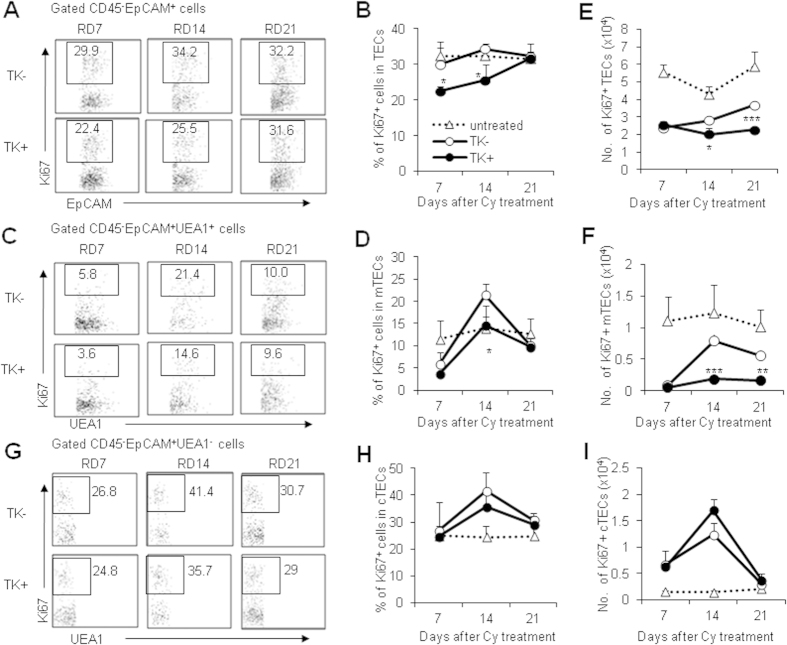
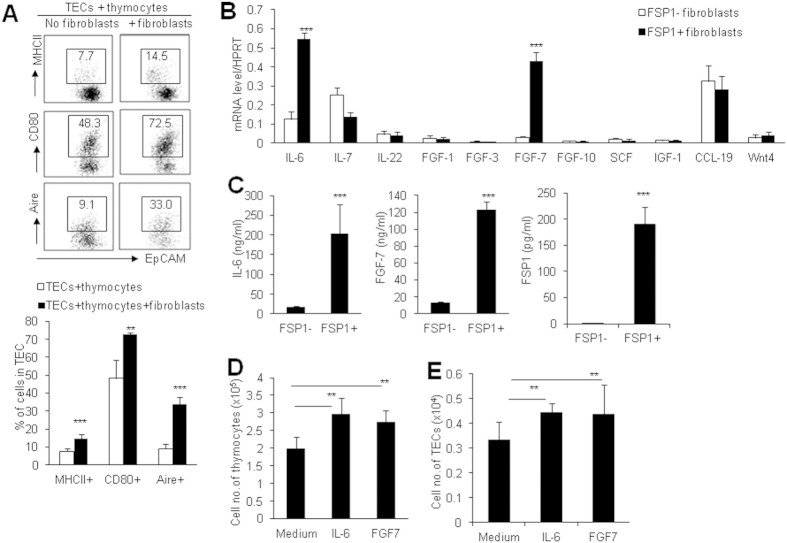
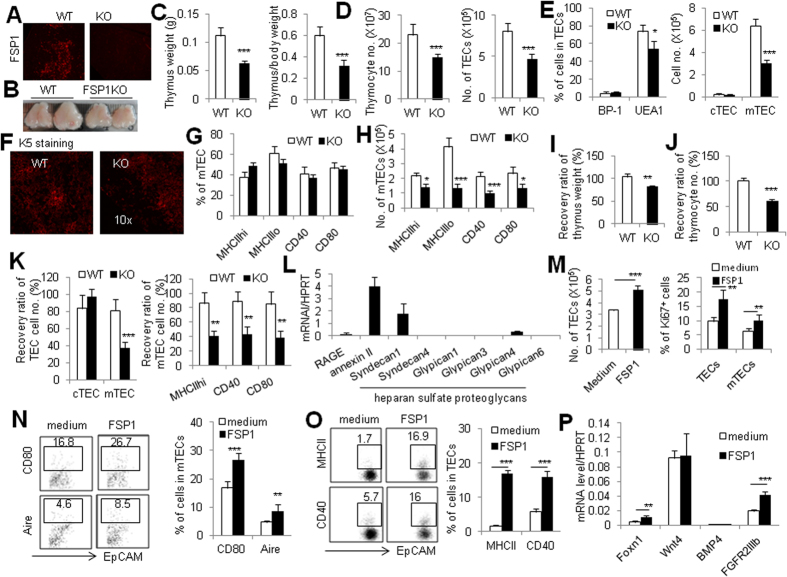
Thymic epithelial cells (TECs) form a 3-dimentional network supporting thymocyte development and maturation. Besides epithelium and thymocytes, heterogeneous fibroblasts are essential components in maintaining thymic microenvironments. However, thymic fibroblast characteristics, development and function remain to be determined. We herein found that thymic non-hematopoietic CD45(-)FSP1(+) cells represent a unique Fibroblast specific protein 1 (FSP1)(-)fibroblast-derived cell subset. Deletion of these cells in FSP1-TK transgenic mice caused thymus atrophy due to the loss of TECs, especially mature medullary TECs (MHCII(high), CD80(+) and Aire(+)). In a cyclophosphamide-induced thymus injury and regeneration model, lack of non-hematopoietic CD45(-)FSP1(+) fibroblast subpopulation significantly delayed thymus regeneration. In fact, thymic FSP1(+) fibroblasts released more IL-6, FGF7 and FSP1 in the culture medium than their FSP1(-) counterparts. Further experiments showed that the FSP1 protein could directly enhance the proliferation and maturation of TECs in the in vitro culture systems. FSP1 knockout mice had significantly smaller thymus size and less TECs than their control. Collectively, our studies reveal that thymic CD45(-)FSP1(+) cells are a subpopulation of fibroblasts, which is crucial for the maintenance and regeneration of TECs especially medullary TECs through providing IL-6, FGF7 and FSP1.


Figures

Figure 1
Figure 1. Characteristics of FSP1 expression in the thymus.
Frozen thymic sections from 6-8-wks-old WT mice were co-stained with FSP1 and Hoechst 33342 (A) or UEA-1 and MHCII (B) or CD31 and α-SMA (C). (D) Phenotypic characterization of FSP1 vs EpCAM, CD31 and MTS15 expression in the gated thymic CD45 cells of FSP1-GFP reporter mice was shown. (E) Representative flow cytometry staining of UEA-1, BP-1, and FSP1-GFP+ cells among the gated CD45EpCAM and CD45EpCAM+ (UEA1+ and BP-1+) cells in FSP1-GFP mice. (F) The mRNA expression of FSP1 in TECs, FSP1+ and FSP1 fibroblasts as determined by real-time PCR. (G) Representative flow cytometry staining and the percentage of BP-1, PDGFRα, PDGFRβ and gp38 cells among the gated CD45FSP1+ cells in FSP1-GFP mice. (H) The percentage of BP-1, PDGFRα, PDGFRβ and gp38 cells among CD45FSP1+ cells in the thymus of FSP1-GFP mice. (I) Staining of frozen thymic sections from 6–8 wk WT mice with FSP1 and MTS15 (the upper panel) and ER-TR7 (the lower panel) was shown. (J) Cultured primary thymic fibroblasts were stained with FSP1 and vimentin or MTS15. (K) FSP1-GFP expression in thymic fibroblasts was assayed at different culture time points. (L) Percentage of FSP1+ cells in primary thymic fibroblasts with or without 10 μg/ml mitomycin C treatment for 4 hours. Representative results are shown from one of three independent experiments performed.
Figure 2
Figure 2. Deletion of FSP1+ cells dramatically altered thymus structure and cell composition.
(A) Representative photographs of thymus organs in TK and TK+ transgenic mice with and without GCV treatment for 18 days were shown. (B) Thymus weight and total cell numbers of thymocytes in TK and TK+ mice with GCV treatment were summarized. (C) Thymic sections from GCV treated TK and TK+ mice were stained with FSP1 to determine the ablating efficiency (upper). The H&E and CK5/CK8 staining of thymic sections showed decreased area of thymic medullary region in TK+ mice than in TK mice after GCV treatment (middle and lower). (D) Representative FACS analysis of CD45EpCAM+ TECs, MHCIIhigh and MHCIIlow TECs in the isolated thymic cells was shown. The cell number of TECs in TK+ mice was less than in TK mice after GCV treatment. (E) The percentage and the total cell number of MHCIIhigh and MHCIIlow TECs in GCV-treated TK and TK+ mice were summarized. Representative FACS profiles (F), and the percentage and total cell number (G) of mTECs and cTECs in CD45EpCAM+ cells in GCV-treated TK and TK+ mice were shown. Phenotypic characterization (H) and the percentages (I) of MHCII+, CD80+ and Aire+ mTECs in the gated thymic CD45 or CD45EpCAM+ cells of TK and TK+ mice with GCV treatment. (J) The total cell numbers of CD45EpCAM+UEA-1+MHCIIhigh, CD45EpCAM+UEA-1+CD80high, CD45EpCAM+UEA-1+CD80low and CD45EpCAM+UEA-1+Aire+ cells in GCV-treated TK and TK+ mice. Representative results are shown from one of three independent experiments performed. Data were shown as mean ± SD (N = 5). *P < 0.05, **P < 0.01, ***P < 0.001 compared with TK mice.
Figure 3
Figure 3. Essential roles of non-hematopoietic FSP1+ cells in TEC maintenance.
(A) Full chimeric mice were generated by transplanting either TK and TK+ bone marrow cells (BMCs) to lethally irradiated TK mice. By 8 weeks after transplantation of BMCs, recipient mice were treated with GCV for 18 days, and the TEC subsets were assayed. (B) Representative photographs of thymus organs and the ratio of thymus weight to body weight in TK recipient mice received TK and TK+ BMCs. (C) Representative FACS staining and the frequencies of TECs, MHCIIhigh and MHCIIlow TECs, mTECs and cTECs in TK recipient mice received TK and TK+ BMCs. (D) Representative FACS staining and the frequencies of CD80high, CD80low and Aire expression in mTECs of TK recipient mice received TK and TK+ BMCs. (E) Full chimeric mice were generated by transplanting TK BMCs to lethally irradiated either TK and TK+ mice. By 8 weeks after transplantation of BMCs, recipient mice were treated with GCV for 18 days, and the TEC subsets were assayed. (F) Representative photographs of thymus organs and the ratio of thymus weight to body weight in TK and TK+ recipient mice received TK BMCs. (G) Representative FACS staining and the frequencies of TECs, MHCIIhigh and MHCIIlow TECs, mTECs and cTECs in TK and TK+ recipient mice. (H) Representative FACS staining and the frequencies of CD80high, CD80low and Aire expression in mTECs of TK and TK+ recipient mice were shown. Data presented are mean ± SD (N = 5). Representative results are shown from one of three independent experiments performed. *P < 0.05, **P < 0.01, ***P < 0.001 compared with TK mice.
Figure 4
Figure 4. Deletion of FSP1+ cells significantly delayed thymus recovery.
(A) Cyclophosphamide (Cy)-induced thymus regeneration model was established in TK and TK+ mice. These mice were treated with GCV for 14 days during thymus recovery. TECs subsets were analyzed at indicated time points. (B) The recovery curve of thymus weight of untreated (triangle), TK (open cycle) and TK+ (closed cycle) mice at various time-points after Cy injection. (C) Thymic sections from untreated and Cy/GCV-treated TK and TK+ mice after 14 days recovery were stained for the expression of FSP1 (the upper panel) and CK5/CK8 (the lower panel). (D) Recovery of cell number of TECs, TEChigh, TEClow and mTECs from Cy/GCV-treated TK and TK+ mice at different time points. (E) The recovery of mTECs of MHCIIhigh, Aire+, CD80+ and MHCIIlow in Cy/GCV-treated TK and TK+ mice at indicated time points were present. Data presented are the mean ± SD (N = 6), representing one representative of three independent experiments with identical results. *P < 0.05, **P < 0.01 and ***P < 0.001 compared with TK controls.
Figure 5
Figure 5. Deletion of FSP1+ cells impacted TEC proliferation.
(A) Representative FACS profiles for Ki67 staining in the gated thymic CD45EpCAM+ cells of Cy/GCV-treated TK and TK+ mice at various time points. (B) The percentages of Ki67+ cells in CD45EpCAM+ TECs in untreated as well as Cy/GCV-treated TK and TK+ mice. (C) Dot plots of UEA-1 vs Ki67 expression on CD45EpCAM+UEA-1+ TECs at different time points. (D) The percentages of Ki67+ cells in mTECs in Cy/GCV-treated TK and TK+ mice were shown. The cell number of CD45EpCAM+Ki67+ TECs (E) and the cell number of Ki67+ mTECs (F) in Cy/GCV-treated TK and TK+ mice was summarized. (G) Dot plots of UEA-1 vs Ki67 expression on CD45EpCAM+UEA-1 TECs at different time points. (H) The percentages of Ki67+ cells in cTECs in Cy/GCV-treated TK and TK+ mice were shown. (I) The cell number of Ki67+ cTECs in Cy/GCV-treated TK and TK+ mice was summarized. Data represent the mean ± SD (n = 4 mice/group) from one of four independent experiments. **P < 0.01 and ***P < 0.001 (TK vs TK+).
Figure 6
Figure 6. Thymic FSP-1+ fibroblasts promoted TEC proliferation by IL-6 and FGF7.
RTOC were established by re-aggregating culture of TECs and thymocytes with or without thymic FSP1+ fibroblasts. (A) Representative FACS profiles and the frequencies of MHCII, CD80 and Aire expression in the gated CD45EpCAM+ cells after RTOC culture with or without thymic FSP1+ fibroblasts. (B) The expression of cytokines in thymic FSP1 and FSP1+ fibroblasts were determined by Real-time PCR. Data are representative of 2–3 independent experiments (3 samples each group per time). (C) The levels of IL-6, FGF7 and FSP1 in cell culture supernatants of primary thymic FSP1 and FSP1+ fibroblasts were detected by ELISA. (D) The total cell numbers of thymic lobes cultured with IL-6 (100 ng/ml) and FGF7 (100 ng/ml) for 6 days in FTOC were summarized. (E) The total cell numbers of CD45EpCAM+ TECs in thymic lobes cultured with IL-6 (100 ng/ml) and FGF7 (100 ng/ml) for 6 days in FTOC were summarized. Representative results are shown from one of three independent experiments performed. Data presented are mean ± SD (N = 6). *P < 0.05, **P < 0.01 and ***P < 0.001 (FSP1 vs FSP1+ or between the indicated groups).
Figure 7
Figure 7. FSP1 directly regulates TEC proliferation and differentiation.
(A) Frozen thymic section from 6–8wk WT and FSP1KO mice were stained with FSP1. (B) Representative photographs of thymus organs in WT and FSP1KO mice was shown. (C) Thymus weight and the ratio of thymus weight to body weight in FSP1KO mice were significantly lower than in WT mice. (D) Total cell numbers of thymocyte and TECs in WT and FSP1KO mice were presented. (E) The percentage and the total cell number of cTECs and mTECs in WT and FSP1KO mice. (F) Frozen thymic sections from WT and FSP1KO mice were stained with CK5, revealing decreased thymic medullary area in FSP1KO mice. The frequencies (G) and the total cell number (H) of MHCIIhigh, CD40+, CD80+ mTECs in WT and FSP1KO mice were summarized. (I) The recovery ratio of thymus weight in FSP1KO mice was lower than in WT mice after Cy-treatment. (J) The recovery ratio of total cell number of thymocytes in WT and FSP1KO mice after Cy-treatment were shown. (K) The recovery ratio of cTECs and mTECs, and mTECs expressing MHCIIhigh, CD40+ and CD80+ in WT and FSP1KO mice were summarized. Data is mean ± SD (4–6 mice/group) from one of two independent experiments. (L) The mRNA levels of RAGE, annexin II and heparan sulfate proteoglycans in cultured primary TECs and thymocytes were assayed by Real-time PCR. (M) FSP1 significantly increased the total cell number of TECs and the percentage of Ki67+ cells in TECs and mTECs after the fetal thymus was cultured with FSP1 in FTOC system for 6 days were summarized. (N) Representative FACS and the percentage of CD80 and Aire expression on mTECs were significantly increased after thymi were cultured in FTOC system with FSP1 for 6 days. (O) Representative FACS and the percentage of MHCII and CD40 expression on TECs were significantly increased after primary TECs were cultured with FSP1 for 5 days. (P) The expression of Foxn1, Wnt4, BMP4 and FGFR2IIIb in TECs cultured with or without FSP1 were detected by Real-time PCR. Data is mean ± SD (3–5 sample/group) from one of two independent experiments. *P < 0.05, **P < 0.01, and ***P < 0.001 (FSP1KO vs WT or between the indicated groups).

References

    1. Rodewald H. R. Thymus organogenesis. Annu Rev Immunol. 26, 355–388 (2008). - PubMed
    1. Manley N. R., Richie E. R., Blackburn C. C., Condie B. G. & Sage J. Structure and function of the thymic microenvironment. Front Biosci (Landmark Ed). 16, 2461–2477 (2011). - PubMed
    1. Anderson G. & Takahama Y. Thymic epithelial cells: working class heroes for T cell development and repertoire selection. Trends Immunol. 33, 256–263 (2012). - PubMed
    1. Anderson G., Lane P. J. & Jenkinson E. J. Generating intrathymic microenvironments to establish T-cell tolerance. Nat Rev Immunol. 7, 954–963 (2007). - PubMed
    1. Manley N. R. & Condie B. G. Transcriptional regulation of thymus organogenesis and thymic epithelial cell differentiation. Prog Mol Biol Transl Sci. 92, 103–120 (2010). - PubMed

Publication types

MeSH terms