. 2015 Nov;18(4):103-9.
doi: 10.1136/eb-2015-102228. Epub 2015 Oct 7.

Meta-analysis of diagnostic accuracy studies in mental health

Affiliations

Meta-analysis of diagnostic accuracy studies in mental health

Yemisi Takwoingi et al. Evid Based Ment Health. 2015 Nov.

Abstract

Objectives: To explain methods for data synthesis of evidence from diagnostic test accuracy (DTA) studies, and to illustrate different types of analyses that may be performed in a DTA systematic review.

Methods: We described properties of meta-analytic methods for quantitative synthesis of evidence. We used a DTA review comparing the accuracy of three screening questionnaires for bipolar disorder to illustrate application of the methods for each type of analysis.

Results: The discriminatory ability of a test is commonly expressed in terms of sensitivity (proportion of those with the condition who test positive) and specificity (proportion of those without the condition who test negative). There is a trade-off between sensitivity and specificity, as an increasing threshold for defining test positivity will decrease sensitivity and increase specificity. Methods recommended for meta-analysis of DTA studies --such as the bivariate or hierarchical summary receiver operating characteristic (HSROC) model --jointly summarise sensitivity and specificity while taking into account this threshold effect, as well as allowing for between study differences in test performance beyond what would be expected by chance. The bivariate model focuses on estimation of a summary sensitivity and specificity at a common threshold while the HSROC model focuses on the estimation of a summary curve from studies that have used different thresholds.

Conclusions: Meta-analyses of diagnostic accuracy studies can provide answers to important clinical questions. We hope this article will provide clinicians with sufficient understanding of the terminology and methods to aid interpretation of systematic reviews and facilitate better patient care.


Figures

Figure 1
Figure 1
Forest plot of sensitivity and specificity of the MDQ for detection of any type of bipolar disorder in mental health centre settings . Two covariates (threshold and language of the instrument) are shown on the plot. The studies are ordered according to the threshold, language of the instrument (Asian, yes or no) and sensitivity (FN, false negative; FP, false positive; MDQ, mood disorder questionnaire; TN, true negative; TP, true positive).
Figure 2
Figure 2
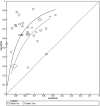
Summary receiver operating characteristic plot of the mood disorder questionnaire (MDQ) at a common threshold of 7 for detection of any type of bipolar disorder in mental health centre settings. The size of each point is scaled according to the precision of sensitivity and specificity for the study. The solid circle (summary point) represents the summary estimate of sensitivity and specificity for the MDQ at a threshold of 7. The summary point is surrounded by a dotted line representing the 95% confidence region and a dashed line representing the 95% prediction region (the region within which we are 95% certain that the results of a new study will lie).
Figure 3
Figure 3
Summary receiver operating characteristic plot of the mood disorder questionnaire (MDQ) at different thresholds for detection of any type of bipolar disorder in mental health centre settings. Each study point was scaled according to the precision of sensitivity and specificity for the study. The summary curve was drawn restricted to the range of specificities (0.47 to 1.00) from the 30 studies included in the evaluation of the MDQ.
Figure 4
Figure 4
Summary receiver operating characteristic curves comparing Asian and non-Asian language versions of the mood disorder questionnaire. Each study point was scaled according to the precision of sensitivity and specificity for the study. The summary curves were drawn restricted to the range of specificities for each group of studies (0.47 to 1.00 for non-Asian and 0.53 to 0.95 for Asian studies).
Figure 5
Figure 5
SROC plot comparing the accuracy of BSDS, HCL-32 and MDQ for detection of any type of bipolar disorder in mental health centre settings. For each test on an SROC plot, each symbol represents the pair of sensitivity and specificity from a study. The study points were scaled according to the precision of sensitivity and specificity in the studies. Each SROC curve was drawn restricted to the range of specificities from included studies that evaluated the test. The SROC plot in panel (A) is an indirect comparison (includes all studies that evaluated any of the tests) while panel (B) is a direct comparison where analysis were restricted to only studies that compared both tests in the same patients. A line connects the pair of points representing the two tests from each study (adapted from Carvalho et al; BSDS, bipolar spectrum diagnostic scale; HCL-32, hypomanic checklist; MDQ, mood disorder questionnaire; SROC, Summary receiver operating characteristic). Reprinted from ref 22 with permission from Elsevier.

References

    1. Naaktgeboren CA, Bertens LC, van Smeden M, et al. . Value of composite reference standards in diagnostic research. BMJ 2013;347:f5605. 10.1136/bmj.f5605 - DOI - PubMed
    1. Bachmann LM, Puhan MA, ter Riet G, et al. . Sample sizes of studies on diagnostic accuracy: literature survey. BMJ 2006;332:1127–9. 10.1136/bmj.38793.637789.2F - DOI - PMC - PubMed
    1. Dahabreh IJ, Chung M, Kitsios GD, et al. . Comprehensive overview of methods and reporting of meta-analyses of test accuracy. Rockville, MD: Agency for Healthcare Research and Quality, 2012. - PubMed
    1. Steingart KR, Sohn H, Schiller I, et al. . Xpert® MTB/RIF assay for pulmonary tuberculosis and rifampicin resistance in adults. Cochrane Database Syst Rev 2013;1:CD009593. 10.1002/14651858.CD009593.pub2 - DOI - PMC - PubMed
    1. Automated real-time nucleic acid amplification technology for rapid and simultaneous detection of tuberculosis and rifampicin resistance: Xpert MTB/RIF assay for the diagnosis of pulmonary and extrapulmonary TB in adults and children. Policy update. Geneva: World Health Organization, 2013. - PubMed

Publication types