. 2015 Dec;5(12):1296-313.
doi: 10.1158/2159-8290.CD-15-0068. Epub 2015 Oct 7.

A Cross-Species Analysis in Pancreatic Neuroendocrine Tumors Reveals Molecular Subtypes with Distinctive Clinical, Metastatic, Developmental, and Metabolic Characteristics

Affiliations

A Cross-Species Analysis in Pancreatic Neuroendocrine Tumors Reveals Molecular Subtypes with Distinctive Clinical, Metastatic, Developmental, and Metabolic Characteristics

Anguraj Sadanandam et al. Cancer Discov. 2015 Dec.

Abstract

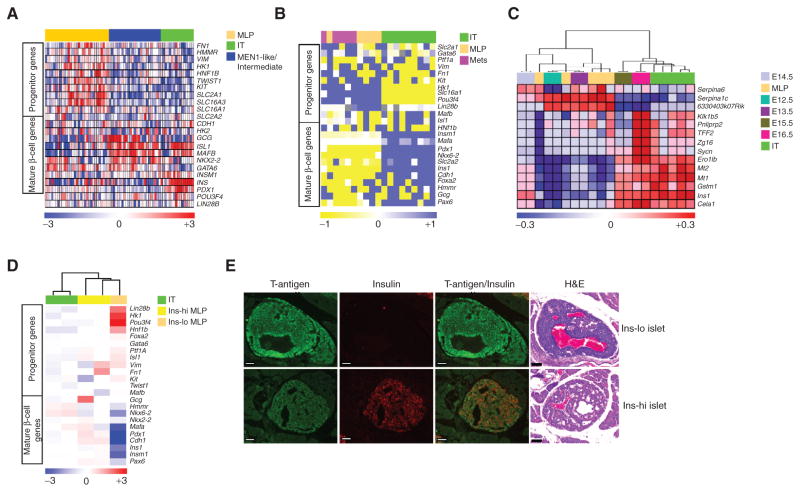
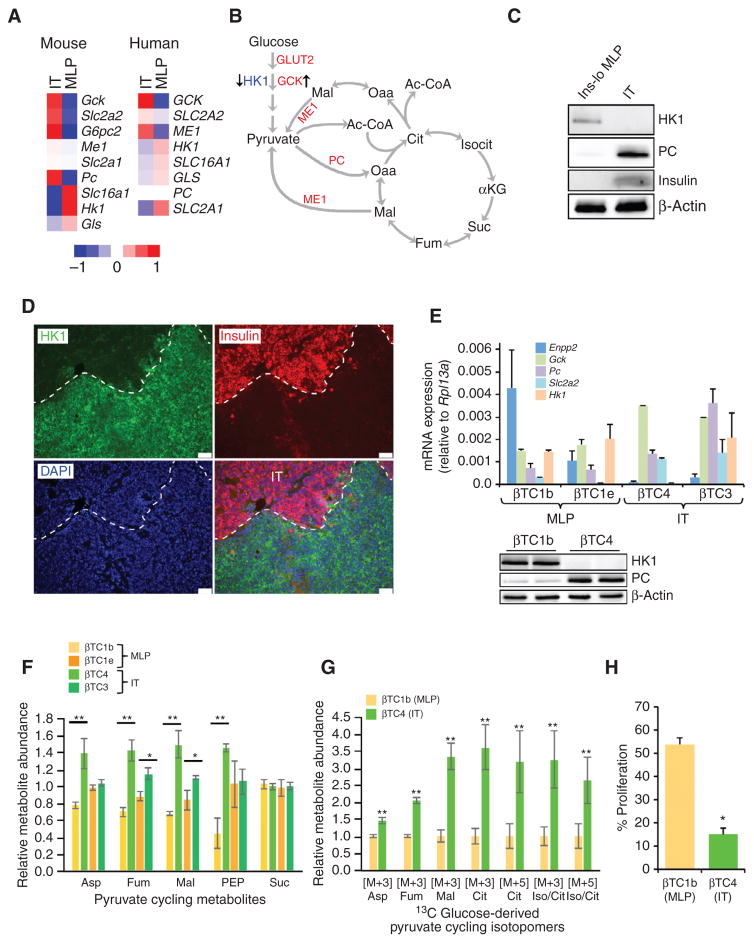
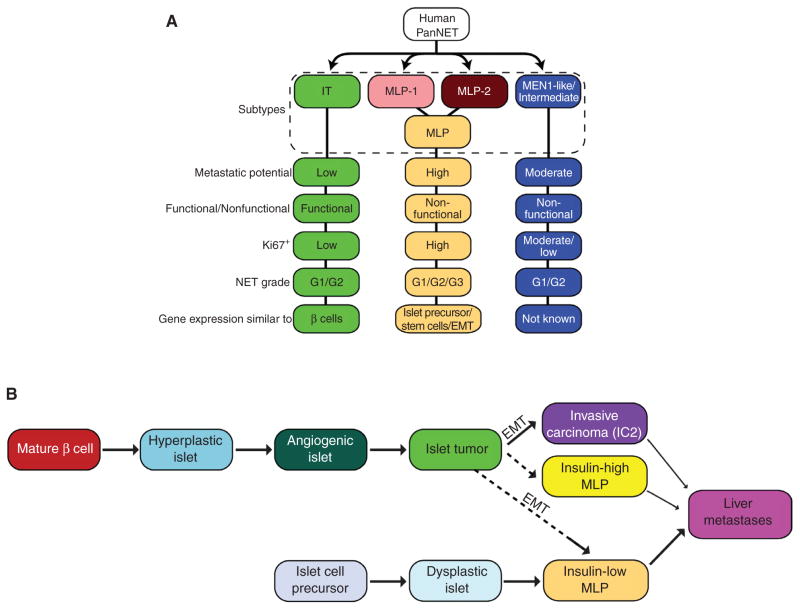
Seeking to assess the representative and instructive value of an engineered mouse model of pancreatic neuroendocrine tumors (PanNET) for its cognate human cancer, we profiled and compared mRNA and miRNA transcriptomes of tumors from both. Mouse PanNET tumors could be classified into two distinctive subtypes, well-differentiated islet/insulinoma tumors (IT) and poorly differentiated tumors associated with liver metastases, dubbed metastasis-like primary (MLP). Human PanNETs were independently classified into these same two subtypes, along with a third, specific gene mutation-enriched subtype. The MLP subtypes in human and mouse were similar to liver metastases in terms of miRNA and mRNA transcriptome profiles and signature genes. The human/mouse MLP subtypes also similarly expressed genes known to regulate early pancreas development, whereas the IT subtypes expressed genes characteristic of mature islet cells, suggesting different tumorigenesis pathways. In addition, these subtypes exhibit distinct metabolic profiles marked by differential pyruvate metabolism, substantiating the significance of their separate identities.

Significance: This study involves a comprehensive cross-species integrated analysis of multi-omics profiles and histology to stratify PanNETs into subtypes with distinctive characteristics. We provide support for the RIP1-TAG2 mouse model as representative of its cognate human cancer with prospects to better understand PanNET heterogeneity and consider future applications of personalized cancer therapy.


Conflict of interest statement

Disclosure of Potential Conflicts of Interest

L.C. Cantley serves on the Board of Directors of Agios Pharmaceuticals. No potential conflicts of interest were disclosed by the other authors.

One of the Editors-in-Chief of Cancer Discovery is an author of this article. In keeping with the AACR’s editorial policy, the paper was peer reviewed and an AACR journal editor not affiliated with Cancer Discovery rendered the decision concerning acceptability.

Figures

Figure 1
Figure 1
miRNA expression subtypes in human PanNET and their similarity to mouse MLP PanNET. Heatmaps of human PanNET samples showing (A) three miRNA expression subtypes as defined using NMF and (B) the expression of previously identified RT2 mouse MLP-specific miRNAs (from Olson and colleagues; ref. 28) in the three human PanNET subtypes defined in A. In both cases, the columns represent individual human tumors. In A, the rows indicate 30 differentially expressed miRNAs from 40 samples. In the rainbow bar below the heatmap, red indicates elevated expression, blue decreased, and white no change. (Supplementary Table S1A also lists the miRNAs in the same order as the columns in part A.) The miRNAs shown in A and Supplementary Table S1A constitute a signature, designated as the “PanNETassigner-miR signature” (genes were selected using SAM analysis with a delta value, Δ = 1.3 and a false discovery rate, FDR < 0.05).
Figure 2
Figure 2
Gene expression subtypes and cross-species analysis of human and mouse PanNETs. A, heatmap of human PanNET samples showing subtypes defined by gene expression differences, and the association of these subtypes with distant metastasis and clinical syndrome. The subtypes are defined by sets of genes—signatures—that are listed in the same order in Supplementary Table S1C and labeled as “PanNETassignermRNA signatures” (genes were selected using SAM analysis with Δ = 11.1 and FDR < 0.05). ACTH represents ectopic adrenocorticotropic hormonesecreting tumor. B, the heatmap shows genes (listed in Supplementary Table S1D) that were commonly expressed/repressed in human MLP-1 and MLP-2 subtypes and inversely expressed in tumors of the other two subtypes (genes were selected using SAM analysis with Δ = 1.7 and FDR < 0.05). C, enrichment of miRNA subtype samples in gene expression subtype samples was assessed using the hypergeometric test (red represents a significant enrichment of samples between miRNA and gene expression subtypes with FDR < 0.05). D, a bar plot displays the total number of miRNA subtype samples in each gene expression subtype. E and F, heatmaps of RT2 mouse PanNET samples showing gene expression profile differences. E, the distinct stages of tumorigenesis in the RT2 mouse model are shown, including IT, MLP, and liver metastasis (mets) samples. Genes (908 genes selected with SD > 0.8, and highest variable probe across samples in the cases where multiple probes per gene were present) and samples are listed in the same order in Supplementary Table S1F. F, mRNAs that clearly delineate the two subtypes—IT and MLP—are shown. The rows indicate 394 differentially expressed genes (genes were selected using SAM analysis with Δ = 0.6 and FDR < 0.05) among the profiled genes of 10 samples. These genes define “m-PanNETassigner-mRNA” signature, with the individual genes listed in the same order in Supplementary Table S1G. G, heatmap showing cross-species analysis and association of human and mouse PanNET subtypes using ComBat-merged gene expression profiles of RT2 mouse (n = 10) and patient (n = 72) PanNET samples. In all the heatmaps, the rows indicate differentially expressed genes (Supplementary Table S1H) among the profiled gene expression data. In the rainbow bar beneath the heatmaps, red indicates elevated expression, blue decreased, and white no change.
Figure 3
Figure 3
Mutation changes and biomarker expression in human and mouse PanNET subtypes. A, a summary of MEN1, DAXX/ATRX, mTOR pathway (PTEN/TSC2) and ATM gene mutations in human PanNET subtypes. P values correspond to the Fisher exact test. ns, not significant. B, visualization of different histologic subtypes of RT2 tumors with hematoxylin and eosin (H&E) staining, and immunostaining for the driving oncoprotein (SV40 T-antigen) and insulin. Images are representative of the analysis from 60 tumor-bearing RT2 B6, B6AF1, and B6D2F1 mice (see Methods section for different strains of the RT2 mouse model). Scale bar, 200 μm. C, heatmap showing median expression of MLP-specific genes (biomarkers) in distinct stages of the RT2 mouse model of PanNET. N, normal islet; H, hyperplastic/dysplastic islet; and A, angiogenic islet. D and E, expression of PanNET subtype genes in five different laser capture microdissection–derived (LCMD) samples from tissue sections of tumors representing IT, Ins-hi MLP, and Ins-lo MLP subtypes using (D) RT-PCR (Ins1 and Enpp2) and (E) microarray (multiple PanNET subtype genes) methodologies. In D, * represents statistical P value < 0.05 as measured using the Student t test comparing relative Ins1 or Enpp2 expression in IT versus Ins-hi and Ins-lo MLP tumors. F, visualization of different histologic subtypes of RT2 tumors within a single pancreas by immunostaining for ENPP2 and insulin protein expression. Images are representative of the analysis from 8 tumor-bearing RT2 mice. Scale bar, 50 μm. G, ENPP2 and insulin protein expression in human PanNETs as assessed using IHC. DAPI (4′,6-diamidino-2-phenylindole) staining represents cellular nucleus. Scale bar, 50 μm.
Figure 4
Figure 4
Vascular and proliferative characteristics of human and mouse PanNETs. A, CD31 (top) and Ki67 (bottom) staining in RT2 tumor subtypes. Images are representative of the analysis of 60 tumor-bearing RT2 B6, B6AF1, and B6D2F1 mice (see Methods section for different strains of the RT2 mouse model). In the top plot, blue represents CD31, pink represents nucleus, and scale bar represents 200 μm; in the bottom plot, red represents Ki67, blue represents nucleus, and scale bar represents 100 μm. B and C, quantification of CD31-positive blood vessels (B) and Ki67-positive tumor cells (C) in different subtypes of RT2 tumor subtypes. The quantitation is representative of the analysis of 10 random fields from 10 different tumor-bearing RT2 B6, B6AF1, and B6D2F1 mice from the analysis illustrated in A. D, percentage of Ki67-positive cells in human PanNET subtypes (from the samples of the core clinical gene expression dataset; see Methods section for detailed description about quantitation). * represents statistical P value < 0.05 as measured using the Student t test comparing IT versus Ins-hi MLP and IT versus Ins-lo MLP. Error bars in the graphs represent SD. E, identifiable percentage and summary (number of samples in the table) of NET grades in human Pan-NET subtypes. NET grades are significantly (P < 0.05; Fisher exact test) associated with PanNET subtypes.
Figure 5
Figure 5
Stem cell and differentiated phenotypes of PanNET subtypes. A and B, heatmaps showing differential expression of genes that distinguish islet progenitor cells from differentiated β cells, as well as metabolic pathway genes (including metabolic genes that are disallowed in mature β cells; ref. 46) showing differential expression, in PanNET samples from (A) human and (B) mouse. Human PanNET data are from gene expression microarrays, whereas mouse PanNET data are from RT-PCR analysis. The relative (to housekeeping gene PPIA) gene expression from mouse PanNET RT-PCR data was multiplied by 10,000 units before performing the heatmap analysis. Gray color in the heatmap of B represents not available value. C, heatmap comparing the ComBat-merged gene expression profile datasets of IT and MLP subtypes from the RT2 mouse model versus embryonic pancreas (from stages e12.5 to e16.5; data from GSE8070). D, heatmap showing differential expression of genes (measured using microarrays) distinguishing islet progenitor cells from differentiated β cells, as well as variably expressed metabolic pathway genes, in mouse LCM-derived tissue samples from IT, Ins-hi MLP, and Ins-lo MLP PanNET tumor sections, from Fig. 3D and E. E, hyperplastic/dysplastic islets in pancreas tissue sections from RT2 mice showing regions of Ins-lo (top) and Ins-hi (bottom) islets, as visualized with hematoxylin and eosin (H&E) and insulin staining. Images are representative of the analysis from 12 tumor-bearing RT2 mice (8–10 weeks of age). Scale bar, 50 μm.
Figure 6
Figure 6
Metabolic characteristics of PanNET subtypes. A, heatmap showing median expression of metabolic genes that are differentially expressed in human and mouse IT versus MLP subtypes. The comparisons involved 5 IT and 5 MLP tumors from the mouse model, and 16 IT and 31 MLP from humans. B, a simplified model of glycolysis and the tricarboxylic acid cycle, overlaid with the pyruvate cycle (arrows in green), highlighting genes upregulated (in red) and downregulated (in blue) in the IT subtype compared with the MLP subtype. C and D, protein expression in IT and Ins-lo MLP determined by immunoblot for HK1, PC, and Insulin (C) and IHC for HK1 and Insulin (D). Scale bars, 50 μm. DAPI staining represents cellular nucleus. E, expression of MLP-specific genes in mouse PanNET cancer cell lines (βTC) representing different subtypes of PanNET. The gene expression is relative to the expression of a housekeeping gene, Rpl13a (top). Immunoblot analysis of βTC cells using antibodies against HK1, PC, and β-actin (bottom). F and G, relative abundance of pyruvate cycle metabolites in mouse PanNET subtype-specific cell lines cultured under normal conditions (F) or in the presence of 13 C-labeled glucose (G). Metabolites in F are median-centered across samples for each metabolite, and this was done separately for two different (batches of) metabolic profiling experiments either using βTC1b (MLP)/βTC4 (IT) or βTC1e (MLP)/βTC3 (IT); and labeled metabolites in G are normalized to their characteristically lower level in the MLP subtype. The M+3 isotopomers of aspartate (Asp), malate (Mal), fumarate (Fum), citrate (Cit), and isocitrate (Iso/Cit) are biosynthesized from glucose by way of PC. The M+5 species of Cit and Iso/Cit are M+3 labeled by PC. H, proliferation of IT versus MLP cancer cell lines in the absence of glucose in the media. * (comparison between βTC1e and βTC3) or ** (comparison between βTC1b and βTC4) represents statistical P value < 0.05 as measured using the Student t test. Error bars in the graphs represent SD or SEM.
Figure 7
Figure 7
A new view of PanNET tumor heterogeneity. A, summary of human PanNET subtypes and their characteristics. B, a revised schematic of the parallel pathways of PanNET tumorigenesis, evidently with distinctive cells of origin, leading to the IT and MLP subtypes, as revealed in the RT2 mouse model, and inferred in the human from the concordance of transcriptomic and phenotypic data presented for mouse and human PanNET.

References

    1. Hanahan D, Wagner EF, Palmiter RD. The origins of oncomice: a history of the first transgenic mice genetically engineered to develop cancer. Genes Dev. 2007;21:2258–70. - PubMed
    1. Hanahan D. Heritable formation of pancreatic beta-cell tumours in transgenic mice expressing recombinant insulin/simian virus 40 oncogenes. Nature. 1985;315:115–22. - PubMed
    1. Hanahan D. Dissecting multistep tumorigenesis in transgenic mice. Annu Rev Genet. 1988;22:479–519. - PubMed
    1. Folkman J, Watson K, Ingber D, Hanahan D. Induction of angiogenesis during the transition from hyperplasia to neoplasia. Nature. 1989;339:58–61. - PubMed
    1. Christofori G, Naik P, Hanahan D. A second signal supplied by insulin-like growth factor II in oncogene-induced tumorigenesis. Nature. 1994;369:414–8. - PubMed

Publication types

MeSH terms