. 2015 Oct 7;35(40):13629-47.
doi: 10.1523/JNEUROSCI.4041-14.2015.

Regulated Dynamic Trafficking of Neurexins Inside and Outside of Synaptic Terminals

Affiliations

Regulated Dynamic Trafficking of Neurexins Inside and Outside of Synaptic Terminals

Christian Neupert et al. J Neurosci. .

Abstract

Synapses depend on trafficking of key membrane proteins by lateral diffusion from surface populations and by exocytosis from intracellular pools. The cell adhesion molecule neurexin (Nrxn) plays essential roles in synapses, but the dynamics and regulation of its trafficking are unknown. Here, we performed single-particle tracking and live imaging of transfected, epitope-tagged Nrxn variants in cultured rat and mouse wild-type or knock-out neurons. We observed that structurally larger αNrxn molecules are more mobile in the plasma membrane than smaller βNrxns because αNrxns displayed higher diffusion coefficients in extrasynaptic regions and excitatory or inhibitory terminals. We found that well characterized interactions with extracellular binding partners regulate the surface mobility of Nrxns. Binding to neurexophilin-1 (Nxph1) reduced the surface diffusion of αNrxns when both molecules were coexpressed. Conversely, impeding other interactions by insertion of splice sequence #4 or removal of extracellular Ca(2+) augmented the mobility of αNrxns and βNrxns. We also determined that fast axonal transport delivers Nrxns to the neuronal surface because Nrxns comigrate as cargo on synaptic vesicle protein transport vesicles (STVs). Unlike surface mobility, intracellular transport of βNrxn(+) STVs was faster than that of αNrxns, but both depended on the microtubule motor protein KIF1A and neuronal activity regulated the velocity. Large spontaneous fusion of Nrxn(+) STVs occurred simultaneously with synaptophysin on axonal membranes mostly outside of active presynaptic terminals. Surface Nrxns enriched at synaptic terminals where αNrxns and Nxph1/αNrxns recruited GABAAR subunits. Therefore, our results identify regulated dynamic trafficking as an important property of Nrxns that corroborates their function at synapses.

Significance statement: Synapses mediate most functions in our brains and depend on the precise and timely delivery of key molecules throughout life. Neurexins (Nrxns) are essential synaptic cell adhesion molecules that are involved in synaptic transmission and differentiation of synaptic contacts. In addition, Nrxns have been linked to neuropsychiatric diseases such as autism. Because little is known about the dynamic aspects of trafficking of neurexins to synapses, we investigated this important question using single-molecule tracking and time-lapse imaging. We identify distinct differences between major Nrxn variants both in surface mobility and during intracellular transport. Because their dynamic behavior is highly regulated, for example, by different binding activities, these processes have immediate consequences for the function of Nrxns at synapses.

Keywords: GABA(A) receptors; autism; imaging; neuroligin; quantum dots; synapse function.


Figures

Figure 1.
Figure 1.
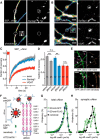
FRAP measurements and single-particle tracking reveal mobile epitope-tagged Nrxn molecules at the cell surface of primary rat hippocampal neurons. A, Example of pHluorin(SEP)-Nrxn1α FRAP (circles indicate FRAP region, boxes show recovery after 60 s). This sample shows a putatively excitatory synapse identified by anti-synaptotagmin1 (Syntag1), but not anti-VGAT uptake. B, Example for Nrxn1α FRAP at a Syntag1 and VGAT+ putatively inhibitory terminal. Scale bars, 3 μm. C, Recovery curves of αNrxn fluorescence corrected for steady-state photobleach during acquisition normalized to control fluorescent levels. Gray trace represents an extrasynaptic axonal region, blue a Syntag1+ region, and red a Syntag1/VGAT+ region. D, Quantification of FRAP after 60 s for transfected SEP_Nrxn1α and SEP_Nrxn1β at axons (gray bars) and at excitatory (blue) or inhibitory (red) synapses. Data are means ± SEM collected from 6–25 synapses/FRAP regions from 3–6 cells of 3 independent cultures. Differences were tested by a one-way ANOVA followed by Newman–Keuls test. **p < 0.01. E, Sample images of axonal segments transfected with GFP_αNrxn (green) and synapses identified by Syntag1-uptake (magenta). Arrows indicate synaptic contacts. Analysis of the localization of QD- (top) or nanobody-ATTO647N (bottom)-labeled αNrxns reveals only a slight accumulation of molecules in synapses. Scale bars, 5 μm. FH, Single-particle tracking of exogenous αNrxns performed with QD or nanobodies after transfection of neurons with EGFP/SEP- or Flag-tagged Nrxn1α. Sizes in the legend of the diagram (left) are approximately to scale. F, Logarithmic distribution of the surface diffusion coefficient of total αNrxn (G) and of synaptically localized αNrxn (H) tracked by QD-coupled antibodies against GFP or Flag epitopes and by nanobodies against GFP. Data were collected from 6 cells of 3 independent cultures.
Figure 2.
Figure 2.
αNrxns and βNrxns diffuse with distinct surface mobilities extrasynaptically and within excitatory or inhibitory synapses. A, B, Colabeling of Nrxn1α (A) or Nrxn1β (B) surface populations on transfected rat hippocampal neurons with anti-Syntag1 and anti-VGAT to identify glutamatergic and GABAergic axons and synapses. Scale bars, 10 μm. C, D, Sample trajectories of QD-tracked single αNrxn (C) and βNrxn (D) molecules at positions indicated by arrows in (A, B). Logarithmic distribution of diffusion coefficients for αNrxn (E), βNrxn (F), and cotransfected Nxph1/αNrxn complex (G) on axons outside synapses (black), inside excitatory (blue), and inside inhibitory (red) synapses. H, Median and IQR (25–75%) of diffusion coefficients with total numbers of analyzed trajectories indicated in bars. Statistical significance was tested by Kruskal–Wallis test followed by a Dunn's test. I, J, Dwell-time index (I) and probability of confinement (J) of αNrxns, βNrxns, and the Nxph1/αNrxn complex reveal higher affinity of αNrxns and Nxph1/αNrxn to inhibitory terminals (red) compared with excitatory presynapses (blue). Numbers in bars (HJ) represent analyzed Nrxn+ synapses from 3–10 rat neuronal cultures and 4–27 cells. Data in I and J are expressed as means ± SEM and statistical significance was assessed by one-way ANOVA variance followed by Newman–Keuls test. **p < 0.001, ***p < 0.0001. KM, Comparison of surface mobility in hippocampal neurons from WT mice and TKOs lacking endogenous αNrxns. Diffusion coefficients for αNrxns in excitatory (blue) and inhibitory (red) terminals of WT (solid line) and TKO (dashed) neurons (K). Surface mobility was analyzed in transfected WT (L) and TKO (M) mouse neurons as in H. Numbers in bars (L, M) represent the total number of analyzed trajectories from 2–3 mouse hippocampal cultures with 5–17 neurons per genotype.
Figure 3.
Figure 3.
Surface mobility of Nrxns depends on alternative splicing and extracellular Ca2+ concentration. A, B, Comparison of mobility between Nrxn1α without insert in SS4 (beige in scheme A, −SS4 in B) and with insert (SS4 orange in scheme A, +SS4 in B) and of Nrxn1β±SS4, measured by SPT. Extracellular domains are replaced by EGFP to have a reference for maximal diffusion dynamics (NrxnΔEC). Chelation of extracellular calcium with 10 mm EGTA (magenta) is used to assess the general effect of Ca2+-dependent binding activities, for example, with postsynaptic Nlgn (green in schemes). Ca2+ coordination of the LNS6 domain alone is impaired in the point mutation D1183A (αNrxn (DA; Reissner et al., 2008). C, D, Similar experiment as in A and B, but probing the effect of complex formation of αNrxn ± SS4 with cotransfected Nxph1 (red in schemes) on surface mobility. In B and D, the median and IQR (25–75%) of diffusion coefficients with total numbers of analyzed trajectories are indicated in bars. Statistical significance was tested by Kruskal–Wallis test followed by a Dunn's test. ***p < 0.0001.
Figure 4.
Figure 4.
Nxph1 requires coexpression with αNrxns for targeting but not vice versa. A, GFP-tagged Nxph1, when transfected alone, accumulates inside heterologous HEK293 cells and is not detected extracellularly at the cell surface by live labeling with antibodies against Nxph1 (top). Cotransfection of GFP-Nxph1 with a Flag-tagged full-length Nrxn1α results in a ring-like staining pattern of colocalized Nxph1/αNrxn by live labeling with antibodies to the Flag_Nrxn1α and Nxph1 moieties (middle panels). Mutation of a key binding residue in αNrxn (I401D; Reissner et al., 2014) prevents surface delivery of Nxph1 (bottom). Scale bar, 20 μm. B, Sample images of pHluorin(SEP)_Nxph1 (left; scale bar, 20 μm) and SEP_Nxph1/αNrxn (right; scale bar, 5 μm) cotransfected into primary neurons under control buffer conditions at pH 5.0 and after NH4Cl treatment to equilibrate intracellular and extracellular pH at 7.4. C, Nxph1 coexpressed with αNrxns is detected at the cell surface independently of which moiety carries the pHluorin. Quantification of surface fluorescence within axons in (%) of the total fluorescence is shown. Data are means ± SEM collected from 2–14 cells of 2–3 hippocampal cultures at DIV 14–21. D, E, Complex formation with Nxph1 decreases the surface mobility of αNrxns at synapses. Median and IQR (25–75%) of diffusion coefficients (D) and probability of confinement (E) of cotransfected Nxph1/αNrxn complexes are shown, in which either αNrxns or Nxph1 carried the EGFP tag. Total numbers of analyzed trajectories are indicated in bars. Statistical significance in CE is tested by Kruskal–Wallis test followed by a Dunn's test. *p < 0.05, ***p < 0.0001.
Figure 5.
Figure 5.
Intracellular Nrxn+ transport vesicles colocalize with marker molecules of STVs. AD, Examples of Nrxn1α+ transport vesicles migrating within axons (B, marked area in A) and dendrites (C, marked area in A) in primary hippocampal neurons. Their velocity was determined from respective kymographs as in D. Scale bars: A, 20 μm; B, C, 5 μm. EJ, GFP_αNrxn+ transport vesicles colocalized strongly with STV marker proteins as synapsin (E) and synaptotagmin1 (F) and also with Nrxn1β (G). Double labeling of GFP_αNrxn with Mint1 (H), the synaptic vesicle precursor Rab3a, and chromogranin-A as a DCV component (J) was less apparent. Scale bar in F3, 10 μm. K, Degree of colocalization was expressed as percentage overlap with GFP_αNrxn using ImageJ. Data are expressed as means ± SEM and were derived from a total of 671 neurons/38 transfected cultures.
Figure 6.
Figure 6.
Distinct velocities and regulation of αNrxn- and βNrxn+ STVs. AC, Example of GFP_Nrxn1α comigrating with mCherry_synaptophysin at the speed of fast axonal transport in axons of primary hippocampal neurons. D, E, No comigration and different speed was observed with cotransfected bassoon as marker protein of PTVs. Scale bar, 5 μm. F, Comparison of comigrating αNrxn/synaptophysin and βNrxn/synaptophysin+ STVs in axons (gray bars) and dendrites (black bars). G, Comparison of αNrxn/synaptophysin mobility in control (WT) and TKO neurons lacking all endogenous αNrxn. H, αNrxn+ STVs migrate faster than bassoon+ PTVs when cotransfected into the same neurons. IK, Coexpression of Nxph1 with αNrxn has no effect on the velocity of intracellular traffic in axons and dendrites. LO, Kymographs and average velocities of Nrxn+ STVs under control conditions and after incubation with TTX or K+ to modulate neuronal activity. Data in FH, K, N, and O are expressed as means ± SEM and were derived from a total of >220 neurons/24 transfected cultures. Statistical significance was tested by Student's t test. ***p < 0.001.
Figure 7.
Figure 7.
αNrxn and βNrxn transport depends on the microtubule motor protein KIF1A. A, B, Average velocities of Nrxn1α+ and Nrxn1β+ STVs under control conditions and after preincubation with DMSO (solvent control), latrunculin-A, and nocodazol to block F-actin (LatA) or microtubule (Noco) polymerization. CF, Nrxn+ STVs comigrate with transfected GFP_KIF1A at velocities similar to Nrxn/synaptophysin vesicles (Fig. 6F). Scale bar, 5 μm. G, High degree of colocalization between αNrxn+ and βNrxn+ STVs and endogenous KIF1A labeled by antibody (left bars) or transfected GFP_KIF1A (right bars). H, shRNA-mediated knock-down of KIF1A (H1) leads to accumulation of αNrxn in soma and initial segments (H2). IK, Expression of shRNA-resistent myc-KIF1A (I1) is able to rescue the knock-down and reinstate localization (I2) and velocities of αNrxn+ (J) and βNrxn+ (K) STVs. Scale bar, 20 μm. Data in A, B, F, G, J, and K are expressed as means ± SEM and were derived from a total of >264 neurons/27 transfected cultures. Statistical significance was tested by Student's t test. ***p < 0.001.
Figure 8.
Figure 8.
Synchronous surface delivery of Nrxn and synaptophysin outside of active terminals. A, B, Sample images of spontaneous plasma membrane fusion of pHluorin(SEP)_Nrxn1α in two different regions (R1, R2) on an axon of transfected primary neurons. The fusion events occur at different time points after bleaching the area with a 405 nm laser (FRAP). Scale bar, 20 μm. Changes of fluorescence intensity over time were recorded at DIV14 and expressed as ΔF/F0 after substraction of background, facilitating recognition of fusion events (B). C, D, In neurons cotransfected with pHluorin_Nrxn1α and pHTomato_synaptophysin (C), both molecules appear simultaneously and with similar kinetics at the axonal surface (D), indicating fusion of αNrxn/synaptophysin+ STVs. EH, GCaMP6f Ca2+ indicator (E) and pHTomato_synaptophysin (G) cotransfected into primary neurons. Changes of fluorescence intensity over time reliably detect Ca2+ influx upon repetitive stimulation (F; recorded from R1). Fusion events of STVs appeared outside of active terminals and independent of stimulation/ Ca2+ influx (H; recorded from R2, arrow labels STV fusion). Scale bar, 5 μm.
Figure 9.
Figure 9.
Enrichment of Nrxns and the Nxph1/αNrxn complex at synapses. A, Sample images of pHluorin(SEP)_Nrxn1α+ axons of glutamatergic and GABAergic neurons. Strong accumulation of αNrxns seen at VGAT/Syntag1+ putatively inhibitory terminals compared with Syntag1+ putatively excitatory synapses is supported by corresponding line scans (right panels). Scale bar, 10 μm. B, Enrichment of αNrxns, βNrxns, and the Nxph1/αNrxn complex at excitatory (blue) and inhibitory (red) synapses normalized to extrasynaptic axonal sites (set to 1). Data are means ± SEM and were collected from 3 different cultures for each construct with number of analyzed synapses indicated in bars. Statistical significance was tested by a one-way ANOVA test followed by a Keuls–Newman post test. ***p < 0.0001, **p < 0.001.
Figure 10.
Figure 10.
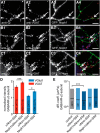
αNrxns and the Nxph1/αNrxn complex are effective in recruiting GABAAR subunits to synapses. AC, Primary hippocampal neurons transfected with the pHluorin(SEP)_Nxph1/αNrxn complex or SEP_αNrxns alone are colabeled against GABAARγ2, and VGAT or VGlut1 to distinguish inhibitory from excitatory terminals. Scale bar, 10 μm. D, αNrxns and the Nxph1/αNrxn complex cause enrichment of GABAARγ2 subunits at inhibitory synapses (red) and Nxph1/αNrxn also at excitatory synapses (blue). Data are shown as means ± SEM, with the number of analyzed transfected and nontransfected (in paranthesis) synapses shown in bars. Statistical significance was tested by one-way ANOVA variance test followed by Newman–Keuls test. *p < 0.05, ***p < 0.0001. E, SPT with QD-labeled antibodies against endogenous GABAARγ2 on axons of neurons transfected with αNrxns or the Nxph1/αNrxn complex (± insert at SS4). Coexpression of Nxph1 decreases diffusion coefficients of GABAARγ when the insert is present in αNrxn (+SS4). Data are shown as median plus IQR (25–75%) and were collected from 3 independent cultures. Significance was tested by a Kruskal–Wallis test followed by a Dunn's test. ***p < 0.0001.

References

    1. Ahmari SE, Buchanan J, Smith SJ. Becausesembly of presynaptic active zones from cytoplasmic transport packets. Nat Neurosci. 2000;3:445–451. doi: 10.1038/74814. - DOI - PubMed
    1. Anggono V, Huganir RL. Regulation of AMPA receptor trafficking and synaptic plasticity. Curr Opin Neurobiol. 2012;22:461–469. doi: 10.1016/j.conb.2011.12.006. - DOI - PMC - PubMed
    1. Aoto J, Martinelli DC, Malenka RC, Tabuchi K, Südhof TC. Presynaptic neurexin-3 alternative splicing trans-synaptically controls postsynaptic AMPA receptor trafficking. Cell. 2013;154:75–88. doi: 10.1016/j.cell.2013.05.060. - DOI - PMC - PubMed
    1. Bannai H, Lévi S, Schweizer C, Inoue T, Launey T, Racine V, Sibarita JB, Mikoshiba K, Triller A. Activity-dependent tuning of inhibitory neurotransmission based on GABAAR diffusion dynamics. Neuron. 2009;62:670–682. doi: 10.1016/j.neuron.2009.04.023. - DOI - PubMed
    1. Beglopoulos V, Montag-Sallaz M, Rohlmann A, Piechotta K, Ahmad M, Montag D, Missler M. Neurexophilin 3 is highly localized in cortical and cerebellar regions and is functionally important for sensorimotor gating and motor coordination. Mol Cell Biol. 2005;25:7278–7288. doi: 10.1128/MCB.25.16.7278-7288.2005. - DOI - PMC - PubMed

Publication types

MeSH terms

LinkOut - more resources