. 2012 Jan 27:5:1-19.
doi: 10.4137/JCD.S9073. eCollection 2012.

RBM10 Modulates Apoptosis and Influences TNF-α Gene Expression

Affiliations

RBM10 Modulates Apoptosis and Influences TNF-α Gene Expression

Ke Wang et al. J Cell Death. .

Abstract

Recent evidence suggests that protein encoded by the RNA Binding Motif 10 (RBM10) gene has the ability to modulate apoptosis. The objective of this study was to test this hypothesis by manipulating RBM10 expression levels and examining the downstream consequences. The results showed that transient overexpression of RBM10 correlated with significantly elevated levels of tumour necrosis factor alpha (TNF-α) mRNA and soluble TNF-α (sTNF-α) protein, and increased apoptosis (phosphatidyl serine exposure on the outer cell membrane and nuclear condensation). Stable RNA interference-mediated RBM10 knockdown clones were less susceptible to TNF-α-mediated apoptosis, and had decreased sTNF-α protein levels. Elevated levels of TNF-α associated with RBM10 overexpression resulted from increased TNF-α transcription, not TNF-α mRNA stabilization. These results suggest that RBM10 has the ability to modulate apoptosis, and that it does so via a mechanism involving alterations to TNFR super family-mediated signaling. These data provide the first direct evidence that human RBM10 can function as an apoptosis modulator and cytokine expression regulator.

Keywords: RBM10; RBM5; TNF-alpha; apoptosis; cancer; transcription.


Figures
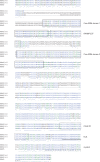
Figure1
Figure1
RBM5 and RBM10 have significant sequence homology. Amino acid sequences, Accession numbers NM_005676, NM_152856 and NM_005778 for RBM10v1, RBM10v2 and RBM5, respectively, were aligned using the multiple sequence alignment program CLUSTALW 1.18, with default settings. Consensus key: (*) fully conserved residue; (:) conservation of strong groups; (.) conservation of weak groups. Boxed sequences with solid lines represent the core RRM domains, boxed sequences with hatched lines represent zinc finger (ZF) sequences, the solid underlining delineates the nuclear localization sequence and the hatched underlining delineates the G-patch. Pair wise alignments found RBM10v1 and RBM10v2 to have 100% sequence homology, excluding exon 4 of RBM10v1; RBM10v2 and RBM5 to have 55% sequence homology, and; RBM10v1 and RBM5 to have 53% sequence homology.
Figure 2
Figure 2
Luciferase activity measured in Jurkat and MCF-7 cells, 48 hrs after co-transfection of pGL3-TNFPro-UTR with pEGFP, pEGFP.RBM10v1 or pEGFP.RBM10v2. Differing transfection efficiencies were accounted for by normalizing the luciferase levels to the level of GFP. Data were from three transfection experiments per cell line. Notes: Significance was measured using an unpaired Student’s t-test, where *P = 0.04 and ***P ≤ 0.0001.
Figure 3
Figure 3
Apoptosis is observed in RBM10 overexpressing Jurkat cells. Cells were transiently transfected with pEGFP, pEGFP.RBM10v1 or pEGFP. RBM10v2. (Ai) Nuclear condensation/fragmentation. Cells were harvested 72 hours following transfection, incubated with 10 μg/mL of Hoechst 33258 (which binds to DNA and causes cells with more compacted DNA to fluoresce more brightly), and visualized using fluorescence microscopy. Green = GFP protein, blue = Hoechst staining of nuclei. (Aii) Five fluorescence images were taken for each construct and intact nuclei were measured and scored. The total number of intact nuclei used for each transfected population was 68, 39 and 34, for empty vector, RBM10v1 and RBM10v2, respectively. (B) Phosphatidyl serine exposure. Cells were harvested 48 hours following transfection. PS flip to the outer nuclear membrane was monitored by staining the cells with PE-conjugated Annexin-V, which binds to PS, and propidium iodide, which is only able to enter membrane damaged cells, thereby enabling a distinction between early apoptosis and secondary apoptosis/necrosis. Results were gated to the GFP-expressing cells. Notes: Significance was measured using an unpaired Student’s t-test whereby * and ** equal P < 0.05 and P < 0.01, respectively. Data are presented as a flow cytometer dot plot. Quadrant B1, lysed cells and debris; B2, late apoptotic/necrotic cells; B3, live cells; B4, early apoptotic cells. Results are from one assay, but are representative of a minimum of six assays.
Figure 4
Figure 4
TNF-α-mediated apoptosis is inhibited in RBM10v1/v2 KD Jurkat cells. (Ai) Western blot data showing the level of RBM10 expression in various stable clonal populations. Western blots are representative of results from three separate lysates, each obtained from cell populations from three consecutive weeks of growth. (Aii) Graphed data summarizes the densitometric data obtained from the three separate Western blots for each clone. Error bars represent the standard error of the mean. (B) Flow cytometry data. Jurkat RBM10 KD clones J30.8, J30.16 and the control clone J300.2 were treated with 10 ng/mL TNF-α and 10 μg/mL cycloheximide. Following treatment, cells were stained with FITC-conjugated Annexin-V and propidium iodide, and examined by flow cytometry. (i) Dot blot of one representative experiment, where cells were treated for 4 hrs. (ii) Graphed, summarized dot blot data from 4 biological replicates, two with 4 hr treatments and two with 16 hr treatments. (C) ELISA data of sTNF-α protein expression in RBM10 KD Jurkat clone J30.16 (fold-expression changes were calculated from two independent experiments, performed as technical triplicates). The supernatant was collected 48 hours after routine passage. Notes: Significances were calculated using a Student’s unpaired t-test. *P < 0.05, **P < 0.005, ***P < 0.0001.
Figure 5
Figure 5
RBM10v1 increases TNF-α transcription. (Ai) TNF-α mRNA expression levels in Jurkat cells, measured using RT-qPCR and normalized to S28, 48 hrs after transfection with pEGFP or pEGFP.RBM10v1 and 4.5 hrs after treatment with 50 μM DRB or the equivalent volume of DMSO vehicle. Data are from one transfection analyzed in duplicate. (Aii) Verification of RBM10v1 overexpression in the transfectants, measured following RT-PCR in the DMSO control samples. Notes: Significances were calculated using a Student’s unpaired t-test. *P < 0.05, **P = 0.01, ***P < 0.01.

References

    1. Timmer T, Terpstra P, van den Berg A, et al. An evolutionary rearrangement of the Xp11.3–11.23 region in 3p21.3, a region frequently deleted in a variety of cancers. Genomics. 1999;60:238–240. - PubMed
    1. Bonnal S, Martinez C, Forch P, Bachi A, Wilm M, Valcarcel J. RBM5/Luca-15/H37 regulates Fas alternative splice site pairing after exon definition. Mol Cell. 2008;32:81–95. - PubMed
    1. Martinez-Arribas F, Agudo D, Pollan M, et al. Positive correlation between the expression of X-chromosome RBM genes (RBMX, RBM3, RBM10) and the proapoptotic Bax gene in human breast cancer. J Cell Biochem. 2006;97:1275–1282. - PubMed
    1. Martin-Garabato E, Martinez-Arribas F, Pollan M, Lucas AR, Sanchez J, Schneider J. The small variant of the apoptosis-associated X-chromosome RBM10 gene is co-expressed with caspase-3 in breast cancer. Cancer Genomics Proteomics. 2008;5:169–73. - PubMed
    1. James CG, Ulici V, Tuckermann J, Underhill TM, Beier F. Expression profiling of Dexamethasone-treated primary chondrocytes identifies targets of glucocorticoid signalling in endochondral bone development. BMC Genomics. 2007;(8):205. - PMC - PubMed

LinkOut - more resources