. 2015 Oct 8:5:14739.
doi: 10.1038/srep14739.

Network modelling reveals the mechanism underlying colitis-associated colon cancer and identifies novel combinatorial anti-cancer targets

Affiliations

Network modelling reveals the mechanism underlying colitis-associated colon cancer and identifies novel combinatorial anti-cancer targets

Junyan Lu et al. Sci Rep. .

Abstract

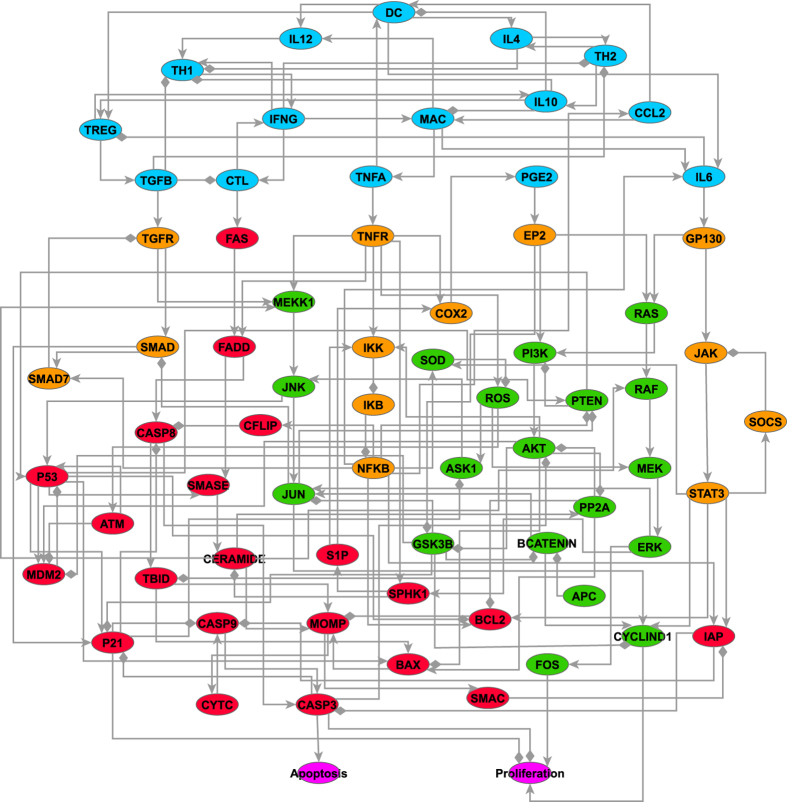
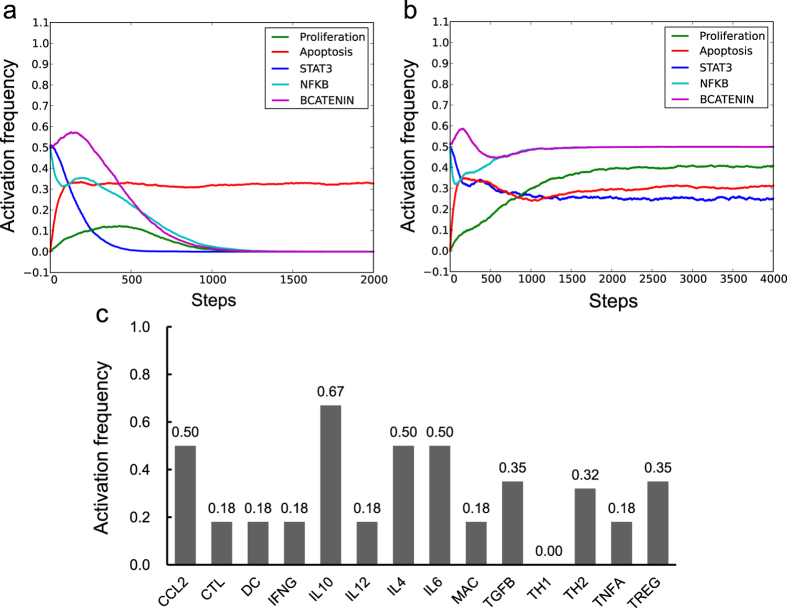
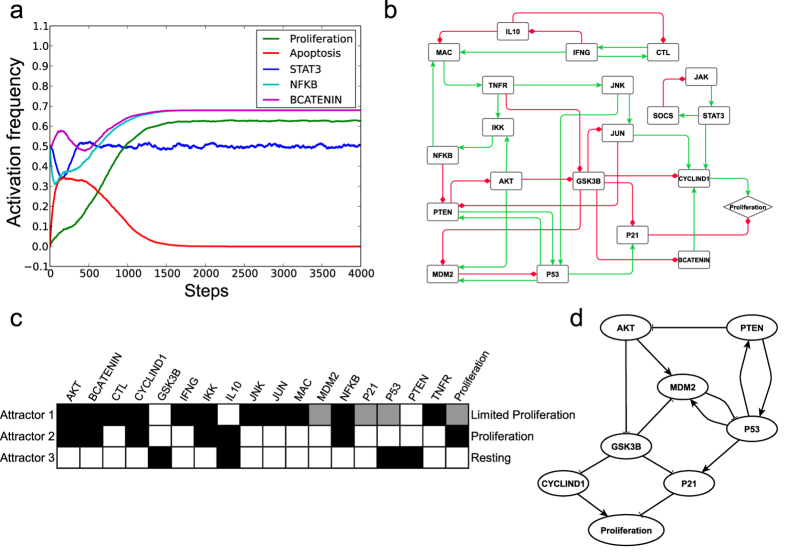
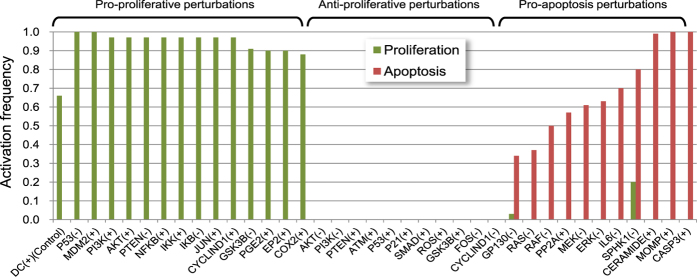
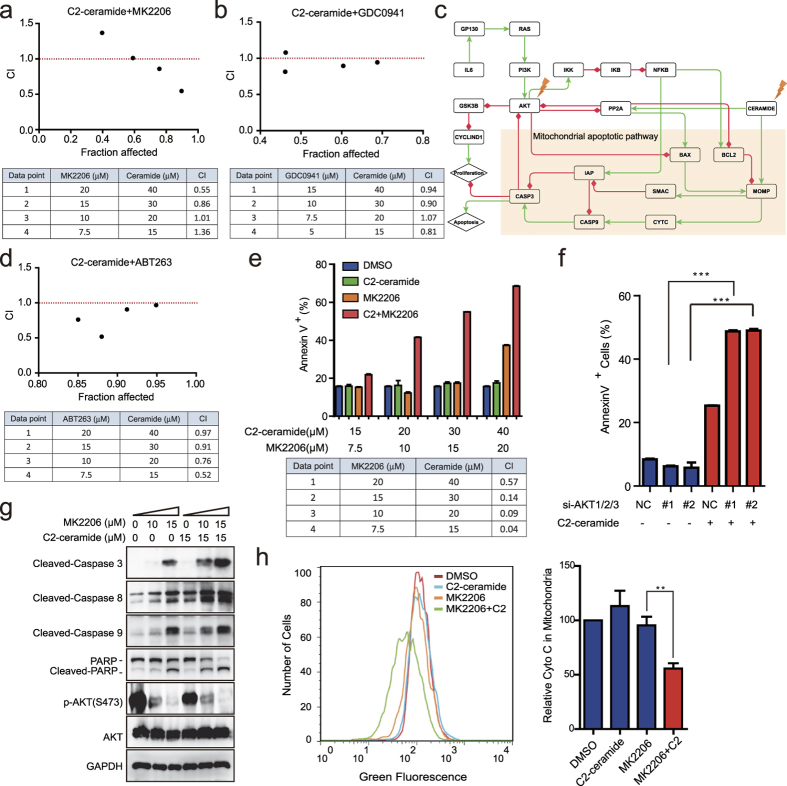
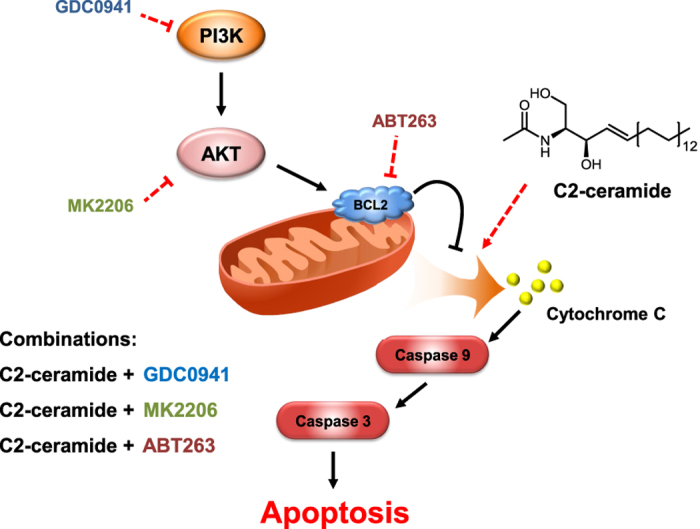
The connection between inflammation and tumourigenesis has been well established. However, the detailed molecular mechanism underlying inflammation-associated tumourigenesis remains unknown because this process involves a complex interplay between immune microenvironments and epithelial cells. To obtain a more systematic understanding of inflammation-associated tumourigenesis as well as to identify novel therapeutic approaches, we constructed a knowledge-based network describing the development of colitis-associated colon cancer (CAC) by integrating the extracellular microenvironment and intracellular signalling pathways. Dynamic simulations of the CAC network revealed a core network module, including P53, MDM2, and AKT, that may govern the malignant transformation of colon epithelial cells in a pro-tumor inflammatory microenvironment. Furthermore, in silico mutation studies and experimental validations led to a novel finding that concurrently targeting ceramide and PI3K/AKT pathway by chemical probes or marketed drugs achieves synergistic anti-cancer effects. Overall, our network model can guide further mechanistic studies on CAC and provide new insights into the design of combinatorial cancer therapies in a rational manner.


Figures

Figure 1
Figure 1. Topology of the CAC network.
Five colours were used to represent the nodes with different biological functions. The nodes in cyan belong to the extracellular immune microenvironment; the nodes in orange primarily participate in inflammatory signalling; the nodes in green primarily mediate cell proliferation; and the nodes in red regulate cell survival. The two purple nodes represent the output effects (proliferation and apoptosis) of the network model. An arrowhead represents positive regulation (activation or upregulation), whereas a diamond indicates negative regulation (inhibition or downregulation).
Figure 2
Figure 2. Dynamics of the CAC network model in the non-inflammatory microenvironment.
(a,b) Activation frequencies for five nodes, including Proliferation, Apoptosis, STAT3, NFKB and BCATENIN, were observed in the non-inflammatory microenvironment (a) and during transient activation of the DC node (b,c) The stabilised activation frequencies for all the microenvironment nodes when the initial state of DC was set to ON and other microenvironment nodes were initially set to OFF.
Figure 3
Figure 3. Dynamics of the CAC network model in the pro-tumour inflammatory microenvironment.
(a) The activation frequencies of Proliferation, Apoptosis, STAT3, NFKB and BCATENIN were observed in the pro-tumour inflammatory microenvironment. (b) The final reduced CAC network topology in the pro-tumour microenvironment. A green line with an arrowhead represents positive regulation, whereas a red line with a diamond indicates negative regulation. (c) The node activation patterns in the 21-node sub-network. Only the nodes that possess different activation patterns in the three attractors are shown. White, grey and black boxes represent inactivation, partial activation and full activation, respectively. (d) The core regulatory network that governed the behaviour of the CAC network in the pro-tumour inflammatory microenvironment.
Figure 4
Figure 4. Node perturbation results of the CAC network model in the pre-transformed state.
The activation frequencies of node Proliferation and Apoptosis corresponding to each perturbation are shown. (+) indicates that the node was fixed in the ON state, and (−) indicates that the node was fixed in the OFF state.
Figure 5
Figure 5. Experimental validations of drug combination predictions that targeting AKT plus exogenous C2-ceramide reduced cell viability and increased cell apoptosis.
(a) The combination effects of C2-ceramide and MK2206 on the viability of HT29 cells were determined by calculating the CI values for each data point. CI < 1 indicates a synergistic effect. (b) The combination effects of C2-ceramide and GDC0941 on the viability of HT29 cells. (c) The sub-network related to PI3K/AKT and ceramide signalling extracted from the entire CAC network. A green line with an arrowhead indicates positive regulation (activation or upregulation), whereas a red line with a diamond indicates negative regulation (inhibition or downregulation). (d) The combination effects of C2-ceramide and ABT263 on the viability of HT29 cells. (e) Synergistic apoptotic effects of C2-ceramide and MK2206 on HT29 cells. (f) Mean percentage of apoptotic cells treated with siAKT1/2/3 and/or 15 μM C2-ceramide. ‘NC’ group stands for the scrambled negative siRNA pools, which was used as a negative control; ‘#1’ and ‘#2’ groups stand for AKT siRNA pools that contain different siRNA sequences listed in Supplementary Methods. (g) Immunoblots of lysates from cells treated with 15 μM C2-ceramide and 10 μM or 15 μM MK2206 for 24 h. (h) Flow cytometry detection of mitochondrial cytochrome C levels in HT29 cells treated with DMSO (red line), 15 μM C2-ceramide (blue line), 10 μM MK2206 (orange line) and 15 μM C2-ceramide+10 μM MK2206 (green line) for 24 h. The bar graphs (right) show the relative fluorescence intensities representing mitochondrial cytochrome C levels. Data are representative of three independent experiments (mean ± s.e.m.). **P < 0.01 and ***P < 0.001 (Student’s t-test). ns, not significant.
Figure 6
Figure 6. Proposed model for the synergistic effect between ceramide and PI3K/AKT pathway inhibitors in inducing apoptotic cell death of cancer cells.
Ceramide directly or indirectly targets mitochondria, leading to the release of apoptotic proteins, such as cytochrome C, and activates caspases. However, if the PI3K/AKT pathway is activated by an inflammatory stimulus or other growth factors, it can preserve the integrity of the mitochondrial outer membrane by activating the anti-apoptotic BCL-2 family of proteins, such as BCL-2 or BCL-xL, by inhibiting PP2A or BAD. Therefore, ceramide and PI3K/AKT pathway inhibitors exert a synergistic cytotoxic effect on cancer cells. Note: the arrows in this simplified scheme are not intended to indicate direct physiological interactions.

References

    1. Balkwill F. & Mantovani A. Inflammation and cancer: back to Virchow? Lancet 357, 539–545, 10.1016/S0140-6736(00)04046-0 (2001). - DOI - PubMed
    1. Garagnani P., Pirazzini C. & Franceschi C. Colorectal cancer microenvironment: among nutrition, gut Microbiota, inflammation and epigenetics. Curr Pharm Design 19, 765–778 (2013). - PubMed
    1. Ekbom A., Helmick C., Zack M. & Adami H. O. Increased risk of large-bowel cancer in Crohn’s disease with colonic involvement. Lancet 336, 357–359 (1990). - PubMed
    1. Giardiello F. M., Offerhaus G. J. & DuBois R. N. The role of nonsteroidal anti-inflammatory drugs in colorectal cancer prevention. Eur J Cancer 31A, 1071–1076 (1995). - PubMed
    1. Lin W. W. & Karin M. A cytokine-mediated link between innate immunity, inflammation, and cancer. J Clin Invest 117, 1175–1183, 10.1172/Jci31537 (2007). - DOI - PMC - PubMed

Publication types

MeSH terms