. 2015 Oct 30;43(19):9362-78.
doi: 10.1093/nar/gkv988. Epub 2015 Oct 7.

MiRNA-891a-5p mediates HIV-1 Tat and KSHV Orf-K1 synergistic induction of angiogenesis by activating NF-κB signaling

Affiliations

MiRNA-891a-5p mediates HIV-1 Tat and KSHV Orf-K1 synergistic induction of angiogenesis by activating NF-κB signaling

Shuihong Yao et al. Nucleic Acids Res. .

Erratum in

Abstract

Co-infection with HIV-1 and Kaposi's sarcoma-associated herpesvirus (KSHV) is the cause of aggressive AIDS-related Kaposi's sarcoma (AIDS-KS) characterized by abnormal angiogenesis. The impact of HIV-1 and KSHV interaction on the pathogenesis and extensive angiogenesis of AIDS-KS remains unclear. Here, we explored the synergistic effect of HIV-1 Tat and KSHV oncogene Orf-K1 on angiogenesis. Our results showed that soluble Tat or ectopic expression of Tat enhanced K1-induced cell proliferation, microtubule formation and angiogenesis in chorioallantoic membrane and nude mice models. Mechanistic studies revealed that Tat promoted K1-induced angiogenesis by enhancing NF-κB signaling. Mechanistically, we showed that Tat synergized with K1 to induce the expression of miR-891a-5p, which directly targeted IκBα 3' untranslated region, leading to NF-κB activation. Consequently, inhibition of miR-891a-5p increased IκBα level, prevented nuclear translocation of NF-κB p65 and ultimately suppressed the synergistic effect of Tat- and K1-induced angiogenesis. Our results illustrate that, by targeting IκBα to activate the NF-κB pathway, miR-891a-5p mediates Tat and K1 synergistic induction of angiogenesis. Therefore, the miR-891a-5p/NF-κB pathway is important in the pathogenesis of AIDS-KS, which could be an attractive therapeutic target for AIDS-KS.


Figures

Figure 1.
Figure 1.
Tat synergistically facilitates K1 in promoting endothelial cell proliferation and microtubule formation. (A) Endothelial cell proliferation. Primary HUVEC transduced with lentiviral K1 or the control empty vector Mock were incubated with soluble Tat (200 ng/mL) and further examined with CCK-8 assay on days 1, 2 and 3 (left). EA.hy926 cells transduced with lentiviral K1, Tat, or both (K1 + Tat), as well as the control empty vector Mock were seeded and examined for cell proliferation with CCK-8 test on days 1, 2, 3, 4 and 5 (right). Data represent mean ± SEM determined from three independent experiments (n = 3), each experiment containing six technical replicates. (B) Plate colony formation assay. EA.hy926 cells treated as described in (A) were digested into single cells, seeded, and cultured for 14 days, followed by crystal violet staining with the size and number of formed colonies measured (left). The histogram demonstrates the quantification of colony formation (right). Data represent mean ± SEM determined from three independent experiments (n = 3), each experiment containing five technical replicates. (C) Microtubule formation assay. HUVEC and EA.hy926 cells treated as described in (A) were seeded onto the culture plate with Matrigel and photographed under microscopy (×100) 16 h later. (D) Quantification of the results in (C). Data represent mean ± SEM determined from three independent experiments (n = 3), each experiment containing six technical replicates.
Figure 2.
Figure 2.
Tat synergistically promotes K1 in activation of NF-κB signaling. (A) Western blotting analysis of IκBα, phosphorylated p65, total p65 and VEGF in HUVEC transduced with K1, incubated with soluble Tat protein or both for 72 h (left panel), and EA.hy926 cells transduced with K1, Tat or both for 72 h (right panel), respectively. Expressions of K1 and ectopic Tat in cells were detected using anti-Flag-Tag antibody, while soluble Tat was examined using anti-His-Tag antibody. Numbers labeled under the bands were the relative intensities of the bands after calibrating for loading using house-keeping protein. The relative values of proteins in Mock + PBS group or Mock group was considered as ‘1’; same for all of the following western blotting figures. (B) Expression and nuclear translocation of p65 observed by confocal microscopy. HUVEC were treated as described in (A) for 24 h. Red represents expression and distribution of p65, and blue nuclear staining by DAPI. (C) NF-κB p65–DNA binding activity assay. Nuclear proteins were extracted from cells treated as described in (A), followed by determination of ELISA. Competitive oligonucleotide was used as a positive control and data represent mean ± SEM determined from three independent experiments (n = 3), each experiment containing three technical replicates. Compared with competitive oligonucleotide: *P < 0.05, **P < 0.01, and ***P < 0.001. (D) Detection of NF-κB activity by luciferase assay. Data represent mean ± SEM determined from three independent experiments (n = 3), each experiment containing four technical replicates.
Figure 3.
Figure 3.
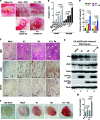
Tat synergized with K1 to promote angiogenesis in CAM and nude mice Matrigel plug angiogenesis models. (A) Tat promoted K1-induced angiogenesis of endothelial cells in the CAM model. HUVEC transduced with K1, incubated with soluble Tat protein or both for 72 h were mixed with Matrigel and implanted onto CAM. Representative photographs of angiogenesis on the CAM are shown under stereomicroscopy. (B) Quantification of results in (A). The number of blood vessels was normalized to that of Matrigel alone. Data represent mean ± SEM from three independent experiments (n = 3), each experiment containing six technical replicates. (C) Hematoxylin and eosin staining analysis of histologic features (top; ×200) and immunohistochemical staining analysis of the expression of SMA and VEGF (middle and bottom;×200) in tumor tissues from the CAMs induced by EA.hy926 cells transduced with K1, Tat or both. White arrows point to the formation of new blood vessels and hemorrhagic region. (D) Quantification of the results in (C). (E). Western blotting analysis of IκBα and VEGF in CAM tissues treated as in (C). (F) Tat promoted K1-induced angiogenesis in nude mice. EA.hy926 cells transduced by K1, Tat or both were examined for their proangiogenic effects in Matrigel plug assay in nude mice as described in the “Materials and Methods” section. Representative photographs of angiogenesis in the nude mice are shown. (G) The hemoglobin level of the Matrigel plugs treated as in (F) was determined with hemoglobin content calculated based on the standard curve. Data represent mean ± SEM determined from three independent experiments (n = 3), each experiment containing six technical replicates.
Figure 4.
Figure 4.
NF-κB pathway mediates synergistic effect of Tat in K1-induced angiogenesis. (A) Transduction of lentiviral IκB-DN inhibited angiogenesis in the CAM model. Lentiviral K1-transduced HUVEC were incubated with soluble Tat and subsequently transduced with lentiviral IκB-DN and its control vector pCDH. Cells were mixed with Matrigel and implanted onto CAM. The number of blood vessels was normalized to that of Matrigel alone. Data represent mean ± SEM from three independent experiments (n = 3), each experiment containing six technical replicates. (B) NF-κB p65–DNA binding activity assay. Nuclear proteins were extracted from CAM tissues treated as described in (A), followed by determination of ELISA. Competitive oligonucleotide was used as a positive control and data represent mean ± SEM determined from three independent experiments (n = 3), each experiment containing three technical replicates. Compared with competitive oligonucleotide: *P < 0.05 and ***P < 0.001. (C) Bay11–7082 inhibited angiogenesis in the CAM model. EA.hy926 cells expressing K1, Tat and both were pretreated with Bay11–7082 or DMSO (control) for 3 h, and mixed with pre-cooled Matrigel and then inoculated into the CAM. The number of blood vessels was normalized to that of Matrigel alone. Data represent mean ± SEM from three independent experiments (n = 3), each experiment containing 6 technical replicates. (D) NF-κB p65–DNA binding activity assay. Nuclear proteins were extracted from CAM tissues treated as described in (C), followed by determination of ELISA. Data represent mean ± SEM determined from three independent experiments (n = 3), each experiment containing three technical replicates. Compared with competitive oligonucleotide: * P < 0.05 and **P < 0.01. (E) Transduction of lentiviral IκB-DN inhibited angiogenesis in nude mice model. Lentiviral K1-transduced HUVEC were incubated with soluble Tat and subsequently transduced with lentiviral IκB-DN and its control vector pCDH. Cells were examined for their proangiogenic effects in Matrigel plug assay in nude mice. Representative photographs of angiogenesis in the nude ice are shown. (F) The hemoglobin level of the Matrigel plugs treated as in (E) was determined with hemoglobin content calculated based on the standard curve. Data represent mean ± SEM determined from three independent experiments (n = 3), each experiment containing six technical replicates. (G) Western blotting analysis of IκBα in plug tissues from nude mice treated as in (E).
Figure 5.
Figure 5.
Tat promotes tumorigenesis induced by K1 in nude mice. (A) Kaplan–Meier plot of tumorigenesis in nude mice. EA.hy926 cells transduced by K1, Tat or both were sc injected into the left flanks of nude mice. The palpable tumor appearances of mice were daily monitored for 60 days. (B) Tumor size induced by K1 with synergistic promotion by Tat, measured by Vernier caliper. Data represent mean ± SD. n = 5 tumors per group. Two independent experiments were performed and gave similar results. *P < 0.05, **P < 0.01 and ***P < 0.001. (C) Tumor weight induced by K1 with synergistic promotion from Tat. Nude mice that treated as in (A) were sacrificed at days 64; tumor tissue was harvested and weighed immediately. Data represent mean ± SD, each group with five tumors. Two independent experiments were performed and similar results were obtained. (D) Photographs of harvested tumors. (E) H&E staining of tumor tissue (top; ×200) and immunohistochemical staining of SMA and VEGF (middle and bottom; ×200). (F). Quantitative scanning of SMA and VEGF expression of the results in (E).
Figure 6.
Figure 6.
Tat synergizes with K1 to promote tumorigenesis in nude mice by activating the NF-κB pathway. (A) Expression of IκBα, phosphorylated p65 and total p65 in tumor tissue of nude mice. EA.hy926 cells transduced by K1, Tat or both were injected (s.c.) into the left flanks of nude mice. The tumor was isolated at days 64 and subject to Western blotting for IκBα expression. (B) Immunohistochemical staining of phosphorylated p65 in cell nucleus of tumor tissues of nude mice. EA.hy926 cells were treated as in (A) and the tumor tissue was fixed in formalin, and embedded in paraffin for immunohistochemical detection of nuclear translocation of NF-κB p65. Black arrows point to phosphorylated p65 staining in cell nucleus. (C) Quantitative scanning of phosphorylated p65 nuclear translocation of the results in (B). (D) Activation of NF-κB is required for Tat promotion of K1-induced tumorigenesis indicated by tumor size. EA.hy926 cells transduced with K1 and Tat were injected (s.c.) into the left flanks of mice for xenograft formation. The mice received the treatments by intraperitoneal injection of Bay11–7082. The results are expressed as the mean ± SD, each group with five tumors. Two independent experiments were performed and similar results were obtained. (E) Weight of tumors isolated in (D), five tumors per group, presented as mean ± SD.
Figure 7.
Figure 7.
miR-891a-5p regulates NF-κB pathway by targeting IκBα 3′UTR. (A) Thermal analysis of eight miRNAs with differential expression levels in EA.hy926 cells transduced with K1, Tat or both, which were predicted to target IκBα 3′UTR through bioinformatics approach. The color scale from green to red represents low to high expression intensity of miRNAs. (B) Inhibition of IκBα 3′UTR reporter activity by miRNAs. HEK293T cells were co-transfected with miRNA mimics (10 nM) predicted in (A) or miRNA negative control (Neg. Ctrl.) together with pGL3-IκBα 3′UTR luciferase reporter and assayed for luciferase activity. The data represent the mean ± SEM from three independent experiments (n = 3), each experiment containing four technical replicates. *P < 0.05 and **P < 0.01; n.s. not significant. (C) The influence of miRNAs on expression of endogenous IκBα. HUVEC transfected with miRNA mimics (20 nM) and negative control were subject to western blotting at 48 h post-transfection. (D) miR-891a-5p inhibited the reporter activity of the pGL-3-IκBα 3′UTR but not the control reporter pGL3. miR-891a-5p mimics (50 nM) or negative control with pGL3-Control or pGL-3-IκBα 3′UTR reporter plasmid were co-transfected into HEK293T cells for 48 h. **P < 0.01 by Student's t test versus the Neg. Ctrl. group. n.s., not significant. (E) RT-qPCR detection of miR-891a-5p expression in K1-transduced HUVEC at 72 h after adding soluble Tat (left); in EA.hy926 cells with ectopic expression of Tat (middle); and in HUVEC infected by KSHV (BAC16) (right). (F) miR-891a-5p mimics (10, 20 and 50 nM) or a negative control were co-transfected into HEK293T cells along with pGL-3-IκBα 3′UTR reporter plasmid. Luciferase assay was performed 48 h later. Results were verified in three independently repeated experiments (n = 3) with four technical replicates, presented as mean ± SEM. *P < 0.05 and **P < 0.01 by Student's t test versus the Neg. Ctrl. group. (G) miR-891a-5p inhibited expression of endogenous IκBα in a dose-dependent manner. miR-891a-5p mimics (10 and 50 nM) were transfected into HUVEC and Western blotting was performed with anti-IκBα antibody at 48 h post-transfection. (H) Inhibition of miR-891a-5p promoted expression of endogenous IκBα. miR-891a-5p inhibitor (10 and 50 nM) were transfected into HUVEC and western blotting was performed with anti-IκBα antibody at 48 h post-transfection. (I) Schematic diagram of predicted seed sequence of miR-891a-5p which binds with IκBα 3′UTR, and mutation of the binding site of miR-891a-5p or IκBα 3′UTR. (J) miR-891a-5p mutant without the sequence binding to IκBα 3′UTR lost its inhibitory effect on IκBα expression. miR-891a-5p mimics (20 nM), miR-891a-5p mutant and a negative control were transfected into HUVEC and Western blotting was performed with anti-IκBα antibody at 48 h post-transfection. (K). Effect of seed mutagenesis or mutation of the binding site on the IκBα 3′UTR reporter. IκBα 3′UTR wild type (WT IκBα) was co-transfected with a negative control (Neg. Ctrl.), natural (miR-891a-5p) or mutant miR-891a-5p (mut miR-891a-5p) into HEK293T cells, while mutant IκBα 3′UTR construct (mut IκBα) was also co-transfected with a negative control (Neg. Ctrl.), natural (miR-891a-5p) or mutant miR-891a-5p (mut miR-891a-5p). After co-transfection for 48 h, HEK293T cells were assayed for luciferase activity. The data represent the mean ± SEM from three independent experiments (n = 3), each experiment containing four technical replicates. *P < 0.05 and **P < 0.01 by Student's t-test.
Figure 8.
Figure 8.
Inhibition of miR-891a-5p suppresses the synergistic promotion of Tat- and K1-induced cell proliferation and microtubule formation by inhibiting NF-κB pathway. (A) Plate colony formation assay to measure the influence of miR-891a-5p sponge on synergistic promotion of Tat- and K1-induced colony formation. EA.hy926 cells transduced with K1, Tat and both were further transduced with lentivial miR-891a-5p sponge or its control pCDH. Cells were seeded and stained with crystal violet 14 days later to evaluate the size and number of clones formed. (B) Quantification of the results in (A). The data represent the mean ± SEM from three independent experiments (n = 3), each experiment containing six technical replicates. (C) Microtubule formation assay to measure the influence of miR-891a-5p inhibitor on synergistic promotion of Tat- and K1-induced microtubule formation. HUVEC transduced with K1 or incubated with soluble Tat were transfected with miR-891a-5p inhibitor and a negative control. Cells were then seeded onto plates with Matrigel and photographed under a microscope (×100) after 16 h. (D) Quantification of the results in (C). The data represent the mean ± SEM from three independent experiments (n = 3), each experiment containing six technical replicates. (E) Inhibition of miR-891a-5p elevated IκBα in vitro. Western blotting was performed to examine IκBα expression in cells treated as described in (C).
Figure 9.
Figure 9.
Inhibition of miR-891a-5p suppresses the synergistic promotion of Tat- and K1-induced angiogenesis in animal models by inhibiting NF-κB pathway. (A) Inhibitory effect of miR-891a-5p inhibitor on synergistic promotion of Tat- and K1-induced angiogenesis in CAM model. HUVEC transduced with K1 or incubated with Tat were transfected with miR-891a-5p inhibitor or a negative control and further implanted into CAM model. CAMs were harvested 4 days later; vessels were observed by stereomicroscopy; and representative photographs were taken. (B) Quantification of the results in (A). The number of blood vessels was normalized to that of Matrigel alone. Data represent mean ± SEM from three independent experiments (n = 3), each experiment containing six technical replicates. (C) Inhibitory effect of miR-891a-5p sponge on synergistic promotion of Tat- and K1-induced angiogenesis in nude mice. EA.hy926 cells transduced by K1, Tat or both were transduced with lentiviral miR-891a-5p sponge or its control pCDH, and further examined for their proangiogenic effects in Matrigel plug assay in nude mice. Representative photographs of angiogenesis in the nude mice are shown. (D) The hemoglobin level of the Matrigel plug treated as in (C) was determined with hemoglobin content calculated based on the standard curve. Data represent mean ± SEM determined from three independent experiments (n = 3), each experiment containing six technical replicates. (E) NF-κB p65–DNA binding activity assay. Nuclear proteins were extracted from plug tissues of nude mice treated as described in (C), followed by determination of ELISA. Data represent mean ± SEM determined from three independent experiments (n = 3), each experiment containing three technical replicates. Compared with competitive oligonucleotide: *P < 0.05, **P < 0.01 and ***P < 0.001. (F) Western blotting analysis of IκBα in plug tissues from nude mice treated as in (C).

Similar articles

Cited by

References

    1. Chang Y., Cesarman E., Pessin M.S., Lee F., Culpepper J., Knowles D.M., Moore P.S. Identification of herpesvirus-like DNA sequences in AIDS-associated Kaposi's sarcoma. Science. 1994;266:1865–1869. - PubMed
    1. Ganem D. KSHV infection and the pathogenesis of Kaposi's sarcoma. Annu. Rev. Pathol. 2006;1:273–296. - PubMed
    1. Cai Q., Verma S.C., Lu J., Robertson E.S. Molecular biology of Kaposi's sarcoma-associated herpesvirus and related oncogenesis. Adv. Virus Res. 2010;78:87–142. - PMC - PubMed
    1. Mesri E.A., Cesarman E., Boshoff C. Kaposi's sarcoma and its associated herpesvirus. Nat. Rev. Cancer. 2010;10:707–719. - PMC - PubMed
    1. Cousins E., Nicholas J. Molecular biology of human herpesvirus 8: novel functions and virus-host interactions implicated in viral pathogenesis and replication. Recent Results Cancer Res. 2014;193:227–268. - PMC - PubMed

Publication types

MeSH terms

LinkOut - more resources