

In Vitro Tests for Aerosol Deposition. IV: Simulating Variations in Human Breath Profiles for Realistic DPI Testing
- PMID: 26447531
- PMCID: PMC5079450
- DOI: 10.1089/jamp.2015.1215
In Vitro Tests for Aerosol Deposition. IV: Simulating Variations in Human Breath Profiles for Realistic DPI Testing
Abstract
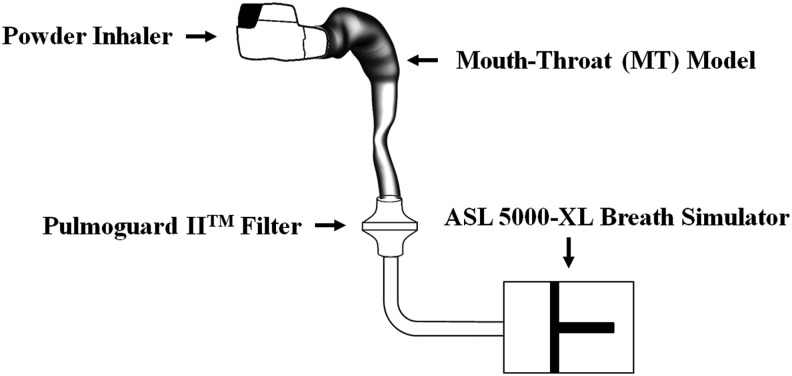
Background: The amount of drug aerosol from an inhaler that can pass through an in vitro model of the mouth and throat (MT) during a realistic breath or inhalation flow rate vs. time profile (IP) is designated the total lung dose in vitro, or TLDin vitro. This article describes a clinical study that enabled us to recommend a general method of selecting IPs for use with powder inhalers of known airflow resistance (R) provided subjects followed written instructions either alone or in combination with formal training.
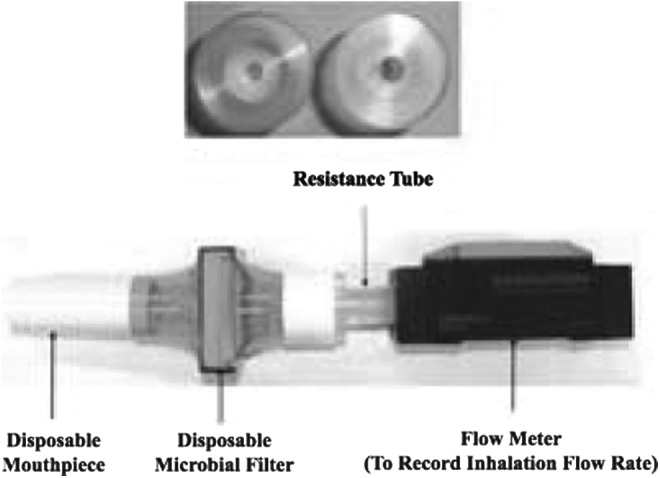
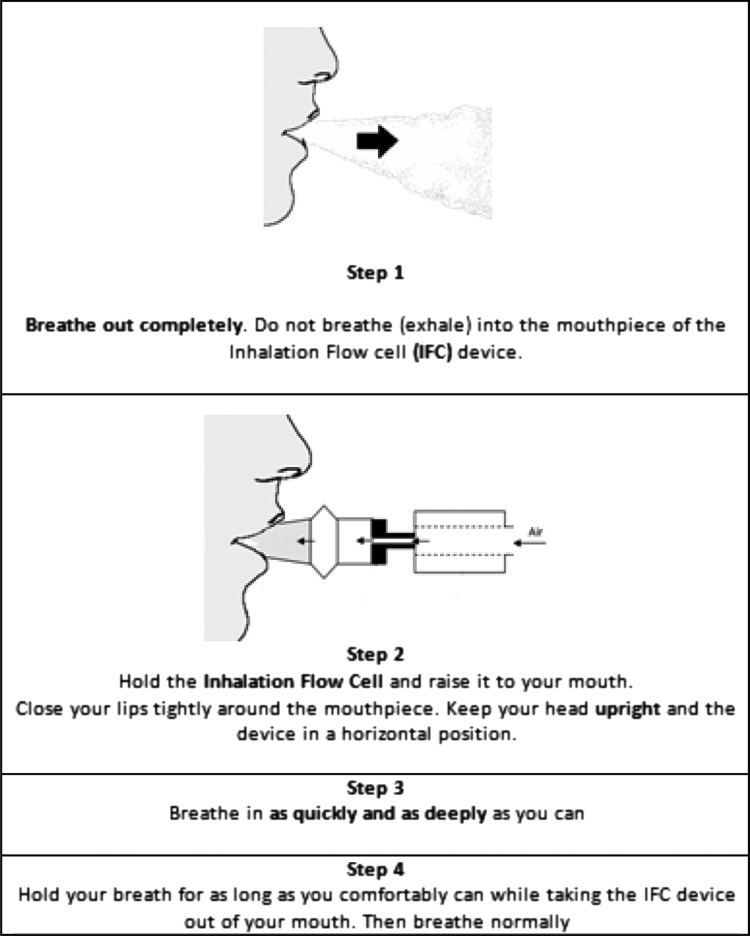
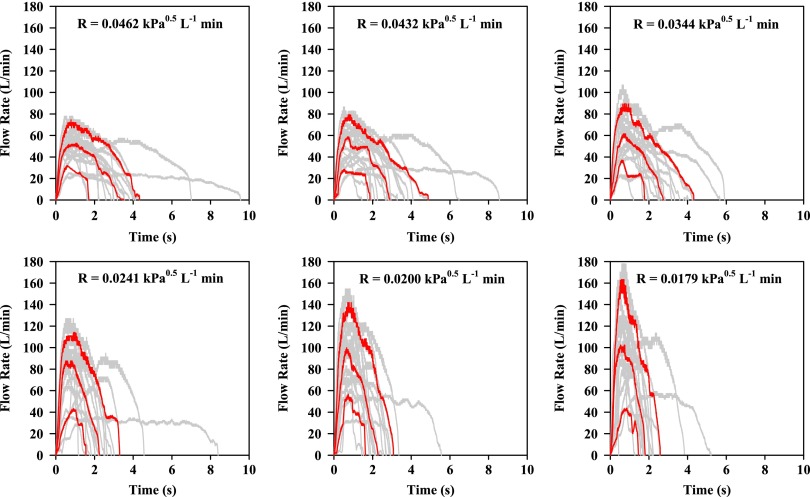
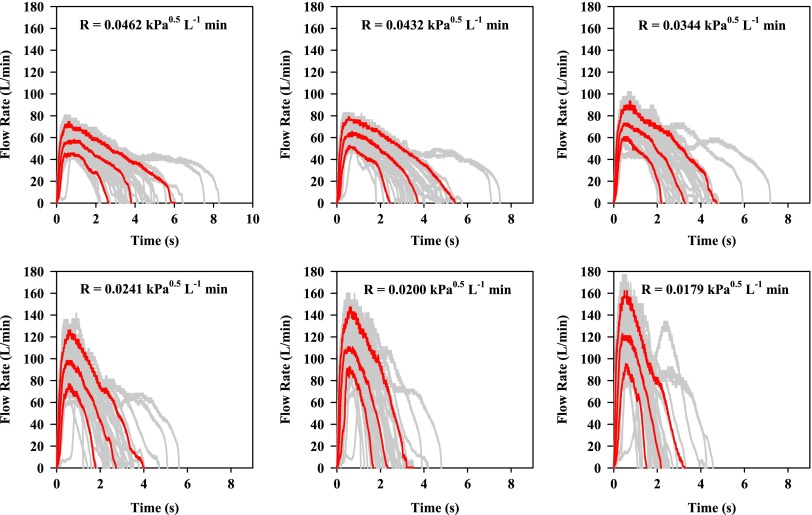
Methods: In a drug-free clinical trial, inhaler-naïve, nonsmoking healthy adult human volunteers were screened for normal pulmonary function. IPs were collected from each volunteer inhaling through different air flow resistances after different levels of training. IPs were analyzed to determine the distribution of inhalation variables across the population and their dependence on training and airflow resistance.
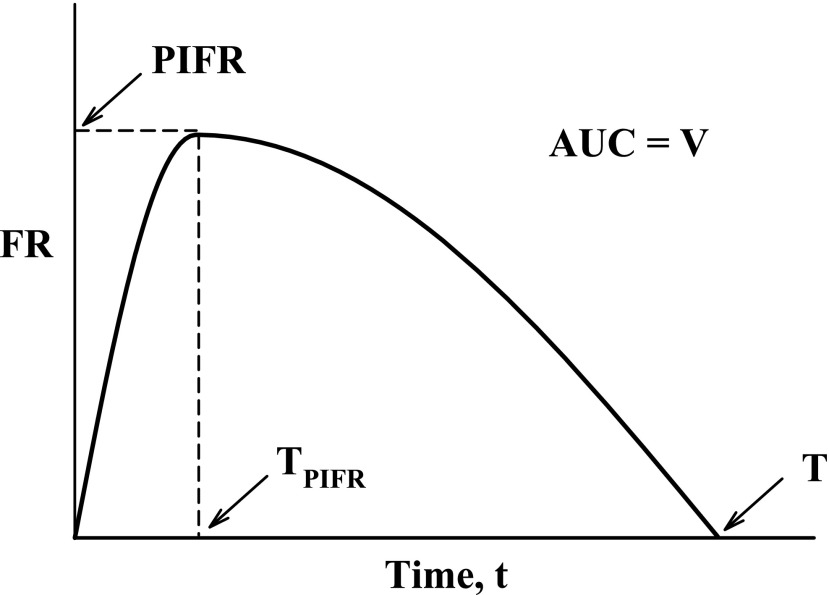
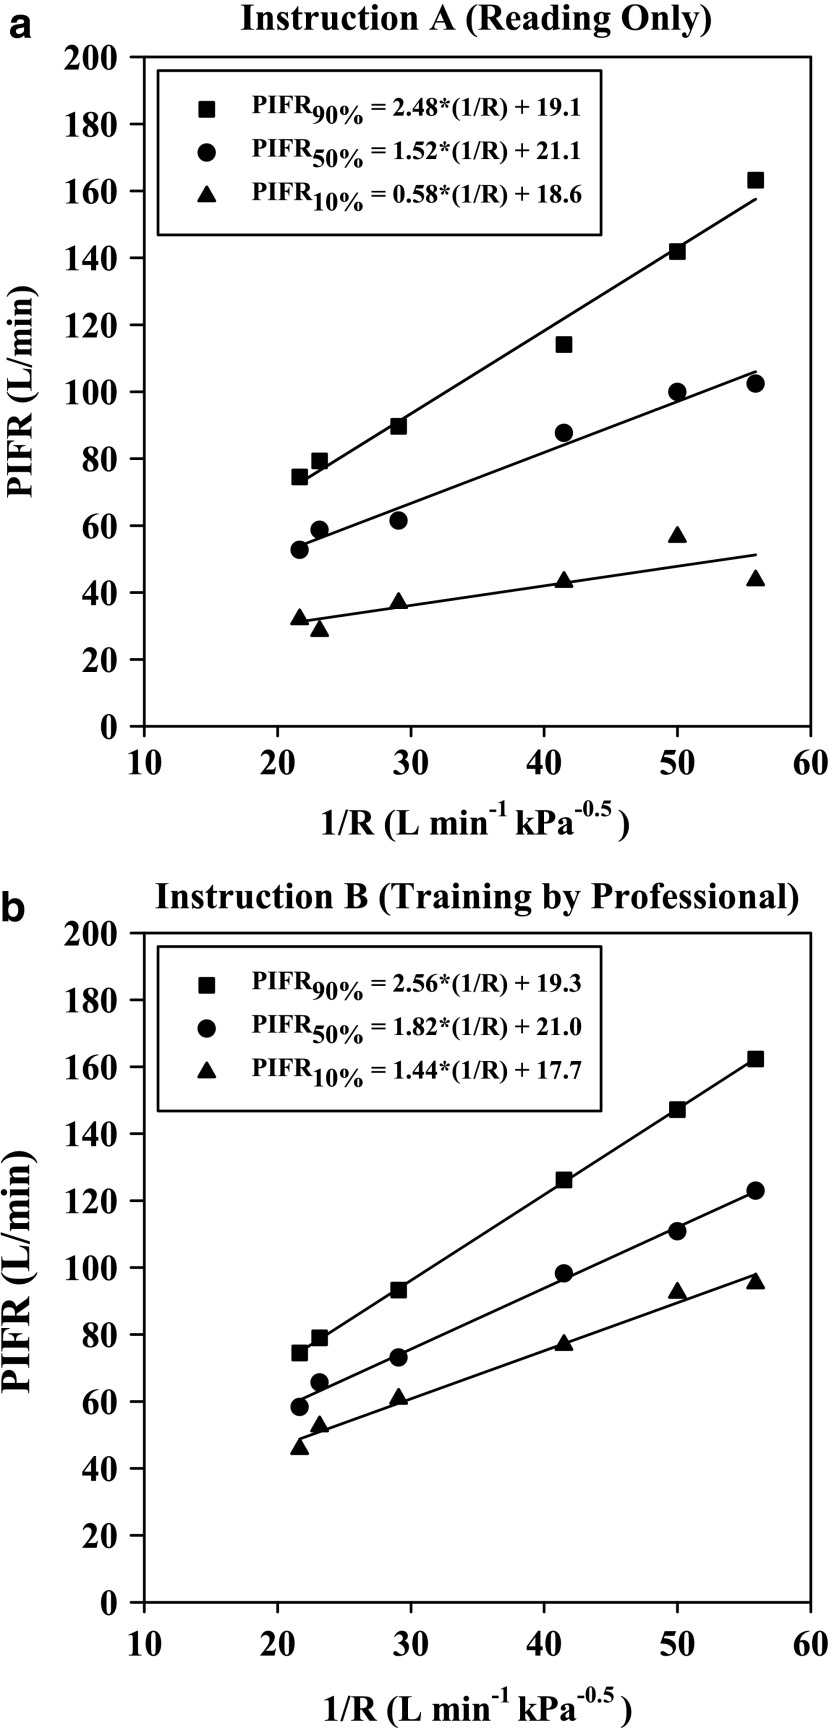
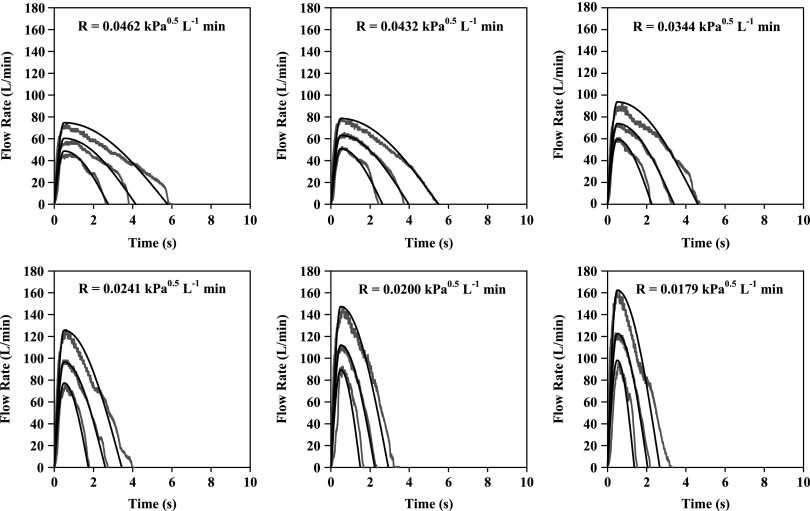
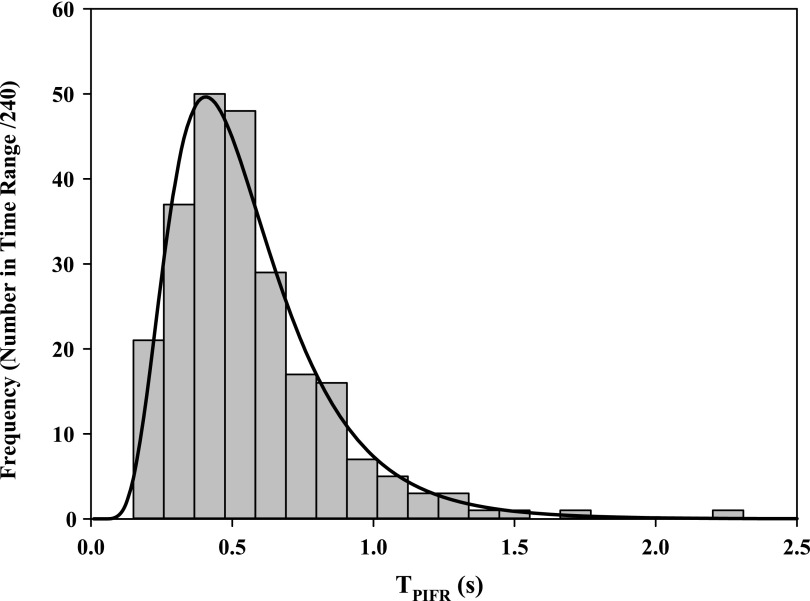
Results: Equations for IP simulation are presented that describe the data including confidence limits at each resistance and training condition. Realistic IPs at upper (90%), median (50%), and lower (10%) confidence limits were functions of R and training. Peak inspiratory flow rates (PIFR) were inversely proportional to R so that if R was assigned, values for PIFR could be calculated. The time of PIFR, TPIFR, and the total inhaled volume (V) were unrelated to R, but dependent on training. Once R was assigned for a powder inhaler to be tested, a range of simulated IPs could be generated for the different training scenarios. Values for flow rate acceleration and depth of inspiration could also be varied within the population limits of TPIFR and V.
Conclusions: The use of simulated IPs, in concert with realistic in vitro testing, should improve the DPI design process and the confidence with which clinical testing may be initiated for a chosen device.
Keywords: airflow resistance; dry powder inhaler; in vitro–in vivo correlations; inhalation profiles; patient training; peak inhalation flow rate; realistic inhaler testing.
Conflict of interest statement
Author Disclosure Statement At the time of the investigation all authors were faculty and students at Virginia Commonwealth University. RRD is now employed by the US Food and Drug Administration that has not endorsed this work or influenced the statements made in this article. Supplies and equipment were purchased from commercial sources. No conflicts of interest exist.
Figures
References
-
- Delvadia RR, Longest PW, and Byron PR: In vitro tests for aerosol deposition. I: Scaling a physical model of the upper airways to predict drug deposition variation in normal humans. J Aerosol Med Pulm Drug Deliv. 2012;25:32–40 - PubMed
-
- Delvadia RR, Hindle M, Longest PW, and Byron PR: In vitro tests for aerosol deposition. II: IVIVCs for different dry powder inhalers in normal adults. J Aerosol Med Pulm Drug Deliv. 2013;26:138–144 - PubMed
-
- Delvadia RR, Longest PW, Hindle M, and Byron PR: In vitro tests for aerosol deposition. III: Effect of inhaler insertion angle on aerosol deposition. J Aerosol Med Pulm Drug Deliv. 2013;26:145–156 - PubMed
-
- Longest PW: VCU Mouth Throat (MT) models. http://www.rddonline.com/resources/tools/models.php Accessed Feb. 16, 2015
-
- Clark AR, and Hollingworth AM: The relationship between powder inhaler resistance and peak inspiratory conditions in healthy volunteers—Implications for in vitro testing. J Aerosol Med. 1993;6:99–110 - PubMed
Publication types
MeSH terms
Substances
Grants and funding
LinkOut - more resources
Full Text Sources
Other Literature Sources
Medical
