Comparative Study
. 2015 Nov 3;314(17):1850-60.
doi: 10.1001/jama.2015.13134.

Potential Mechanisms for Cancer Resistance in Elephants and Comparative Cellular Response to DNA Damage in Humans

Affiliations
Comparative Study

Potential Mechanisms for Cancer Resistance in Elephants and Comparative Cellular Response to DNA Damage in Humans

Lisa M Abegglen et al. JAMA. .

Abstract

Importance: Evolutionary medicine may provide insights into human physiology and pathophysiology, including tumor biology.

Objective: To identify mechanisms for cancer resistance in elephants and compare cellular response to DNA damage among elephants, healthy human controls, and cancer-prone patients with Li-Fraumeni syndrome (LFS).

Design, setting, and participants: A comprehensive survey of necropsy data was performed across 36 mammalian species to validate cancer resistance in large and long-lived organisms, including elephants (n = 644). The African and Asian elephant genomes were analyzed for potential mechanisms of cancer resistance. Peripheral blood lymphocytes from elephants, healthy human controls, and patients with LFS were tested in vitro in the laboratory for DNA damage response. The study included African and Asian elephants (n = 8), patients with LFS (n = 10), and age-matched human controls (n = 11). Human samples were collected at the University of Utah between June 2014 and July 2015.

Exposures: Ionizing radiation and doxorubicin.

Main outcomes and measures: Cancer mortality across species was calculated and compared by body size and life span. The elephant genome was investigated for alterations in cancer-related genes. DNA repair and apoptosis were compared in elephant vs human peripheral blood lymphocytes.

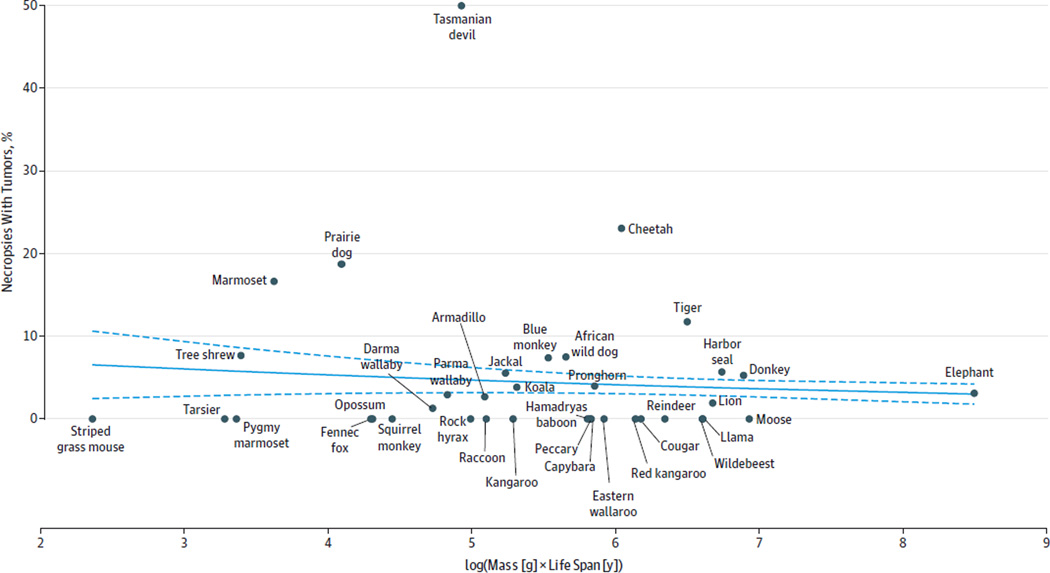
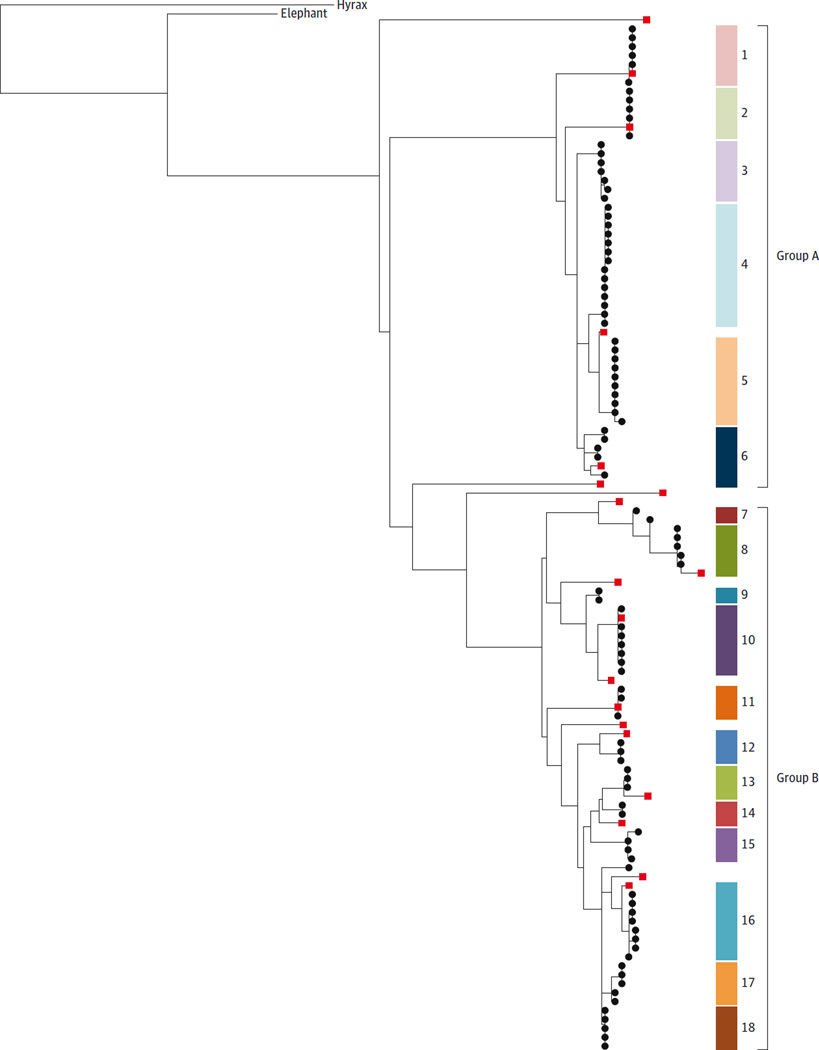
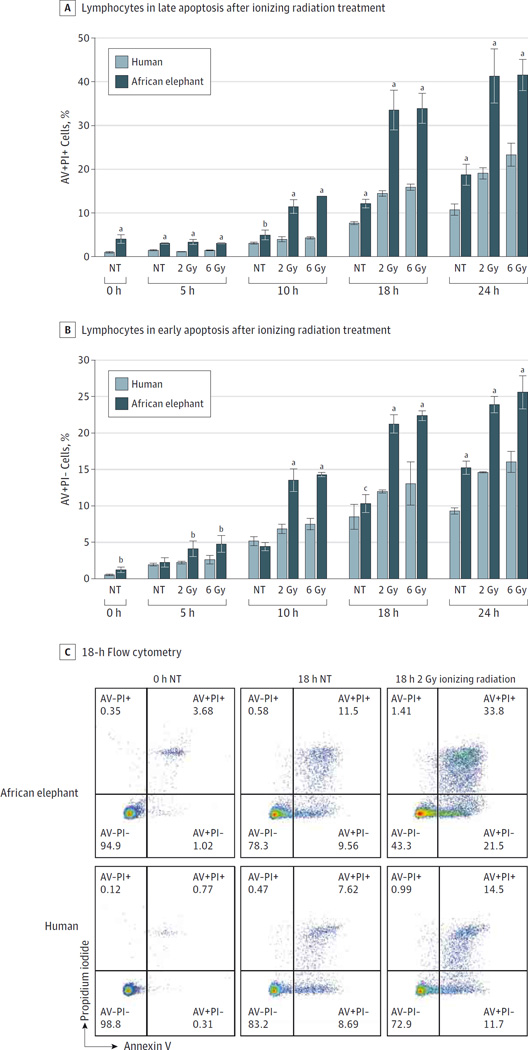
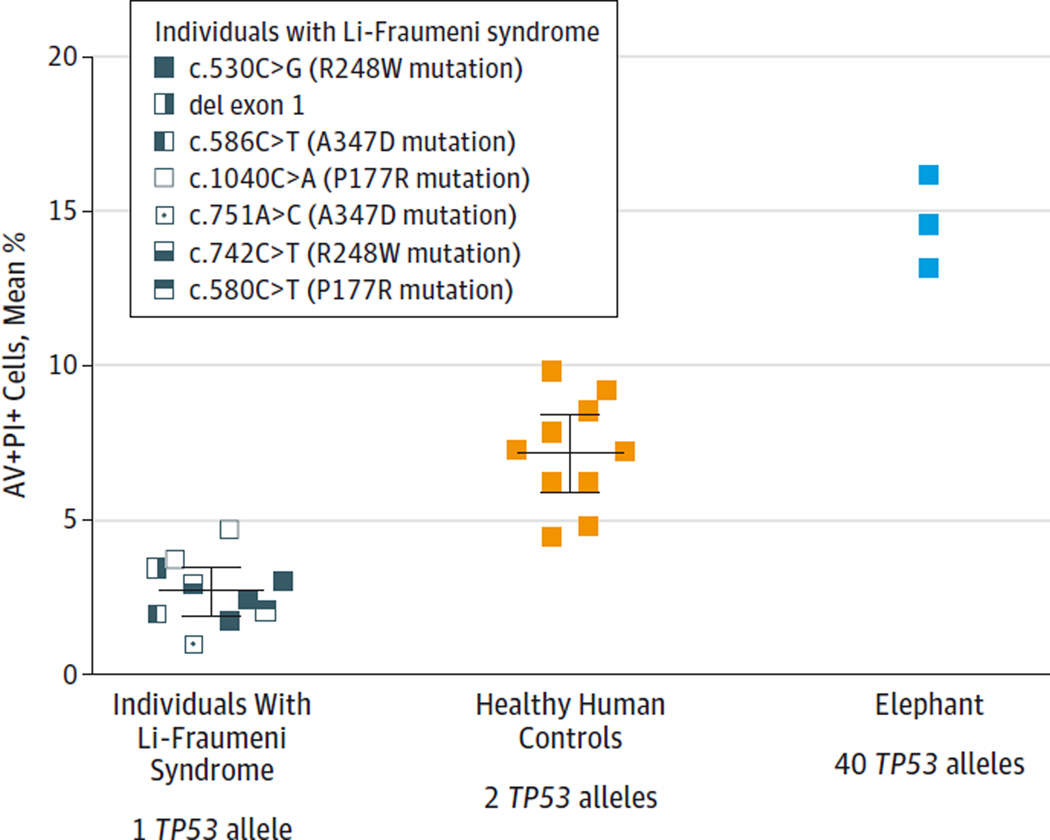
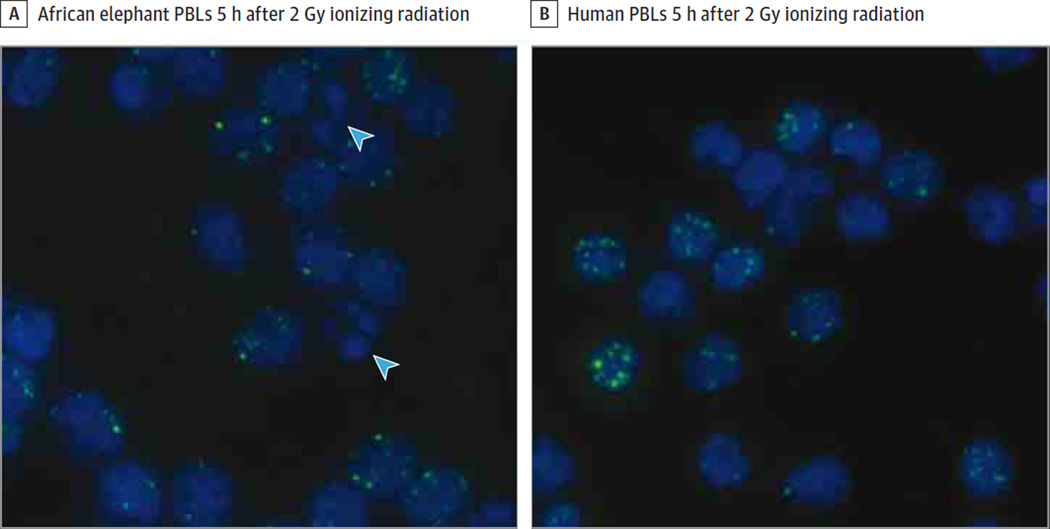
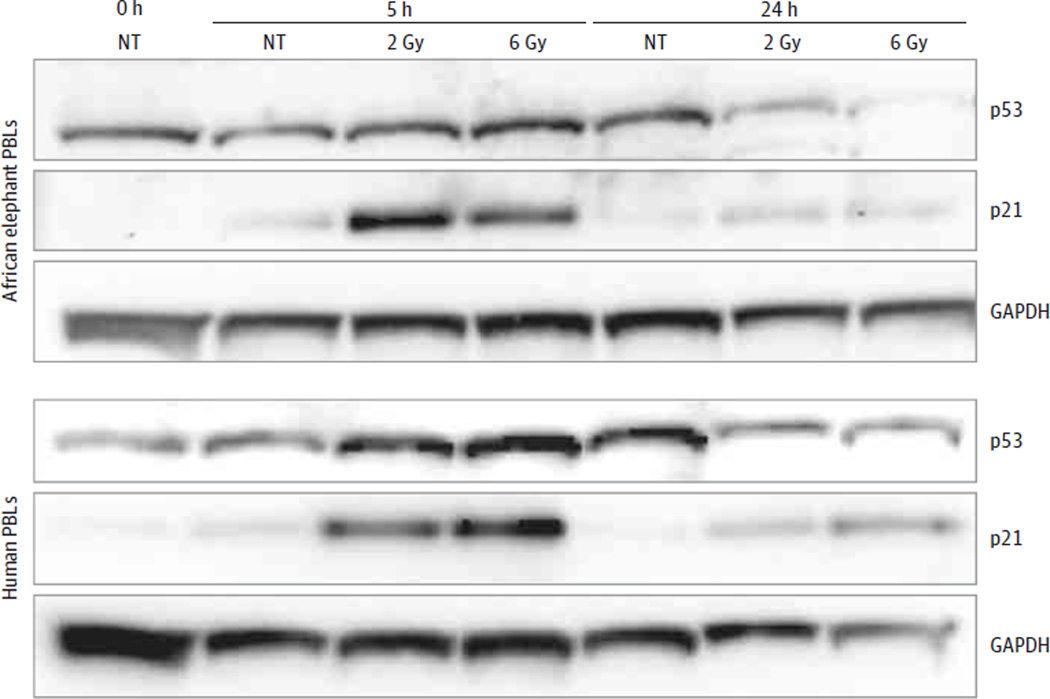
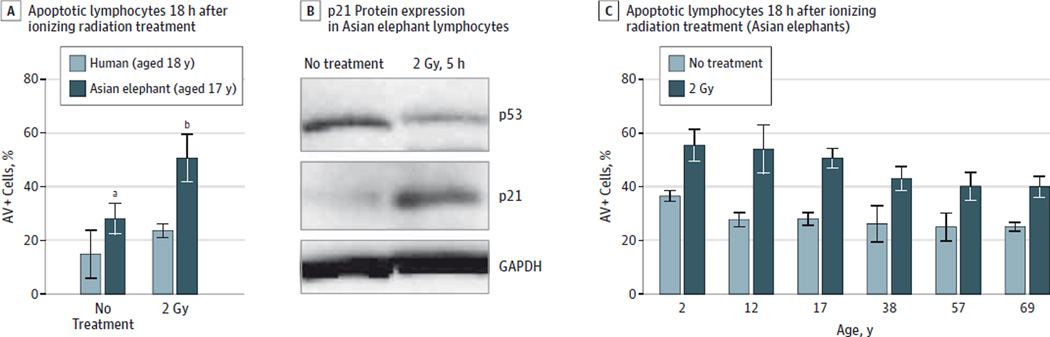
Results: Across mammals, cancer mortality did not increase with body size and/or maximum life span (eg, for rock hyrax, 1% [95% CI, 0%-5%]; African wild dog, 8% [95% CI, 0%-16%]; lion, 2% [95% CI, 0%-7%]). Despite their large body size and long life span, elephants remain cancer resistant, with an estimated cancer mortality of 4.81% (95% CI, 3.14%-6.49%), compared with humans, who have 11% to 25% cancer mortality. While humans have 1 copy (2 alleles) of TP53, African elephants have at least 20 copies (40 alleles), including 19 retrogenes (38 alleles) with evidence of transcriptional activity measured by reverse transcription polymerase chain reaction. In response to DNA damage, elephant lymphocytes underwent p53-mediated apoptosis at higher rates than human lymphocytes proportional to TP53 status (ionizing radiation exposure: patients with LFS, 2.71% [95% CI, 1.93%-3.48%] vs human controls, 7.17% [95% CI, 5.91%-8.44%] vs elephants, 14.64% [95% CI, 10.91%-18.37%]; P < .001; doxorubicin exposure: human controls, 8.10% [95% CI, 6.55%-9.66%] vs elephants, 24.77% [95% CI, 23.0%-26.53%]; P < .001).

Conclusions and relevance: Compared with other mammalian species, elephants appeared to have a lower-than-expected rate of cancer, potentially related to multiple copies of TP53. Compared with human cells, elephant cells demonstrated increased apoptotic response following DNA damage. These findings, if replicated, could represent an evolutionary-based approach for understanding mechanisms related to cancer suppression.


Conflict of interest statement

Conflict of Interest Disclosures: All authors have completed and submitted the ICMJE Form for Disclosure of Potential Conflicts of Interest. No other disclosures were reported.

Figures

Figure 1
Figure 1. Cancer Incidence Across Species by Body Size and Life Span
The mammalian species studied span the striped grass mouse to the elephant. Cancer incidence is not associated with mass and life span, as shown by the logistic regression (model fit shown as blue line; 95%CIs shown as dashed lines). Each data point in the graph is supported by a minimum of 10 necropsies for the included mammals (San Diego Zoo) and 644 annotated deaths for elephants (Elephant Encyclopedia database). The risk of cancer depends on both the number of cells in the body and the number of years over which those cells can accumulate mutations; therefore, cancer incidence is plotted as a function of mass × life span. All data with 95%CIs are presented in eTable 1 in the Supplement.
Figure 2
Figure 2. Group A and Group B TP53 Retrogenes in the African Elephant
A maximum likelihood phylogeny was used to cluster the sequenced TP53 retrogene clones and to confirm the number of unique genes uncovered in the African elephant genome. The phylogeny allows for visualization of TP53 retrogene similarity to one another as well as their relationship to the ancestral TP53 sequence in the elephant and hyrax. The capillary sequenced clones from this study are shown as black circles and published sequences from GenBank are shown as red squares. Gene identifiers and genomic coordinates are given in eTable 2 in the Supplement. Phylogenic analysis reveals at least 18 distinct clusters of processed TP53 copies (shown as colored blocks numbered 1 to 18). These clusters fall into 2 groups, labeled group A and group B. The branch labeled “elephant” is the coding sequence of the ancestral TP53, and “hyrax” represents the coding sequences from the hyrax TP53. The hyrax, on the upper left, is used as the outgroup to show that the hyrax and elephant ancestral TP53 sequences are more similar to each other than to the retrogenes, and also that the retrogenes evolved after the split between hyrax and elephant. The distances between the retrogene sequences display their relationship based on sequence similarity but do not represent precise evolutionary time estimates. These data were generated with DNA from 1 elephant to control for polymorphic bases between individual elephants.
Figure 3
Figure 3. African Elephant and Human Peripheral Blood Lymphocytes and Sensitivity to Ionizing Radiation
A, The percentage of late apoptosis (annexin V positive [AV+] and propidium iodide positive [PI+]) and B, early apoptosis (AV+PI−) in elephant peripheral blood lymphocytes compared with human peripheral blood lymphocytes in response to 2 Gy and 6 Gy of ionizing radiation are graphed. Significant differences computed with a 2-sided t test between human and elephant at 0, 5, 10, 18, and 24 hours are indicated. Error bars represent 95% CIs. C, Representative scatter plots from flow cytometry are shown from the 0- and 18-hour time points. NT indicates no treatment. aP <. 001. bPanel A: NT at 10 hours, P = .008. Panel B: NT at 0 hours, P = .002; 2 Gy at 5 hours, P = .003; 6 Gy at 5 hours, P = .004. cP = .03.
Figure 4
Figure 4. Apoptosis Response Relative to Number of Copies of TP53
Percentage of apoptosis is shown for peripheral blood lymphocytes treated with 2 Gy of ionizing radiation from 10 individuals with Li-Fraumeni syndrome (with 1 functioning TP53 allele), 10 healthy controls (with 2 TP53 alleles), and 1 African elephant tested in 3 independent experiments (with 40 TP53 alleles). Ionizing radiation–induced apoptosis increased proportionally with additional copies of TP53 and inversely correlated with cancer risk. Experiments performed in quadruplicate for each individual and each colored box represents the mean percentage of cells in late apoptosis as measured by flow cytometry (percentage of annexin V–positive [AV+] and propidium iodide–positive [PI+] treated cells minus AV+PI+ untreated cells). The healthy control lymphocytes underwent more apoptosis than those from LFS patients (P < .001), and elephant lymphocytes underwent more apoptosis than those from healthy controls (P < .001 by 2-sided t test). Horizontal lines indicate the combined mean for all data points in each group with error bars indicating 95%CIs.
Figure 5
Figure 5. Visualization of Apoptosis and DNA Damage in Human and Elephant Cells After Ionizing Radiation
DAPI, a nuclear stain that binds to DNA (blue), and phospho-histone H2AX foci (green) labeled peripheral blood lymphocytes (PBLs) 5 hours after 2 Gy of ionizing radiation show similar amounts of DNA damage. Apoptosis, rarely observed in the human cells, is visualized in the elephant cells (blue arrowheads indicate apoptotic cells with DNA fragmentation, identified by nuclear blebbing). Images displayed at 40× magnification.
Figure 6
Figure 6. p21 and p53 Protein Expression After Ionizing Radiation
Western blot at the indicated time points after ionizing radiation shows p21 and p53 protein expression in elephant and human lymphocytes. The p53 antibody detects only nonphosphorylated protein. GAPDH indicates glyceraldehyde 3-phosphate dehydrogenase, a protein-loading control; PBL, peripheral blood lymphocyte; NT, no treatment.
Figure 7
Figure 7. Asian Elephant Cells and DNA Damage Response
A, An example is shown of percentage of annexin V–positive (AV+) (apoptotic) lymphocytes from a 17-year-old Asian elephant compared with AV+ lymphocytes from an 18-year-old human 18 hours after ionizing radiation exposure. Error bars represent 95%CIs and significant differences computed with a 2-sided t test are indicated. B, Evidence of p21 protein expression is seen 5 hours after 2 Gy of ionizing radiation in Asian elephant lymphocytes. C, The apoptotic response in Asian elephant lymphocytes is shown to decrease with age (P = .002 by linear regression and P < .001 by Jonckheere-Terpstra tests). A single elephant of each indicated age was tested in triplicate. GAPDH indicates glyceraldehyde 3-phosphate dehydrogenase, a protein-loading control. aP = .006. bP < .001.

Comment in

References

    1. Tomasetti C, Vogelstein B. Cancer etiology: variation in cancer risk among tissues can be explained by the number of stem cell divisions. Science. 2015;347(6217):78–81. - PMC - PubMed
    1. Caulin AF, Maley CC. Peto’s Paradox: evolution’s prescription for cancer prevention. Trends Ecol Evol. 2011;26(4):175–182. - PMC - PubMed
    1. Peto R, Roe FJC, Lee PN, Levy L, Clack J. Cancer and ageing in mice and men. Br J Cancer. 1975;32(4):411–426. - PMC - PubMed
    1. Tian X, Azpurua J, Hine C, et al. High-molecular-mass hyaluronan mediates the cancer resistance of the naked mole rat. Nature. 2013;499(7458):346–349. - PMC - PubMed
    1. Gorbunova V, Hine C, Tian X, et al. Cancer resistance in the blind mole rat is mediated by concerted necrotic cell death mechanism. Proc Natl Acad Sci U S A. 2012;109(47):19392–19396. - PMC - PubMed

Publication types