. 2015 Oct 8;10(10):e0139833.
doi: 10.1371/journal.pone.0139833. eCollection 2015.

Identification of High-Risk Plaques by MRI and Fluorescence Imaging in a Rabbit Model of Atherothrombosis

Affiliations

Identification of High-Risk Plaques by MRI and Fluorescence Imaging in a Rabbit Model of Atherothrombosis

Ning Hua et al. PLoS One. .

Abstract

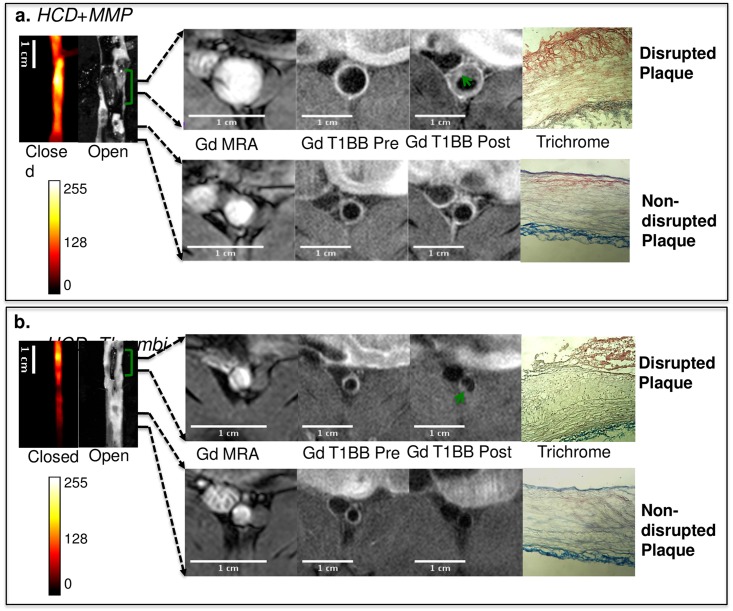
Introduction: The detection of atherosclerotic plaques at risk for disruption will be greatly enhanced by molecular probes that target vessel wall biomarkers. Here, we test if fluorescently-labeled Activatable Cell Penetrating Peptides (ACPPs) could differentiate stable plaques from vulnerable plaques that disrupt, forming a luminal thrombus. Additionally, we test the efficacy of a combined ACPP and MRI technique for identifying plaques at high risk of rupture.

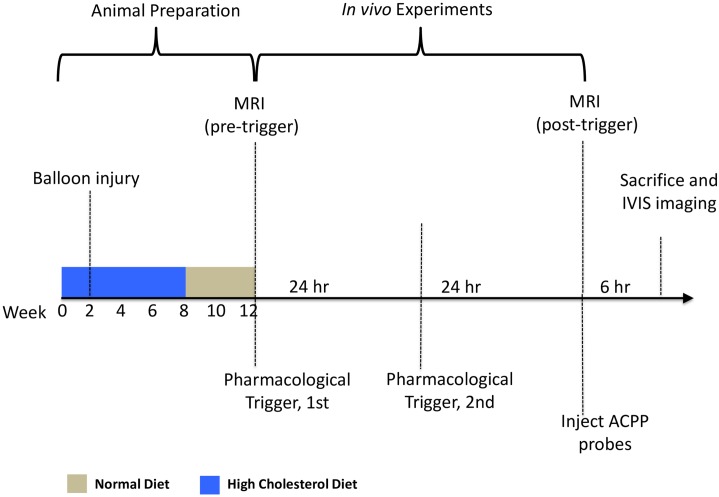
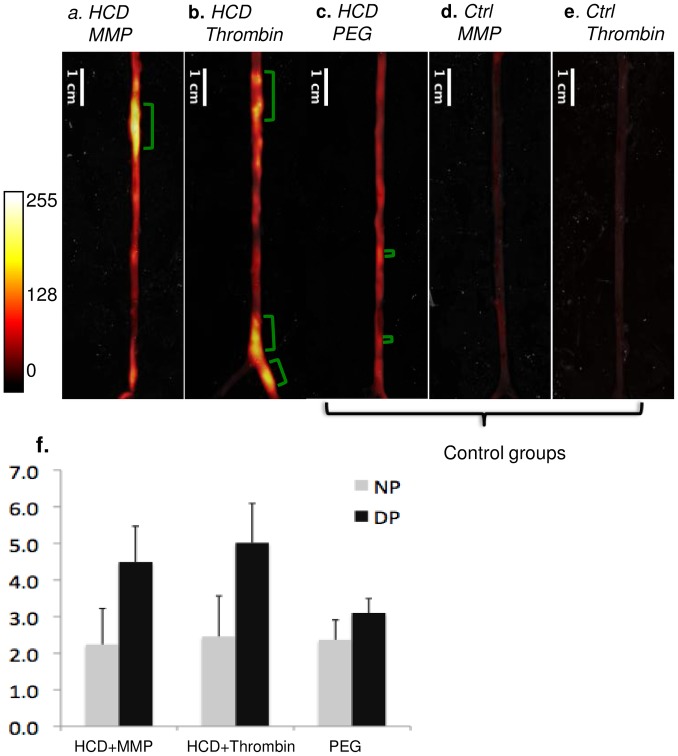
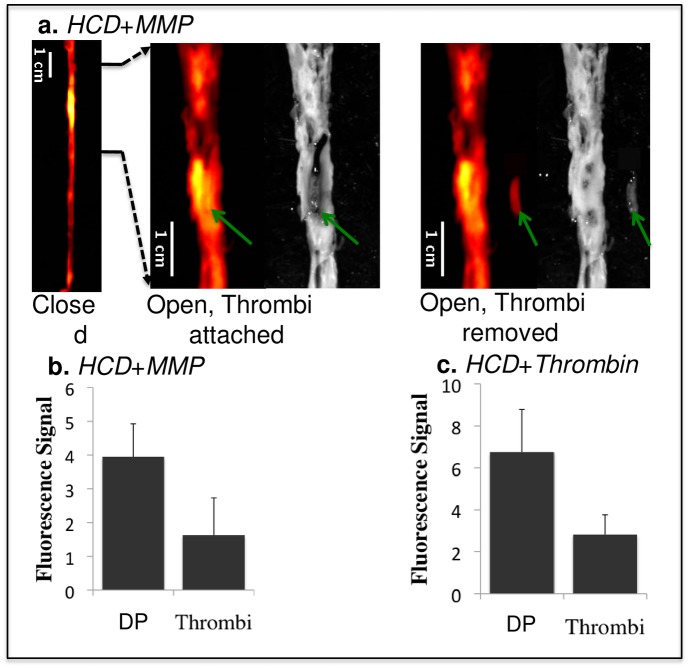
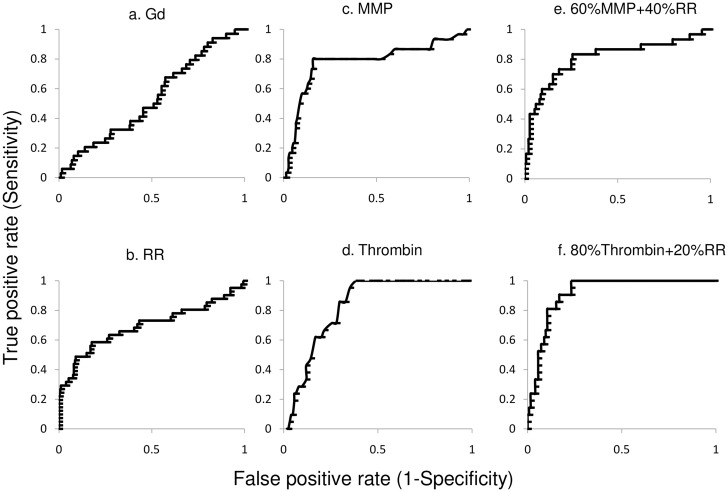
Methods and results: In an atherothrombotic rabbit model, disrupted plaques were identified with in vivo MRI and co-registered in the same rabbit aorta with the in vivo uptake of ACPPs, cleaved by matrix metalloproteinases (MMPs) or thrombin. ACPP uptake, mapped ex vivo in whole aortas, was higher in disrupted compared to non-disrupted plaques. Specifically, disrupted plaques demonstrated a 4.5~5.0 fold increase in fluorescence enhancement, while non-disrupted plaques showed only a 2.2~2.5 fold signal increase. Receiver operating characteristic (ROC) analysis indicates that both ACPPs (MMP and thrombin) show high specificity (84.2% and 83.2%) and sensitivity (80.0% and 85.7%) in detecting disrupted plaques. The detection power of ACPPs was improved when combined with the MRI derived measure, outward remodeling ratio.

Conclusions: Our targeted fluorescence ACPP probes distinguished disrupted plaques from stable plaques with high sensitivity and specificity. The combination of anatomic, MRI-derived predictors for disruption and ACPP uptake can further improve the power for identification of high-risk plaques and suggests future development of ACPPs with molecular MRI as a readout.


Conflict of interest statement

Competing Interests: The authors have declared that no competing interests exist.

Figures

Fig 1
Fig 1. Timeline of the experiments.
The animal preparation period took 12 weeks in total. Rabbits were fed on high cholesterol (1%) diet for continuous 8 weeks, followed by a 4-week normal diet treatment. The balloon surgery was given to rabbits two weeks into the high cholesterol diet to introduce endothelial denudation. After the animal preparation, pre- and post-trigger MRI scans were performed 48 hours apart prior and after two pharmacological triggerings. The ACPP probe was injected into rabbits intravenously after the 2nd MRI section and allowed to circulate for 6 hours. The animals then were sacrificed and the fluorescent imaging was performed on extracted aortas.
Fig 2
Fig 2. Identification of thrombus.
The aorta was cut open longitudinally to reveal the internal structure. One dark region (green bracket) on the reflected image (a) represents an attached thrombus. However, the dark region in the reflected images is a not reliable criterion as white-light visual inspection, since dark regions may also indicate clotted blood and or normal vascular wall without presence of fatty streaks. The gold standard to verify the presence of a thrombus is visualization by naked eye in the excised aorta, shown as the example light-microscopy photo (b).
Fig 3
Fig 3. Representative ex-vivo fluorescence images of rabbits in 5 experimental groups.
group A, HCD + MMP-ACPP(a); group B, HCD + Thrombin-ACPP (b); group C, HCD + PEG-ACPP(c); group D, normal diet + MMP-ACPP(d); normal diet + Thrombin-ACPP(e). Note that only one probe is injected into an animal, and all figures are from different animals. Within each experimental group, the closed view fluorescent images are presented with overlaid reflected images. The locations of thrombi are indicated by green brackets. Two-tailed t-test showed that fluorescence of ACPP probes was significantly higher in disrupted regions (DP) (p<0.001) compared to non-disrupted plaque regions (NP), whereas the non-cleavable PEG-ACPP had similar uptake into both regions (f).
Fig 4
Fig 4. Comparison of fluorescence signals from thrombi and the surrounding atherosclerotic plaque in the experimental group.
HCD + MMP-ACPP (a,b) and HCD + Thrombin-ACPP(c). The images from left to right in a are: closed view fluorescence image, opened and zoomed-in fluorescence/reflected images with the thrombus (green arrows) attached at its original site, opened and zoomed-in fluorescence/reflected images with the thrombus removed. The dark signal of the aorta on the reflected image comes from clotted blood and relatively healthy vessel wall (without obvious fatty streaks). Plaques appeared as brighter (gray-ish) signal. The bar graphs (b,c) give the statistical analysis of fluorescence signal for the underlying disrupted plaques (DP) and the overlaying thrombi (p<0.001).
Fig 5
Fig 5. Representative fluorescence images and co-registered MRI images for rabbits from group A: HCD + MMP-ACPP(a) and group B: HCD + Thrombin-ACPP(b).
The closed view of the fluorescence images shows a sub-section of abdominal aorta and the corresponding open view reflected images showing the location of thrombi (green brackets). The regions within the two black lines represent examples of non-disrupted and disrupted plaques respectively, and correspond to the MRI images on the right. All MRI images were obtained after gadolinium-DTPA injection according to our acquisition protocols; illustrated are the pre-triggering MRA and the fat-suppressed T1BB images obtained before and after pharmacological triggering (from left to right). Thrombi are marked by green arrows in post-triggering Gd-T1BB (T1 black blood) images. With the current resolution of MRI, it is very difficult to distinguish different layers of plaque. Hence, in the post-triggering MRI, the formed thrombus, which is on a relatively macro-scale, instead of plaque details, was observed. The corresponding histological images (after the thrombus was removed) with trichrome staining were presented on the very right column.
Fig 6
Fig 6. ROC analyses.
The Gd-DTPA uptake did not show a strong prediction for plaque rupture, with AUC = 0.51±0.05 (a). The remodeling-ratio (RR) showed an AUC of 0.69±0.05 (b). Its optimal cutoff was 1.06, with a corresponding specificity of 84.2% and sensitivity of 58.5%. The area under the curve (AUC) was 0.79±0.05 for the MMP-ACPP (c) and 0.90±0.05 for the Thrombin-ACPP probe (d). The optimal cutoff threshold was 3.5/4.0 fold (MMP-ACPP/Thrombin-ACPP), with corresponding specificities of 84.2%/ 83.2% and sensitivities of 80.0%/ 85.7%. The detection power for plaque disruption was further increased when both MRI remodeling ratio and ACPP uptake was considered together. For the MMP-ACPP, the maximum AUC (0.81±0.05) was achieved when the combined predictor had contributions comprised of 60% ACPP uptake and 40% remodeling ratio (e). Similarly, for the thrombin probe the maximum AUC (0.92±0.05) was achieved when the combined predictor contributed by 80% ACPP uptake and 20% remodeling ratio (f).

References

    1. Roger VL, Go AS, Lloyd-Jones DM, Adams RJ, Berry JD, Brown TM, et al. Heart disease and stroke statistics–-2011 update: a report from the American Heart Association. Circulation. 2011. February 1;123(4):e18–e209. 10.1161/CIR.0b013e3182009701 - DOI - PMC - PubMed
    1. Libby P. Inflammation in atherosclerosis. Arterioscler Thromb Vasc Biol. 2012. September;32(9):2045–51. 10.1161/ATVBAHA.108.179705 - DOI - PMC - PubMed
    1. Lusis AJ. Atherosclerosis. Nature. 2000. September 14;407(6801):233–41. - PMC - PubMed
    1. Makowski MR, Wiethoff AJ, Blume U, Cuello F, Warley A, Jansen CHP, et al. Assessment of atherosclerotic plaque burden with an elastin-specific magnetic resonance contrast agent. Nat Med. 2011. March;17(3):383–8. 10.1038/nm.2310 - DOI - PubMed
    1. Amirbekian V, Lipinski MJ, Briley-Saebo KC, Amirbekian S, Aguinaldo JGS, Weinreb DB, et al. Detecting and assessing macrophages in vivo to evaluate atherosclerosis noninvasively using molecular MRI. Proc Natl Acad Sci USA. 2007. January 16;104(3):961–6. - PMC - PubMed

Publication types