. 2015 Aug 1:9:83-94.
doi: 10.1016/j.nicl.2015.07.009. eCollection 2015.

Mapping causal functional contributions derived from the clinical assessment of brain damage after stroke

Affiliations

Mapping causal functional contributions derived from the clinical assessment of brain damage after stroke

Melissa Zavaglia et al. Neuroimage Clin. .

Abstract

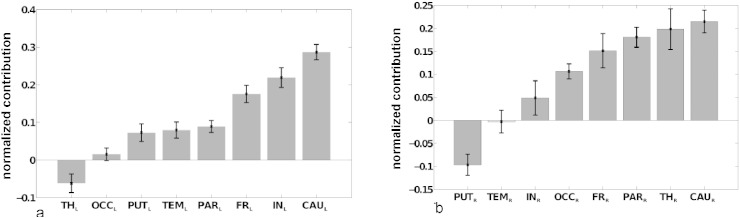
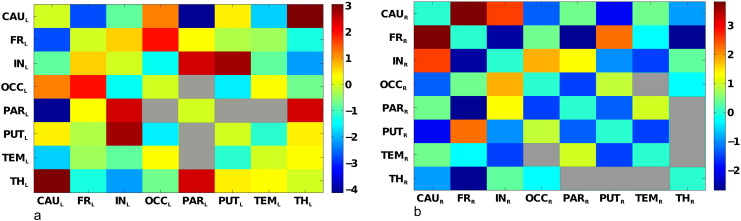
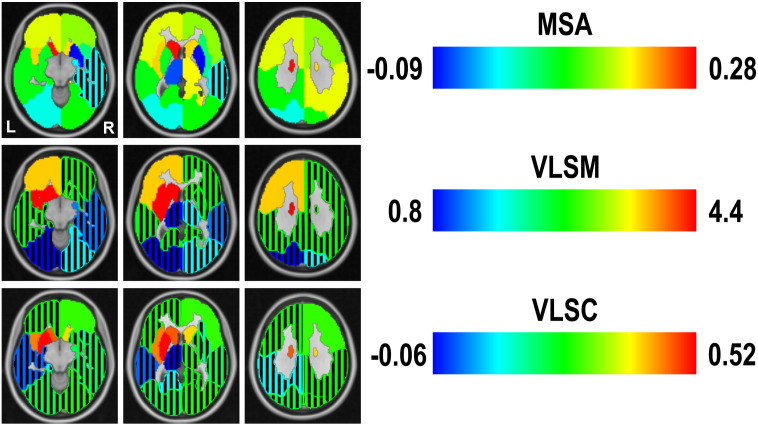
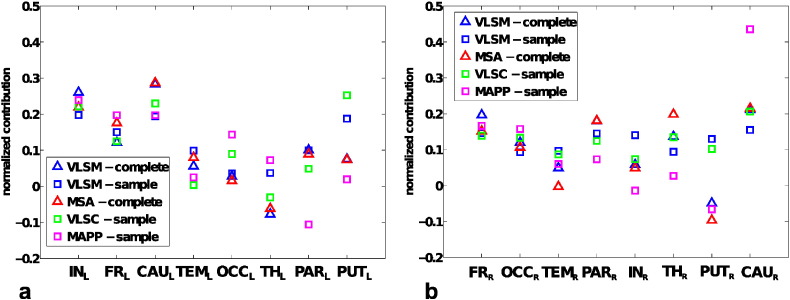
Lesion analysis reveals causal contributions of brain regions to mental functions, aiding the understanding of normal brain function as well as rehabilitation of brain-damaged patients. We applied a novel lesion inference technique based on game theory, Multi-perturbation Shapley value Analysis (MSA), to a large clinical lesion dataset. We used MSA to analyze the lesion patterns of 148 acute stroke patients together with their neurological deficits, as assessed by the National Institutes of Health Stroke Scale (NIHSS). The results revealed regional functional contributions to essential behavioral and cognitive functions as reflected in the NIHSS, particularly by subcortical structures. There were also side specific differences of functional contributions between the right and left hemispheric brain regions which may reflect the dominance of the left hemispheric syndrome aphasia in the NIHSS. Comparison of MSA to established lesion inference methods demonstrated the feasibility of the approach for analyzing clinical data and indicated its capability for objectively inferring functional contributions from multiple injured, potentially interacting sites, at the cost of having to predict the outcome of unknown lesion configurations. The analysis of regional functional contributions to neurological symptoms measured by the NIHSS contributes to the interpretation of this widely used standardized stroke scale in clinical practice as well as clinical trials and provides a first approximation of a 'map of stroke'.

Keywords: CT, computer tomography; DWI, diffusion weighted imaging; Game-theory; Lesion inference; MAPP, Multi-Area Pattern Prediction; MCA, middle cerebral artery; MRI, magnetic resonance imaging; MSA, Multi-perturbation Shapley value Analysis; MVPA, Multi-Variate Pattern Analysis; Multi-perturbation Shapley value Analysis (MSA); NIHSS; NIHSS, National Institutes of Health Stroke Scale; SVM, support vector machine; VAL, voxel-based analysis of lesions; VBM, voxel-based morphometry; VLSC, VOI-based Lesion Symptom Correlation; VLSM, Volume-based Lesion Symptom Mapping; VOI, volume of interest.


Figures

Fig. 1
Fig. 1
Pipeline for registration and quantitative lesion image processing. Left: the brain tissue is automatically segmented in the DWI dataset and used to generate a 3D surface model. A corresponding 3D surface model is also generated based on the atlas brain segmentation, which is then used to calculate the optimal transformation to the DWI dataset using an iterative closest point algorithm (ICP). Right: the resulting transformation is employed to align the structural regions defined in the atlas with the patient-specific DWI dataset. After semi-automatic segmentation of the lesion in the DWI dataset, the transformed structural brain regions can be used to calculate the individual lesion overlap values. The lesion overlap visualization also depicts the eight bilateral VOIs used in the present study.
Fig. 2
Fig. 2
Lesion Overlap in MNI152 standard atlas space. From top to bottom, representation of MNI atlas (we selected three representative slices from the MNI atlas that covered all structural regions), Lesion Overlap and Median VOI Lesion Overlap, in neurological convention. While the lesion overlap focuses at the scale of voxels, median VOI lesion overlap shows the relative (median percentage) infarction within the confines of the predefined 2 × 8 VOIs.
Fig. 3
Fig. 3
Lesion size of VOIs and associated NIHSS. (a) Absolute and (b) relative lesion size (in % of lesioned voxels) of 2 × 8 VOIs and associated global NIHSS values for 148 patients. In each panel, the color scale indicates on its left axis the absolute (graded from zero to 13,202) or relative (graded from 0 to 100%) lesion size and on the right axis the range of associated NIHSS values (from zero to 21). The 148 cases (indicated by patient ID) were separated into left- and right-hemispheric lesions by sorting in descending order the difference between total lesion size in the left and right hemispheres.
Fig. 4
Fig. 4
Relative functional contributions indicated by MSA. Normalized mean MSA contribution values (±SD) for inverse global NIHSS, computed separately for left- and right-sided lesion cases, using the binary dataset for the prediction of all performance scores corresponding to the full lesion configuration set by linear kernel SVM. Significant contributions (after Bonferroni correction) are shown in gray (all contributions are significant except for right temporal lobe).
Fig. 5
Fig. 5
Functional interactions among VOIs. Matrix representation of (symmetric) mean functional interactions of (a) left and (b) right VOIs. The color scales indicate the range of variation of left (a) and right (b) mean functional interactions. In (a), all interactions are significantly different from zero (after Bonferroni correction), except between parietal–occipital, parietal–putamen and parietal–temporal regions (represented as gray entries in the matrix). In (b), all interactions are significantly different from zero (after Bonferroni correction), except between temporal–occipital, temporal–thalamus, thalamus–parietal, thalamus–putamen regions (represented as gray entries in the matrix).
Fig. 6
Fig. 6
Comparison approaches of lesion inference. Comparison based on the MNI atlas (we selected 3 slices from the MNI atlas that are representative to cover all structural regions) between correlation coefficients computed with VOI-based Lesion Symptom Correlation, t-scores obtained with Volume-based Lesion Symptom Mapping and normalized mean contribution values for global inverse NIHSS obtained with MSA. The color map is the same for all measures, but at different scales. Black stripes indicate VOIs without a significant value.
Fig. 7
Fig. 7
Comparison of indicators of functional contributions. Normalized indicators of functional contributions, computed for sampled and complete-predicted datasets, sorted by increasing range of variation, for left and right hemispheres.

Similar articles

Cited by

References

    1. Baba K., Shibata R., Sibuya M. Partial correlation and conditional correlation as measures of conditional independence. Aust. N. Z. J. Stat. 2004;46(4):657–664.
    1. Bates E., Wilson S.M., Saygin A.P., Dick F., Sereno M.I., Knight R.T., Dronkers N.F. Voxel-based lesion-symptom mapping. Nat. Neurosci. 2003;6(5):448–450. 12704393 - PubMed
    1. Besl P.J., McKay H.D. A method for registration of 3-D shapes. I.E.E.E. Transactions Pattern Anal. Mach. Intell. 1992;14(2):239–256.
    1. Brott T., Adams H.P., Olinger C.P., Marler J.R., Barsan W.G., Biller J., Spilker J., Holleran R., Eberle R., Hertzberg V. Measurements of acute cerebral infarction: a clinical examination scale. Stroke. 1989;20(7):864–870. 2749846 - PubMed
    1. Chang C.-C., Lin C.-J. LIBSVM: a Library for Support Vector Machines. A.C.M. Transactions Intell. Syst. Technol. 2011;2(3):1–27.

Publication types