

Impaired target detection in schizophrenia and the ventral attentional network: Findings from a joint event-related potential-functional MRI analysis
- PMID: 26448909
- PMCID: PMC4552813
- DOI: 10.1016/j.nicl.2015.07.004
Impaired target detection in schizophrenia and the ventral attentional network: Findings from a joint event-related potential-functional MRI analysis
Abstract
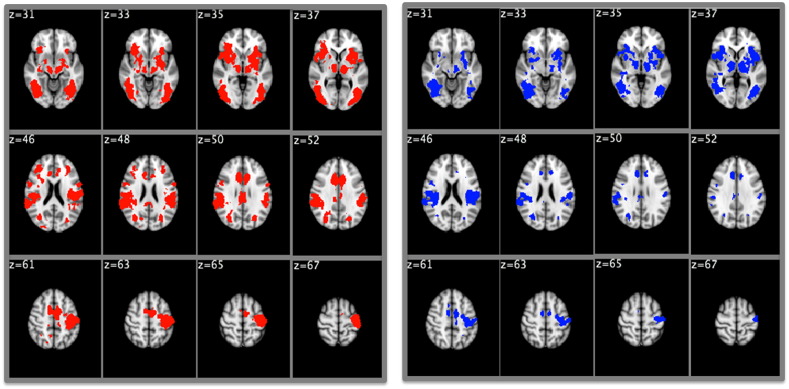
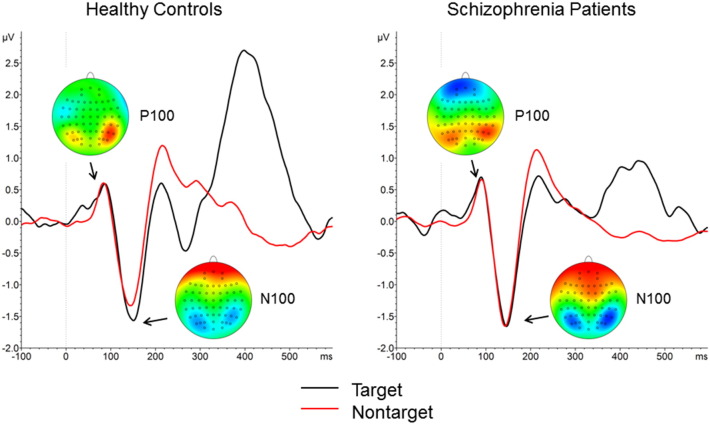
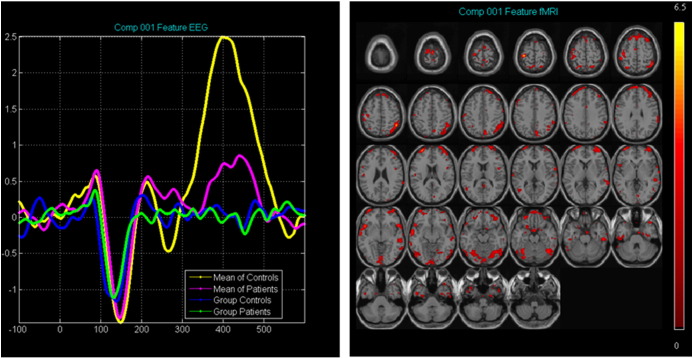
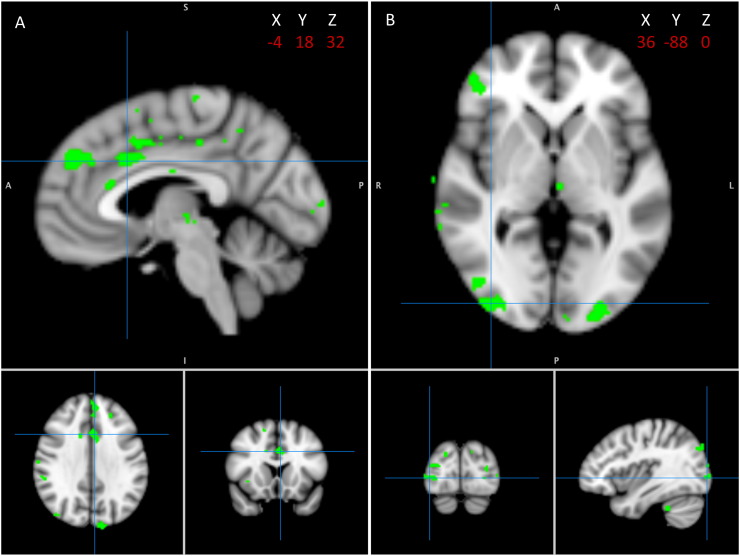
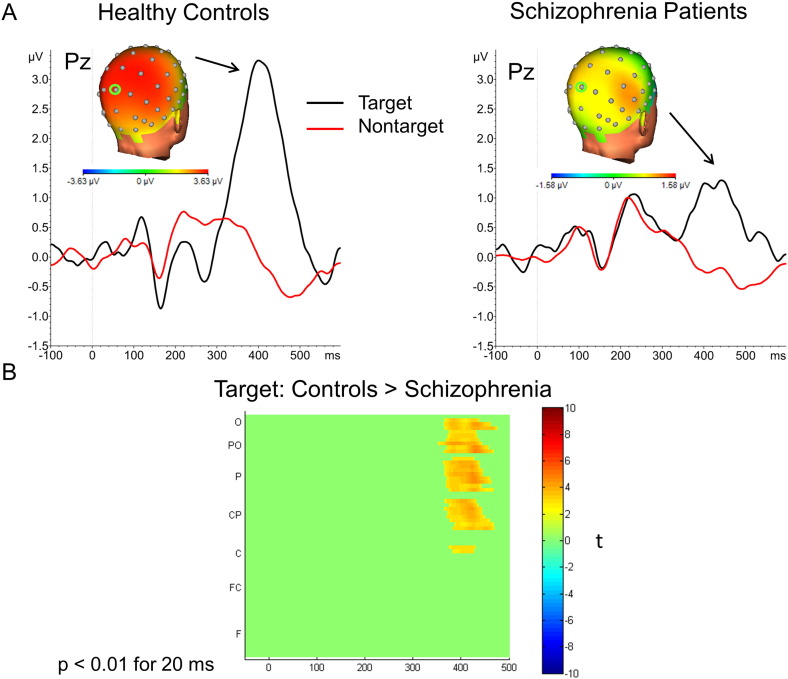
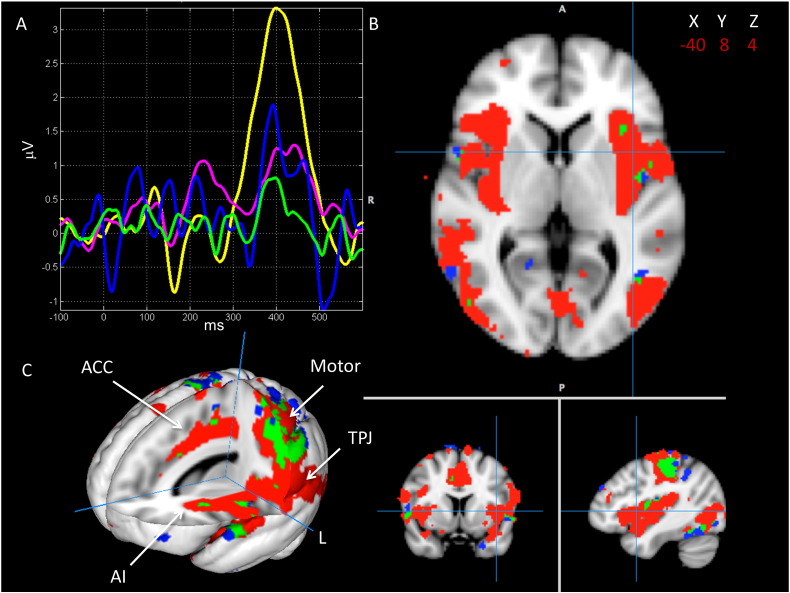
Schizophrenia patients have abnormal neural responses to salient, infrequent events. We integrated event-related potentials (ERP) and fMRI to examine the contributions of the ventral (salience) and dorsal (sustained) attention networks to this dysfunctional neural activation. Twenty-one schizophrenia patients and 22 healthy controls were assessed in separate sessions with ERP and fMRI during a visual oddball task. Visual P100, N100, and P300 ERP waveforms and fMRI activation were assessed. A joint independent components analysis (jICA) on the ERP and fMRI data were conducted. Patients exhibited reduced P300, but not P100 or N100, amplitudes to targets and reduced fMRI neural activation in both dorsal and ventral attentional networks compared with controls. However, the jICA revealed that the P300 was linked specifically to activation in the ventral (salience) network, including anterior cingulate, anterior insula, and temporal parietal junction, with patients exhibiting significantly lower activation. The P100 and N100 were linked to activation in the dorsal (sustained) network, with no group differences in level of activation. This joint analysis approach revealed the nature of target detection deficits that were not discernable by either imaging methodology alone, highlighting the utility of a multimodal fMRI and ERP approach to understand attentional network deficits in schizophrenia.
Keywords: ERP; Joint ICA; Oddball; Salience network; fMRI.
Figures
Similar articles
-
Aberrant activity in conceptual networks underlies N400 deficits and unusual thoughts in schizophrenia.Neuroimage Clin. 2019;24:101960. doi: 10.1016/j.nicl.2019.101960. Epub 2019 Jul 23. Neuroimage Clin. 2019. PMID: 31398555 Free PMC article.
-
Visual attention circuitry in schizophrenia investigated with oddball event-related functional magnetic resonance imaging.Am J Psychiatry. 2007 Mar;164(3):442-9. doi: 10.1176/ajp.2007.164.3.442. Am J Psychiatry. 2007. PMID: 17329469
-
Functional connectivity when detecting rare visual targets in schizophrenia.Psychiatry Res Neuroimaging. 2017 Mar 30;261:35-43. doi: 10.1016/j.pscychresns.2017.01.007. Epub 2017 Jan 17. Psychiatry Res Neuroimaging. 2017. PMID: 28126618 Free PMC article.
-
Review of neurophysiological findings in patients with schizophrenia.Psychiatry Clin Neurosci. 2013 Nov;67(7):461-70. doi: 10.1111/pcn.12090. Epub 2013 Sep 19. Psychiatry Clin Neurosci. 2013. PMID: 24102977 Review.
-
Neurophysiological measures of sensory registration, stimulus discrimination, and selection in schizophrenia patients.Curr Top Behav Neurosci. 2010;4:283-309. doi: 10.1007/7854_2010_59. Curr Top Behav Neurosci. 2010. PMID: 21312404 Review.
Cited by
-
Functional Connectivity Alterations of Within and Between Networks in Schizophrenia: A Retrospective Study.Basic Clin Neurosci. 2023 May-Jun;14(3):397-409. doi: 10.32598/bcn.2022.3928.2. Epub 2023 May 1. Basic Clin Neurosci. 2023. PMID: 38077180 Free PMC article.
-
Combination of volume and perfusion parameters reveals different types of grey matter changes in schizophrenia.Sci Rep. 2017 Mar 27;7(1):435. doi: 10.1038/s41598-017-00352-z. Sci Rep. 2017. PMID: 28348393 Free PMC article.
-
Impairment of novelty-related theta oscillations and P3a in never medicated first-episode psychosis patients.NPJ Schizophr. 2021 Feb 26;7(1):15. doi: 10.1038/s41537-021-00146-3. NPJ Schizophr. 2021. PMID: 33637757 Free PMC article.
-
Using concurrent EEG and fMRI to probe the state of the brain in schizophrenia.Neuroimage Clin. 2016 Aug 10;12:429-41. doi: 10.1016/j.nicl.2016.08.009. eCollection 2016. Neuroimage Clin. 2016. PMID: 27622140 Free PMC article.
-
Organization of the human cerebral cortex estimated within individuals: networks, global topography, and function.J Neurophysiol. 2024 Jun 1;131(6):1014-1082. doi: 10.1152/jn.00308.2023. Epub 2024 Mar 15. J Neurophysiol. 2024. PMID: 38489238 Free PMC article.
References
-
- Bledowski C., Prvulovic D., Hoechstetter K., Scherg M., Wibral M., Goebel R., Linden D.E. Localizing P300 generators in visual target and distractor processing: a combined event-related potential and functional magnetic resonance imaging study. J. Neurosci. 2004;24(42):9353–9360. 15496671 - PMC - PubMed
Publication types
MeSH terms
Grants and funding
LinkOut - more resources
Full Text Sources
Other Literature Sources
Medical
Molecular Biology Databases
Miscellaneous
