Randomized Controlled Trial
. 2015 Oct 9:6:8495.
doi: 10.1038/ncomms9495.

Immunological biomarkers predict HIV-1 viral rebound after treatment interruption

Affiliations
Randomized Controlled Trial

Immunological biomarkers predict HIV-1 viral rebound after treatment interruption

Jacob Hurst et al. Nat Commun. .

Abstract

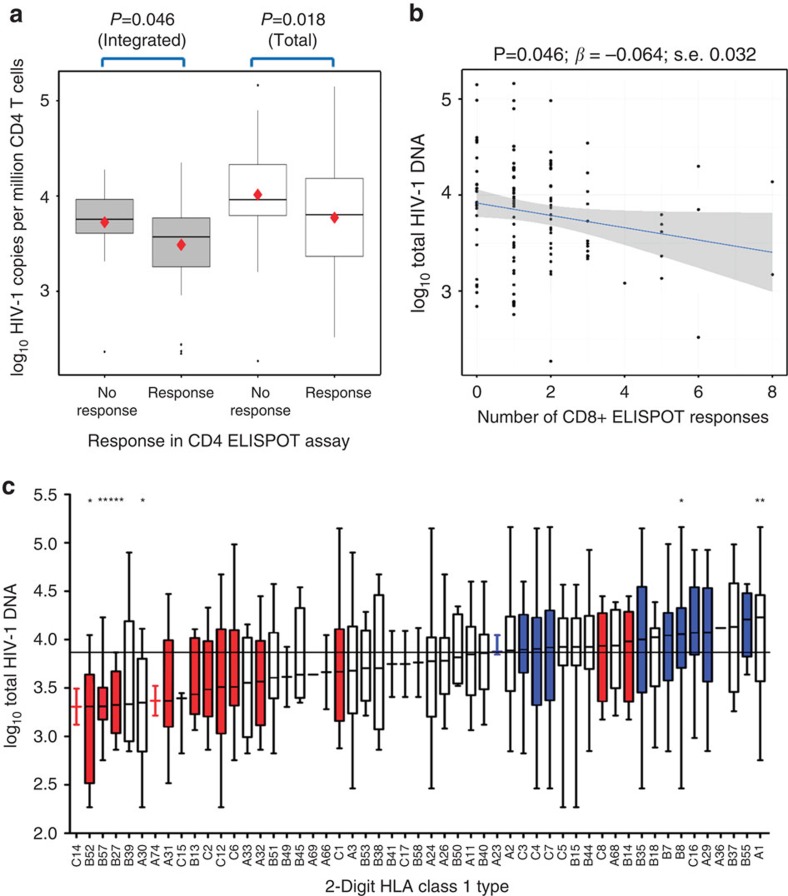
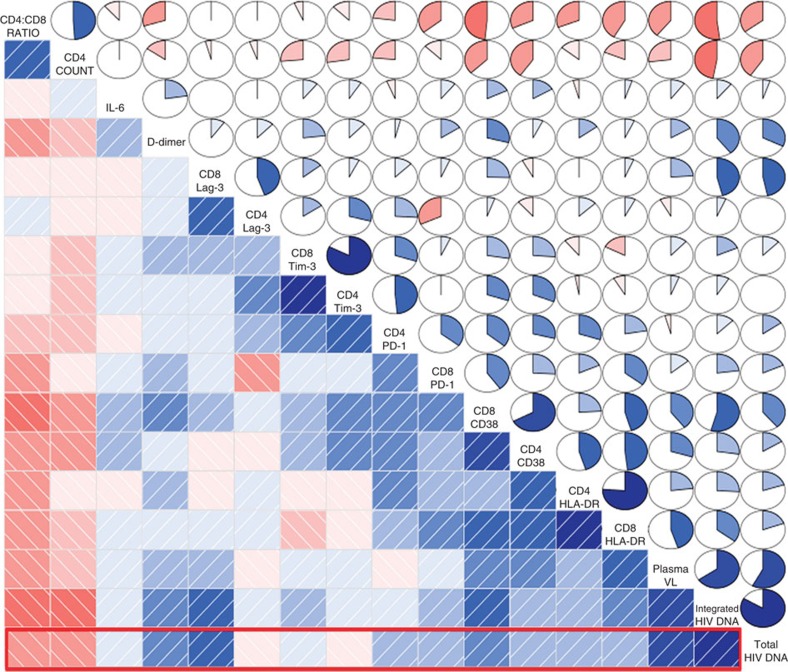
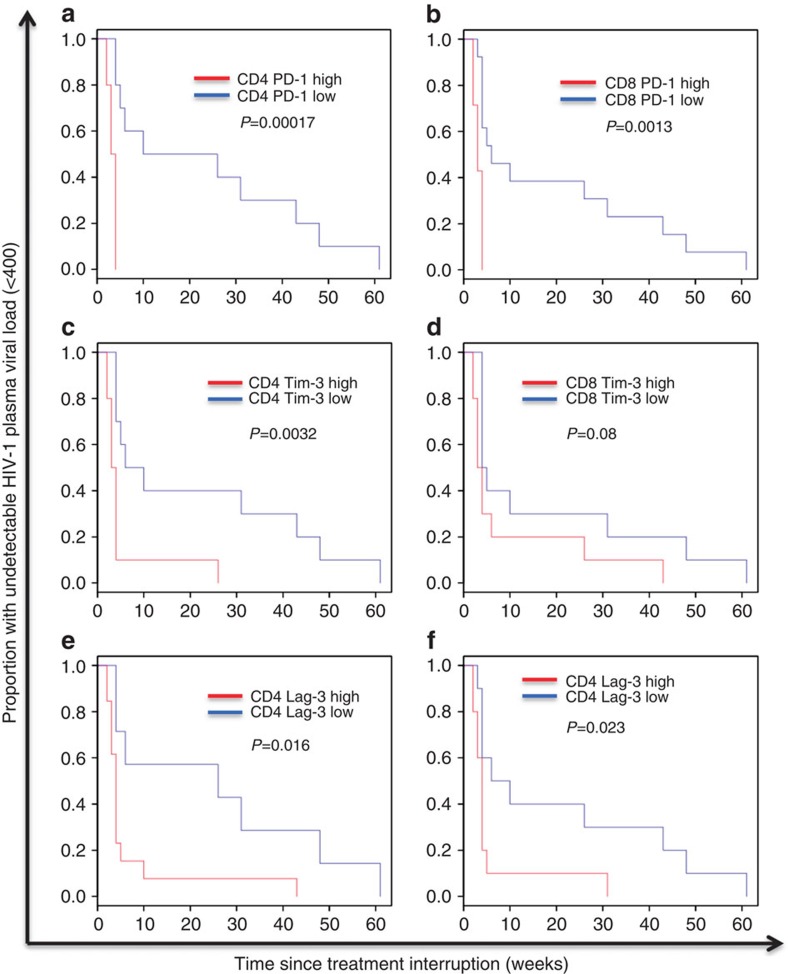
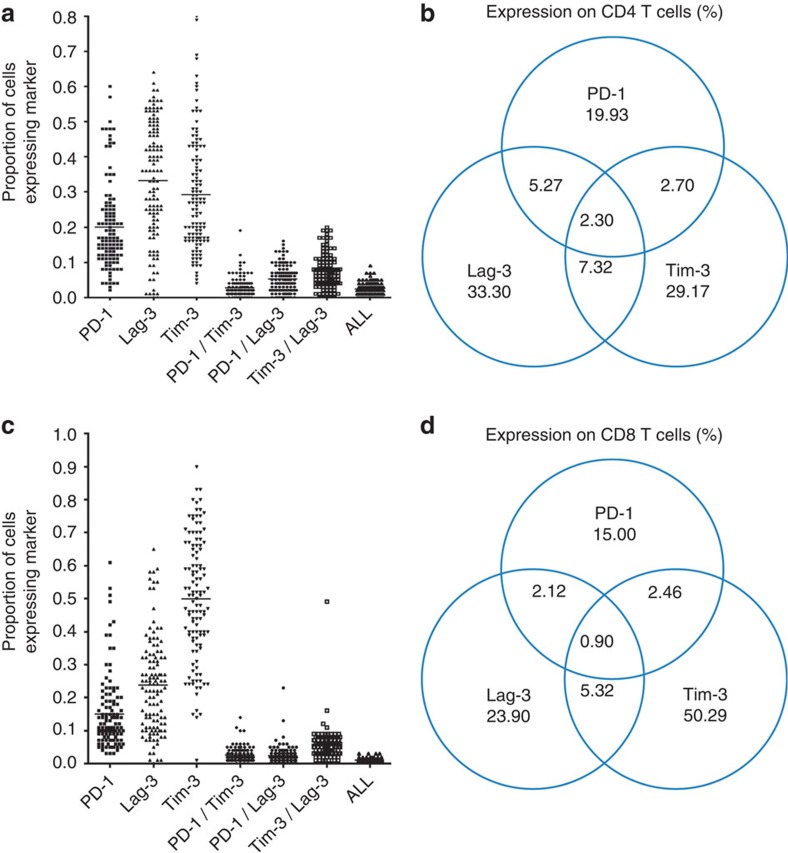
Treatment of HIV-1 infection with antiretroviral therapy (ART) in the weeks following transmission may induce a state of 'post-treatment control' (PTC) in some patients, in whom viraemia remains undetectable when ART is stopped. Explaining PTC could help our understanding of the processes that maintain viral persistence. Here we show that immunological biomarkers can predict time to viral rebound after stopping ART by analysing data from a randomized study of primary HIV-1 infection incorporating a treatment interruption (TI) after 48 weeks of ART (the SPARTAC trial). T-cell exhaustion markers PD-1, Tim-3 and Lag-3 measured prior to ART strongly predict time to the return of viraemia. These data indicate that T-cell exhaustion markers may identify those latently infected cells with a higher proclivity to viral transcription. Our results may open new avenues for understanding the mechanisms underlying PTC, and eventually HIV-1 eradication.


Figures

Figure 1
Figure 1. HIV-1 DNA is associated with HIV-1-specific T-cell immunity and HLA class I alleles.
HIV-1 DNA levels presented according to whether the participant made a (a) CD4 or (b) CD8 interferon gamma ELISPOT response to HIV-1 Gag. Grey and white box and whisker plots represent Integrated and Total HIV-1 DNA, respectively, with diamonds indicating mean values: ‘Integrated No response' 3.72, ‘Integrated Response' 3.49, ‘Total No Response' 4.01, ‘Total Response' 3.77 log10 copies per million CD4 T cells, respectively. Significance determined using (a) t-tests and (b) linear regression. HIV-1 DNA reported as log10 copies per million CD4 T cells. Patient numbers: for ‘No Response' and ‘Response' for Total (n=33 and 60) and for Integrated (n=27 and 45), respectively. For 0, 1, 2, 3+ CD8+ T-cell responses for Total (n=22, 40, 25 and 20) and Integrated (n=22, 30, 23 and 17), respectively. (c) HLA Class I alleles ranked according to the median value of Total HIV-1 DNA, presented as box and whisker plots. Red and blue bars represent alleles associated with HIV-1 control and rapid progression, respectively. The horizontal black line represents the median value of the cohort and the box represents the inter-quartile range. The whiskers extend to the largest value within 1.5*IQR, with additional data points showing outliers. Patient numbers given in Supplementary Table 3. 0.01<*P<0.05, 0.001<**P<0.01, ***P<0.0001. Significance determined by Mann–Whitney test of target population against the rest of the patient samples.
Figure 2
Figure 2. Correlogram of baseline virological and immunological variables.
Heat maps and pie charts are used to indicate the strength of associations between potential biomarkers, with ordering determined by hierarchical clustering. Red indicates a negative correlation between the variables, blue a positive correlation. Size of pie and intensity of the colour indicates the strength of the association. Heat maps for associations with HIV-1 Total DNA are indicated with the red box.
Figure 3
Figure 3. Expression of T-cell exhaustion markers measured at baseline and survival analyses for time to viral load rebound.
For each Kaplan–Meier analysis, the variable was stratified into ‘high' and ‘low' at the median level. Median values were 4.87% and 8.15% for PD-1, 14.65% and 11.85% for Tim-3, and 7.60% and 14.15% for Lag-3 on CD8 and CD4 T cells, respectively. P values determined by log rank test. N=20 for each analysis. (a,b) CD4 and CD8 PD-1 expression, respectively. (c,d) CD4 and CD8 Tim-3, respectively. (e,f) CD4 and CD8 Lag-3, respectively.
Figure 4
Figure 4. Co-expression of immune checkpoint markers.
Data plots and Venn diagrams to show expression of one, two or three exhaustion markers (Tim-3, Lag-3 and PD-1) at pre-therapy baseline on CD4 (n=120) (a,b) and CD8 (n=118) (c,d) T cells. Figures represent the percentage contribution to different combinations of expression of the three markers with overall expression normalized to 100%.

Similar articles

Cited by

References

    1. Palella F. J. J. et al.. Declining morbidity and mortality among patients with advanced human immunodeficiency virus infection. HIV outpatient study investigators. N. Engl. J. Med. 338, 853–860 (1998). - PubMed
    1. Wada N. et al.. Cause-specific mortality among HIV-infected individuals, by CD4(+) cell count at HAART initiation, compared with HIV-uninfected individuals. AIDS 28, 257–265 (2014). - PMC - PubMed
    1. Samji H. et al.. Closing the gap: increases in life expectancy among treated HIV-positive individuals in the United States and Canada. PLoS ONE 8, e81355 (2013). - PMC - PubMed
    1. Finzi D. et al.. Identification of a reservoir for HIV-1 in patients on highly active antiretroviral therapy. Science 278, 1295–1300 (1997). - PubMed
    1. Stöhr W. et al.. Duration of HIV-1 viral suppression on cessation of antiretroviral therapy in primary infection correlates with time on therapy. PLoS ONE 8, e78287 (2013). - PMC - PubMed

Publication types