. 2015 Oct 9:5:14941.
doi: 10.1038/srep14941.

Profiling RNA editing in human tissues: towards the inosinome Atlas

Affiliations

Profiling RNA editing in human tissues: towards the inosinome Atlas

Ernesto Picardi et al. Sci Rep. .

Erratum in

Abstract

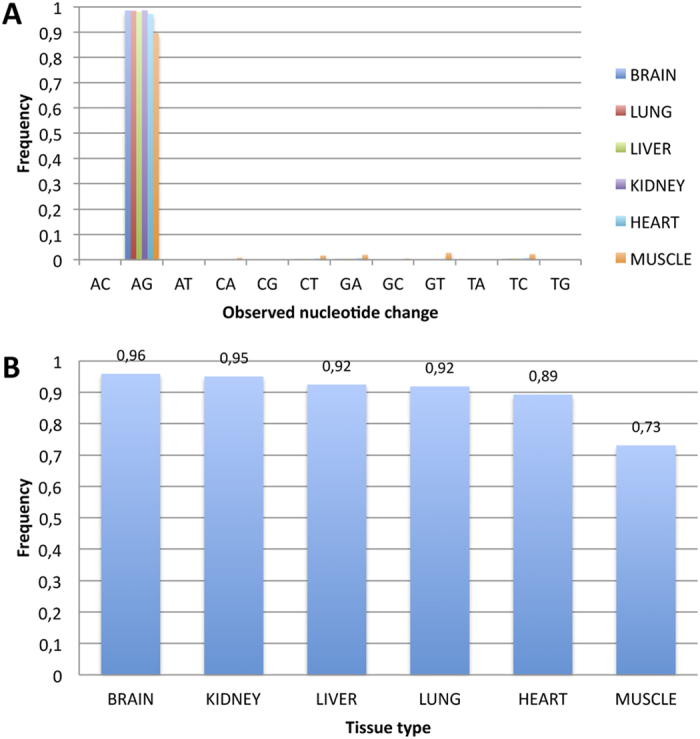
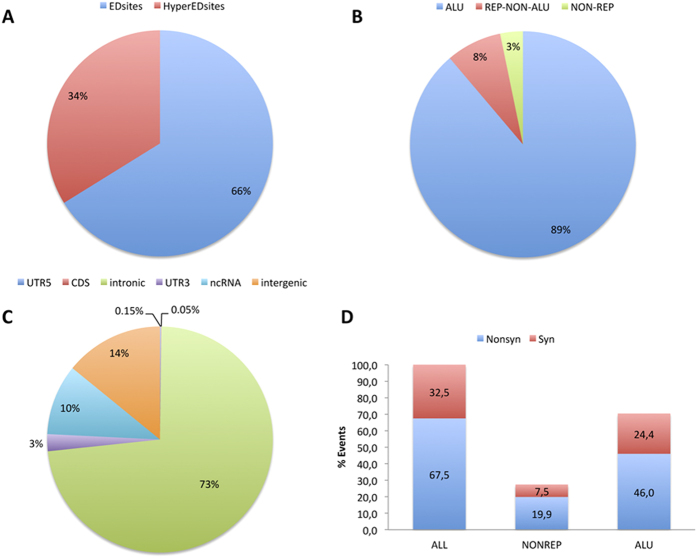
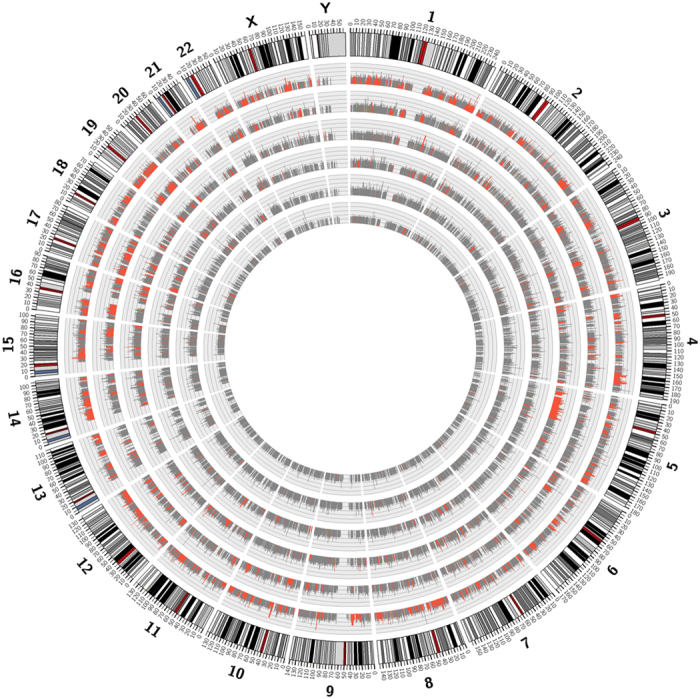
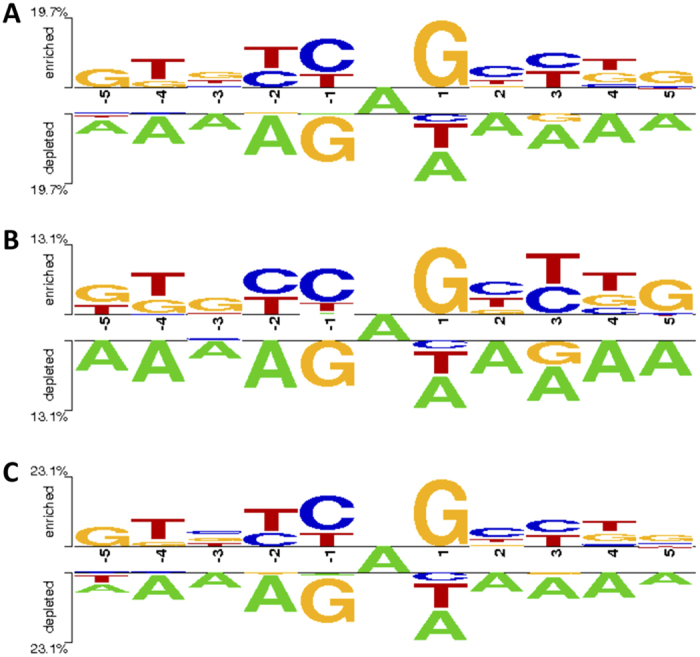
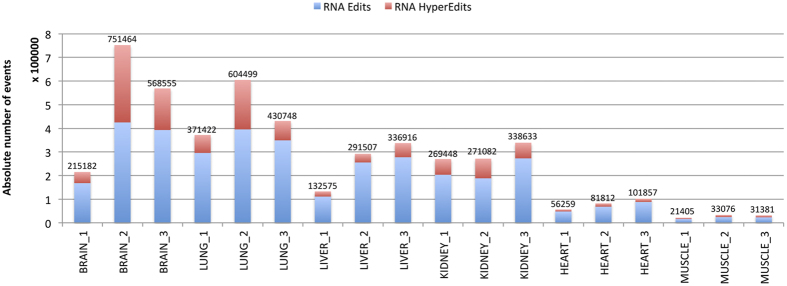
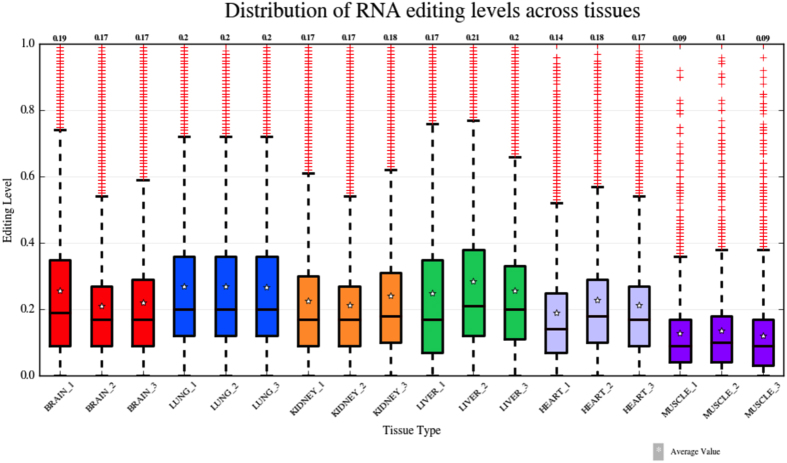
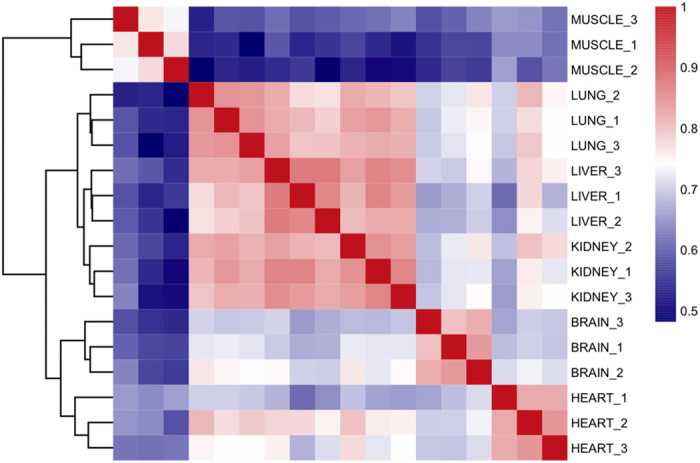
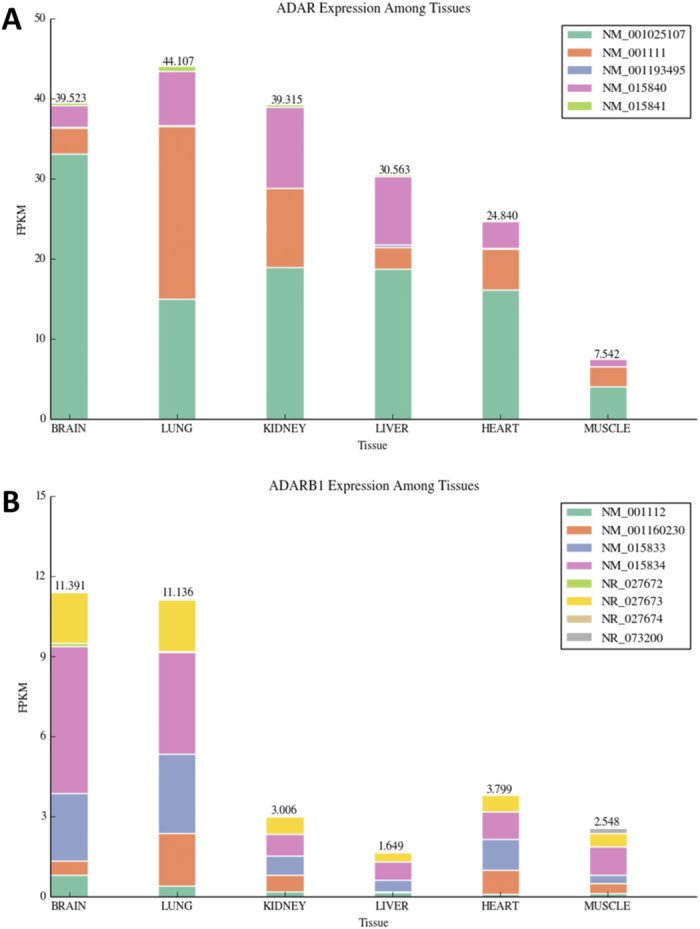
Adenine to Inosine RNA editing is a widespread co- and post-transcriptional mechanism mediated by ADAR enzymes acting on double stranded RNA. It has a plethora of biological effects, appears to be particularly pervasive in humans with respect to other mammals, and is implicated in a number of diverse human pathologies. Here we present the first human inosinome atlas comprising 3,041,422 A-to-I events identified in six tissues from three healthy individuals. Matched directional total-RNA-Seq and whole genome sequence datasets were generated and analysed within a dedicated computational framework, also capable of detecting hyper-edited reads. Inosinome profiles are tissue specific and edited gene sets consistently show enrichment of genes involved in neurological disorders and cancer. Overall frequency of editing also varies, but is strongly correlated with ADAR expression levels. The inosinome database is available at: http://srv00.ibbe.cnr.it/editing/.


Figures

Figure 1
Figure 1. Frequencies of observed nucleotide changes.
(A) Most of the detected RNA editing events were A-to-G. Potential non canonical events were rare and showed frequency values less than 0.05. (B) The fraction of A-to-G changes in non-synonymous sites across tissues.
Figure 2
Figure 2. Classification of RNA editing sites.
(A) Fraction of A-to-I sites discovered by our computational approach including events in hyper-edited reads that are currently disregarded by main RNA-Seq aligners. (B) Partitioning of detected RNA editing sites in Alu elements (ALU), other repetitive regions (REP-NON-ALU) and nonrepetitive regions (NON-REP). According to previous large-scale investigations, the vast majority of RNA editing sites resides in repetitive regions (97%). (C) Genomic localization of detected editing sites. (D) Fraction of synonymous and nonsynonymous A-to-I events occurring in ALU and nonrepetitive regions of open reading frames.
Figure 3
Figure 3. RNA editing in human transcriptomes.
Whole human genome is shown as a circle in which we report for each chromosome and tissue RNA editing levels in gray bars. Tissues are shown in concentric circles and ordered as follow from the outside: BRAIN, LUNG, KIDNEY, LIVER, HEART and MUSCLE. Red bars indicate tissue specific RNA editing levels. The image was generated by Circos tool.
Figure 4
Figure 4. Sequence context of RNA editing sites.
Sequence preferences for base positions flanking (−5, +5) detected A-to-I editing sites in (A) All genomic regions, (B) Hyper edited regions and (C) Non hyper edited regions. Sequence preferences were generated using the two-sample logo program.
Figure 5
Figure 5. RNA editing in human tissues.
Distribution of detected RNA editing events across human tissues. The absolute number of events is reported on the top of each bar. The fraction of hyper edited sites is indicated in red.
Figure 6
Figure 6. Distribution of RNA editing levels across human tissues.
Boxplots showing the distributions of RNA editing levels across human tissues. Median values per sample are indicated on the top. A star inside each boxplot shows the average RNA editing level. Overall, RNA editing levels are similar across tissues and within each tissue group.
Figure 7
Figure 7. Comparison of RNA inosinomes across human tissues.
The hierarchical clustering of Spearman correlation coefficients, calculated by pairwise comparisons of RNA editing levels, discriminates tissue groups and show inosinome differences across human tissues.
Figure 8
Figure 8. ADAR and ADARB1 expression across human tissues.
Using RNA-Seq data we calculated expression values of ADAR (A) and ADARB1 (B) genes across tissues. The relative expression of known isoforms per gene locus is also reported in color.
Figure 9
Figure 9
Distribution of correlation values between the expression of ADAR (in A) and ADARB1 (in B) and editing levels per positions covered by at least 10 RNA reads. K-S Pvalue is the Kolmogorov-Smirnov Pvalue.

References

    1. Djebali S. et al.. Landscape of transcription in human cells. Nature 489, 101–108 (2012). - PMC - PubMed
    1. Bazak L. et al.. A-to-I RNA editing occurs at over a hundred million genomic sites, located in a majority of human genes. Genome Res 24, 365–376 (2014). - PMC - PubMed
    1. Gott J. M. & Emeson R. B. Functions and mechanisms of RNA editing. Annu Rev Genet 34, 499–531 (2000). - PubMed
    1. Nishikura K. Functions and regulation of RNA editing by ADAR deaminases. Annu Rev Biochem 79, 321–349 (2010). - PMC - PubMed
    1. Gallo A. & Locatelli F. ADARs: allies or enemies? The importance of A-to-I RNA editing in human disease: from cancer to HIV-1. Biol Rev 87, 95–110 (2012). - PubMed

Publication types

MeSH terms