. 2015 Oct 8:13:259.
doi: 10.1186/s12916-015-0489-y.

RNY-derived small RNAs as a signature of coronary artery disease

Affiliations

RNY-derived small RNAs as a signature of coronary artery disease

Emanuela Repetto et al. BMC Med. .

Abstract

Background: Data from next generation sequencing technologies uncovered the existence of many classes of small RNAs. Recent studies reported that small RNAs are released by cells and can be detected in the blood. In this report, we aimed to discover the occurrence of novel circulating small RNAs in coronary artery disease (CAD).

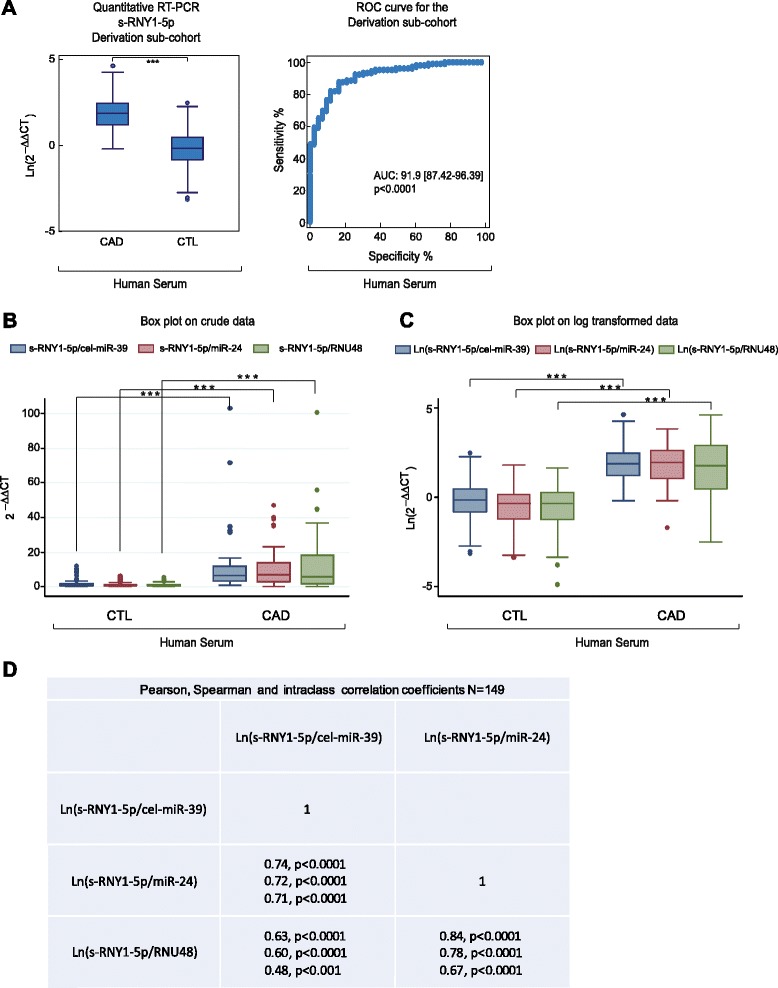
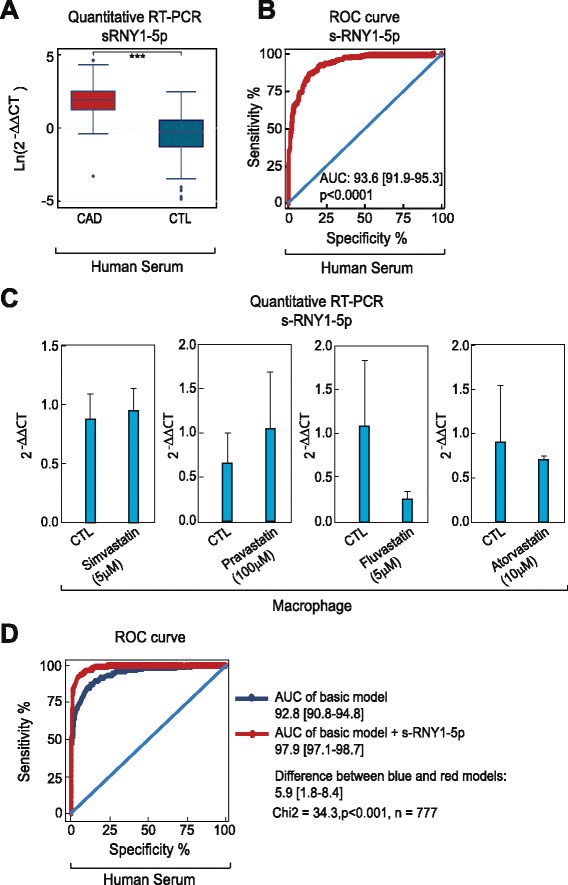
Methods: We used high-throughput sequencing of small RNAs from human and mouse apoptotic primary macrophages, and analyzed the data by empirical Bayes moderated t-statistics to assess differential expression and the Benjamini and Hochberg method to control the false discovery rate. Results were then confirmed by Northern blot and RT-qPCR in foam cells and in two animal models for atherosclerosis, namely ApoE(-/-) and Ldlr(-/-) mouse lines. Quantitative RT-PCR to detect identified small RNAs, the RNY-derived small RNAs, was performed using sera of 263 patients with CAD compared to 514 matched healthy controls; the Student t-test was applied to statistically assess differences. Associations of small RNAs with clinical characteristics and biological markers were tested using Spearman's rank correlations, while multivariate logistic regressions were performed to test the statistical association of small RNA levels with CAD.

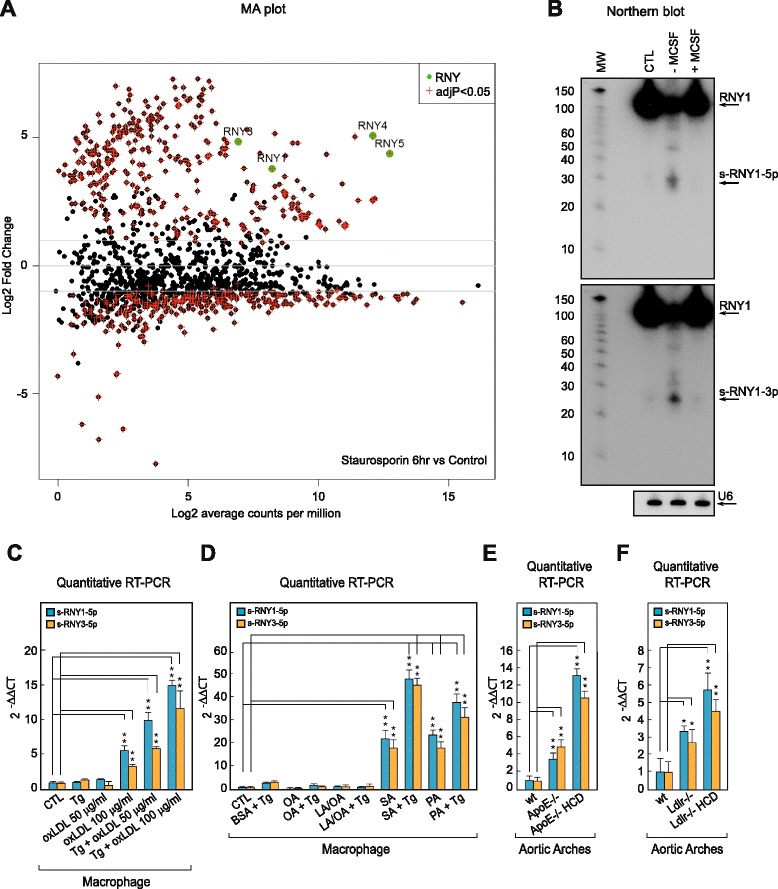
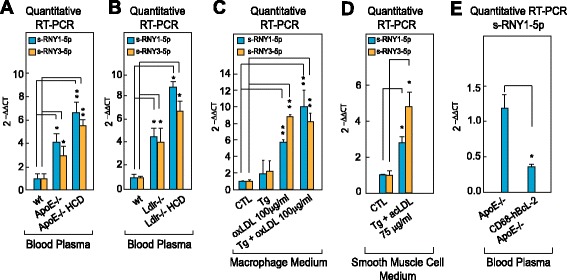
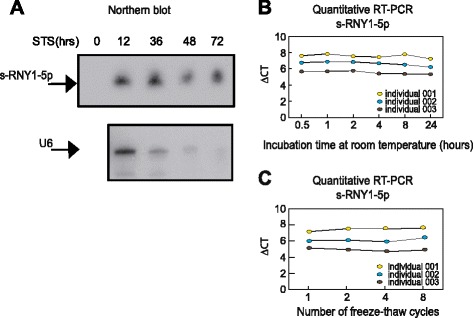
Results: Here, we report that, in macrophages stimulated with pro-apoptotic or pro-atherogenic stimuli, the Ro-associated non-coding RNAs, called RNYs or Y-RNAs, are processed into small RNAs (~24-34 nt) referred to as small-RNYs (s-RNYs), including s-RNY1-5p processed from RNY1. A significant upregulation of s-RNY expression was found in aortic arches and blood plasma from ApoE(-/-) and Ldlr(-/-) mice and in serum from CAD patients (P <0.001). Biostatistical analysis revealed a positive association of s-RNY1-5p with hs-CRP and ApoB levels; however, no statistical interaction was found between either of these two markers and s-RNY1-5p in relation to the CAD status. Levels of s-RNY1-5p were also independent from statin and fibrate therapies.

Conclusion: Our results position the s-RNY1-5p as a relevant novel independent diagnostic biomarker for atherosclerosis-related diseases. Measurement of circulating s-RNY expression would be a valuable companion diagnostic to monitor foam cell apoptosis during atherosclerosis pathogenesis and to evaluate patient's responsiveness to future therapeutic strategies aiming to attenuate apoptosis in foam cells in advanced atherosclerotic lesions.


Figures

Fig. 1
Fig. 1
Apoptotic and atherogenic stimuli induce s-RNY expression in macrophages. a MA plot distribution from the high throughput sequencing analysis of differentially expressed small RNAs in human primary macrophages stimulated with 1 μM of staurosporine (STS) for 6 hours compared to control. Green dots indicated RNYs. b Northern blot detecting the indicated s-RNYs in apoptotic mouse bone marrow-derived macrophages (BMDMs) upon 36 h of M-CSF withdrawal treatment or reconstitution after 12 h of starvation. U6 snRNA was used as loading control. CTL indicates control. c RT-qPCR analysis of the indicated s-RNYs in mouse BMDMs incubated for 28 h with 0.25 μM of thapsigargin (Tg) alone or in combination with the indicated concentrations of oxidized LDL. The data were normalized by U2 snRNA and presented as mean and standard deviation (n per group = 8). d RT-qPCR analysis of the indicated s-RNYs in mouse BMDMs incubated for 18 h with 0.25 μM of Tg with bovine serum albumin (BSA), 0.25 mM of the indicated fatty acids in complex with BSA, or Tg plus the fatty acids. The data were normalized by U2 snRNA and presented as mean and standard deviation (n per group = 8). The unsaturated fatty acids were linoleic acid (LA) and oleic acid (OA), and the saturated fatty acids were stearic acid (SA) and palmitic acid (PA). RT-qPCR analysis of the indicated s-RNYs in control and ApoE −/− (e) or Ldlr −/− (f) aortic arches. The mice were fed with either chow diet or high cholesterol diet. The data were normalized by U2 snRNA and presented as mean and standard deviation (n per group = 8 for (e) and n per group = 5 for (f)). Student’s t-test: *P <0.05; **P <0.01
Fig. 2
Fig. 2
s-RNY expression is induced in atherosclerotic areas and in smooth muscle foam cells. a RT-qPCR analysis of s-RNY1-5p in ApoE −/− aortic arches and femoral arteries. The data were normalized by U2 snRNA and are presented as mean and standard deviation (n per group = 5). b RT-qPCR analysis of the indicated s-RNYs in CRL 2797 cells (smooth muscle cells; left panel, n per group = 6), CRL 2181 cells (endothelial cells; central panel, n per group = 7), primary myocardial cells (right panel, n per group = 3) incubated for 28 h with 0.25 μM thapsigargin in combination with the indicated concentration of acetylated LDL and control. The data were normalized by U2 snRNA and are presented as mean and standard deviation. Student’s t-test: *P <0.05, **P <0.01
Fig. 3
Fig. 3
s-RNYs are released in the extracellular milieu by foam cells and in the peripheral blood of two mouse models for atherosclerosis. RT-qPCR of the indicated s-RNYs in the blood plasma of ApoE −/− (a) or Ldlr −/− (b) mice or control (wt). Mice were fed with either chow diet or high cholesterol diet. Data were normalized by using cel-miR-39 and are presented as mean and standard deviation (n per group = 8 for (a) and n per group = 5 for (b)). c RT-qPCR analysis of the indicated s-RNYs from the medium of bone marrow-derived macrophages (n per group = 4). d RT-qPCR analysis of the indicated s-RNYs from the medium of CRL 2797 cells (smooth muscle cells) incubated for 28 h with 0.25 μM thapsigargin in combination with the indicated concentration of acetylated LDL and control. The data were normalized by cel-miR-39 and are presented as mean and standard deviation (n per group = 4). e RT-qPCR of s-RNY1-5p in the blood plasma of CD68-hBcl-2 ApoE −/− or control (ApoE −/−). Data were normalized by cel-miR-39 and are presented as mean and standard deviation (n per group = 4). Student’s t-test: *P <0.05, **P <0.01
Fig. 4
Fig. 4
Circulating s-RNY1-5p expression is induced in patients with CAD. a Box plot showing the expression in natural logarithmic scale of circulating s-RNY1-5p in the derivation cohort composed by the serum of 43 coronary artery disease (CAD) patients versus 106 control individuals (left panel). Data derived from RT-qPCR, normalized using cel-miR-39, and presented as mean and standard deviation. Receiver operating characteristic (ROC) curve for predicting CAD with s-RNY1-5p was based on the RT-qPCR data of n = 149 (right panel). The area under the ROC curve is indicated. b, c Box plots showing, in the derivation cohort (43 CAD patients and 106 control individuals), the expression of circulating s-RNY1-5p normalized with the indicated reference genes, in linear scale (b) and natural logarithmic scale (c). d Pearson, Spearman, and interclass correlation coefficients among the circulating s-RNY1-5p values normalized with the indicated reference genes. Student’s t-test: ***P <0.001
Fig. 5
Fig. 5
s-RNY1-5p is stable in extracellular environment. a Northern blot analysis showing the stability of s-RNY1-5p and U6 snRNA in the medium of bone marrow-derived macrophages stimulated with 1 μM of staurosporine at the indicated time points. Total RNA was isolated from the medium. b, c RT-qPCR analysis from three coronary artery disease patients showing the stability of s-RNY1-5p in the serum in either prolonged room temperature incubation (b) or different cycles of freeze-thaw as indicated (c). Data were normalized by using the synthetic non-mammalian cel-miR-39, which was added to the samples before the RNA extraction. Each ΔCt (corresponding to Cts-RNY1-5p-Ctcel-miR-39) is the average of three technical replicates
Fig. 6
Fig. 6
Circulating s-RNY4-5p expression is induced in patients with coronary artery disease (CAD). a Box plot showing the expression in natural logarithmic scale of circulating s-RNY4-5p in the serum of CAD patients (n = 45) versus control individuals (CTL, n = 45). Data derived from RT-qPCR were normalized using cel-miR-39, and presented as mean and standard deviation. b Receiver operating characteristic (ROC) curve for predicting CAD with s-RNY4-5p. The ROC curve was constructed using s-RNY4-5p based on the RT-qPCR data (n = 90). The area under the ROC curve is given and 95 % confidence interval was indicated in square brackets. Student’s t-test: ***P <0.001
Fig. 7
Fig. 7
s-RNY1-5p is an independent diagnostic biomarker for coronary artery disease (CAD). a Box plots showing the expression in natural logarithmic scale of circulating s-RNY1-5p in the serum of CAD patients (n = 263) versus control individuals (CTL, n = 514). Data derived from RT-qPCR were normalized using cel-miR-39, and presented as mean and standard deviation. b Receiver Operating Characteristic (ROC) curve for predicting CAD with s-RNY1-5p. The ROC curve was constructed using s-RNY1-5p based on the RT-qPCR data (n = 777). The area under the ROC curve is given and 95 % confidence interval was indicated in square brackets. The diagonal line indicates a test with an area under the ROC curve of 50 %; P <0.0001. c RT-qPCR analysis of the indicated s-RNYs in bone marrow-derived macrophages incubated for 24 h with the indicated concentrations of different statins. The data were normalized by U2 snRNA and presented as mean and standard deviation (n per group = 3). d ROC, in blue the curve for classical risk factors and markers (hypertension, dyslipidemia, diabetes, smoking, waist circumference, ankle-arm index, ApoA-I, and hs-CRP), in red the same classical risk factors and markers with s-RNY1-5p. The ROC curve was constructed using s-RNY1-5p expression based on the RT-qPCR data (n = 777). The area under the ROC curve is given and 95 % confidence interval was indicated in square brackets. Student’s t-test: ***P <0.001

References

    1. Turchinovich A, Weiz L, Langheinz A, Burwinkel B. Characterization of extracellular circulating microRNA. Nucleic Acids Res. 2011;39:7223–7233. doi: 10.1093/nar/gkr254. - DOI - PMC - PubMed
    1. Mayr M, Zampetaki A, Willeit P, Willeit J, Kiechl S. MicroRNAs within the continuum of postgenomics biomarker discovery. Arterioscler Thromb Vasc Biol. 2013;33:206–214. doi: 10.1161/ATVBAHA.112.300141. - DOI - PubMed
    1. Lawrence T, Gilroy DW. Chronic inflammation: a failure of resolution? Int J Exp Pathol. 2007;88:85–94. doi: 10.1111/j.1365-2613.2006.00507.x. - DOI - PMC - PubMed
    1. Moore KJ, Sheedy FJ, Fisher EA. Macrophages in atherosclerosis: a dynamic balance. Nat Rev Immunol. 2013;13:709–721. doi: 10.1038/nri3520. - DOI - PMC - PubMed
    1. Gautier EL, Huby T, Witztum JL, Ouzilleau B, Miller ER, Saint-Charles F, et al. Macrophage apoptosis exerts divergent effects on atherogenesis as a function of lesion stage. Circulation. 2009;119:1795–1804. doi: 10.1161/CIRCULATIONAHA.108.806158. - DOI - PubMed

Publication types

Associated data