. 2015 Nov;26(11):258.
doi: 10.1007/s10856-015-5587-z. Epub 2015 Oct 8.

The role of clinically-relevant parameters on the cohesiveness of sclerosing foams in a biomimetic vein model

Affiliations

The role of clinically-relevant parameters on the cohesiveness of sclerosing foams in a biomimetic vein model

Dario Carugo et al. J Mater Sci Mater Med. 2015 Nov.

Abstract

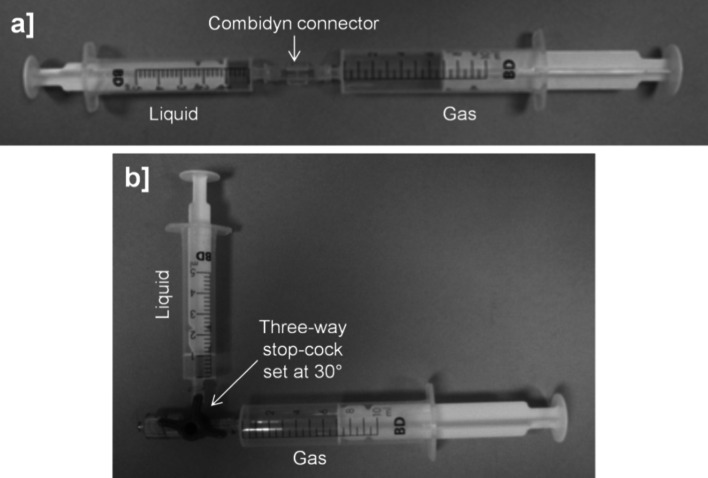
We have recently reported on the development of a biomimetic vein model to measure the performance of sclerosing foams. In this study we employed the model to compare the commercially-available Varithena(®) (polidocanol injectable foam) 1% varicose vein treatment (referred to as polidocanol endovenous microfoam, or PEM) with physician compounded foams (PCFs) made using different foam generation methods (Double Syringe System and Tessari methods) and different foam formulations [liquid to gas ratios of 1:3 or 1:7; gas mixtures composed of 100% CO2, various CO2:O2 mixtures and room air (RA)]. PCFs produced using the DSS method had longer dwell times (DTs) (range 0.54-2.21 s/cm in the 4 mm diameter vein model) than those of the corresponding PCFs produced by the Tessari technique (range 0.29-0.94 s/cm). PEM had the longest DT indicating the best cohesive stability of any of the foams produced (2.92 s/cm). Other biomimetic model variables investigated included effect of vessel size, delayed injection and rate of plug formation (injection speed). When comparing the 4 and 10 mm vessel diameters, the DTs seen in the 10 mm vessel were higher than those observed for the 4 mm vessel, as the vein angle had been reduced to 5° to allow for foam plug formation. PCF foam performance was in the order RA > CO2:O2 (35:65) ≅ CO2:O2 (65:35) > CO2; PEM had a longer DT than all PCFs (22.10 s/cm) except that for RA made by DSS which was similar but more variable. The effect of delayed injection was also investigated and the DT for PEM remained the longest of all foams with the lowest percentage deviation with respect to the mean values, indicating a consistent foam performance. When considering rate of plug formation, PEM consistently produced the longest DTs and this was possible even at low plug expansion rates (mean 29.5 mm/s, minimum 20.9 mm/s). The developed vein model has therefore demonstrated that PEM consistently displays higher foam stability and cohesiveness when compared to PCFs, over a range of clinically-relevant operational variables.


Figures

Fig. 1
Fig. 1
Schematic depiction of the experimental set-up (readapted from Ref. [32]). The biomimetic vein model was initially primed with a blood substitute. Subsequently, sclerosing foam was injected into the model and videos of foam plug expansion and degradation were recorded by a CCD camera. Videos were transferred to the computational foam analysis system (CFAS) for determination of foam plug degradation rate (DR) and dwell time (DT). A three-way valve was used to manually switch between blood substitute and foam. Fluids were discharged in a reservoir
Fig. 2
Fig. 2
Generic chemical structure of polidocanol. It comprises a mixture of polyethylene glycol monododecyl ethers, averaging nine ethylene oxide groups per molecule
Fig. 3
Fig. 3
Manual techniques for producing sclerosing foams. In the double syringe system (DSS) method syringes (BD Discardit™ II) were connected by a Combidyn® adapter (a), while in the Tessari method they were connected by a three-way valve set at a 30° off-set (b). In both production methods, the foam was generated by passing the polidocanol solution (liquid phase) from one syringe, ten times into and out of the other syringe initially containing a gas or gas mixture (gaseous phase). Throughout these studies, foam was produced at room temperature by a single operator
Fig. 4
Fig. 4
Dwell Times (in s/cm) for DSS PCFs (a) or Tessari PCFs (b) of different gas formulations and LGRs compared to PEM, in the 4 mm diameter vein model. DSS Double syringe system, PCF physician compounded foam, PEM polidocanol endovenous microfoam, LGR liquid to gas ratio
Fig. 5
Fig. 5
Dwell Times (DT, in s/cm) generated using the 10 mm vein model at 5° inclination angle for DSS PCFs or Tessari PCFs of different gas formulations, compared to PEM. Foams were produced at a fixed LGR = 1:7. DSS Double syringe system, PCF physician compounded foam, PEM polidocanol endovenous microfoam, LGR liquid to gas ratio
Fig. 6
Fig. 6
Effect of immediate (3–5 s) versus delayed (75 s) injection on the Dwell Time (DT, in s/cm) for DSS PCFs of different gas formulations made at 1:3 (a) or 1:7 (b) LGRs compared to PEM. DSS Double syringe system, PCF physician compounded foam, PEM polidocanol endovenous microfoam, LGR liquid to gas ratio
Fig. 7
Fig. 7
Plot of normalised dwell time (DT) versus Plug Formation Rate (in mm/s) for various PCF formulations (DSS) compared to PEM (foams were injected immediately after production). DSS Double syringe system, PCF physician compounded foam, PEM polidocanol endovenous microfoam, LGR liquid to gas ratio
Fig. 8
Fig. 8
a Bubble size distributions (expressed in terms of volume fraction) of DSS PCFs and PEM, obtained using the Sympatec particle size analyser, at a fixed LGR = 1:7 (n = 5). The inset shows an expanded view of bubble size distribution for bubble diameters ranging from 550 to 1550 µm. b Bubble size distributions of RA DSS versus RA Tessari, at a fixed LGR = 1:7 (n = 5). All measurements in (a) and (b) were performed 35–40 s after foam production. DSS Double syringe system, PCF physician compounded foam, PEM polidocanol endovenous microfoam, LGR liquid to gas ratio

References

    1. Bradbury A, Evans C, Allan P, Lee A, Vaughan Ruckley C, Fowkes F. What are the symptoms of varicose veins? Edinburgh vein study cross sectional population survey. BMJ. 1999;318(7180):353–356. doi: 10.1136/bmj.318.7180.353. - DOI - PMC - PubMed
    1. Goldman MP, Fronek A. Anatomy and pathophysiology of varicose veins. J Dermatol Surg Oncol. 1989;15(2):138–146. doi: 10.1111/j.1524-4725.1989.tb03020.x. - DOI - PubMed
    1. Van den Oever R, Hepp B, Debbaut B, Simon I. Socio-economic impact of chronic venous insufficiency: an underestimated public health problem. Int Angiol. 1998;17(3):161–167. - PubMed
    1. Murad MH, Coto-Yglesias F, Zumaeta-Garcia M, Elamin MB, Duggirala MK, Erwin PJ, et al. A systematic review and meta-analysis of the treatments of varicose veins. J Vasc Surg. 2011;53(5):49S–65S. doi: 10.1016/j.jvs.2011.02.031. - DOI - PubMed
    1. Smith PC. Foam and liquid sclerotherapy for varicose veins. Phlebology. 2009;24(suppl 1):62–72. doi: 10.1258/phleb.2009.09s007. - DOI - PubMed

LinkOut - more resources