. 2015;16 Suppl 10(Suppl 10):S5.
doi: 10.1186/1471-2164-16-S10-S5. Epub 2015 Oct 2.

A comparative genomics study on the effect of individual amino acids on ribosome stalling

A comparative genomics study on the effect of individual amino acids on ribosome stalling

Renana Sabi et al. BMC Genomics. 2015.

Abstract

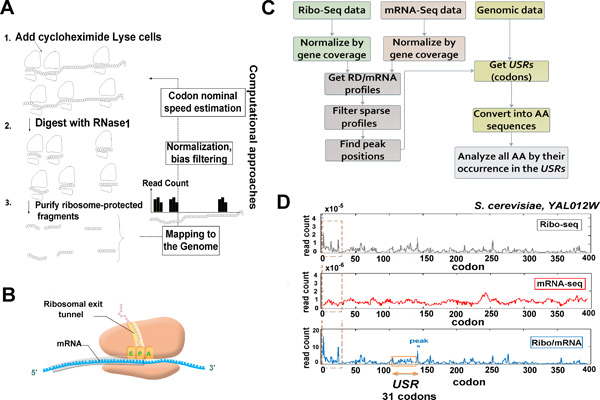
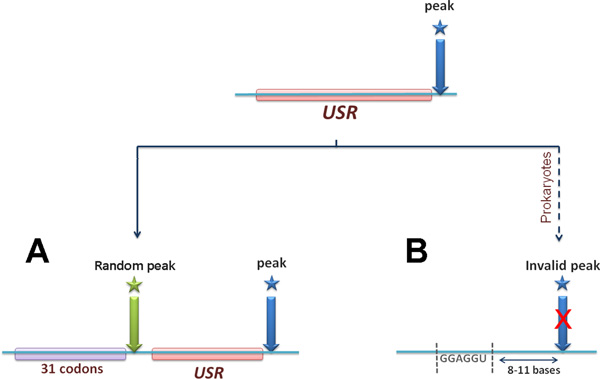
Background: During protein synthesis, the nascent peptide chain emerges from the ribosome through the ribosomal exit tunnel. Biochemical interactions between the nascent peptide and the tunnel may stall the ribosome movement and thus affect the expression level of the protein being synthesized. Earlier studies focused on one model organism (S. cerevisiae), have suggested that certain amino acid sequences may be responsible for ribosome stalling; however, the stalling effect at the individual amino acid level across many organisms has not yet been quantified.

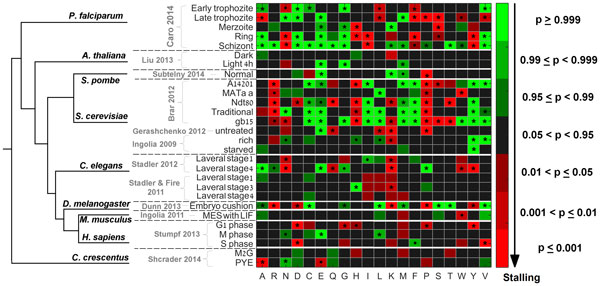
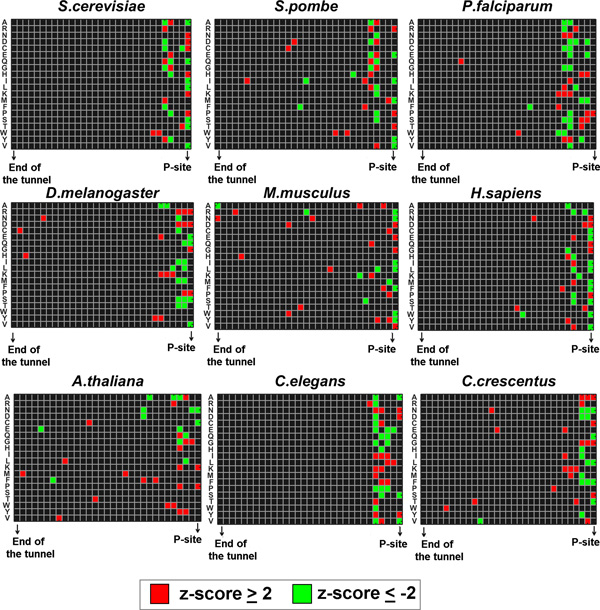
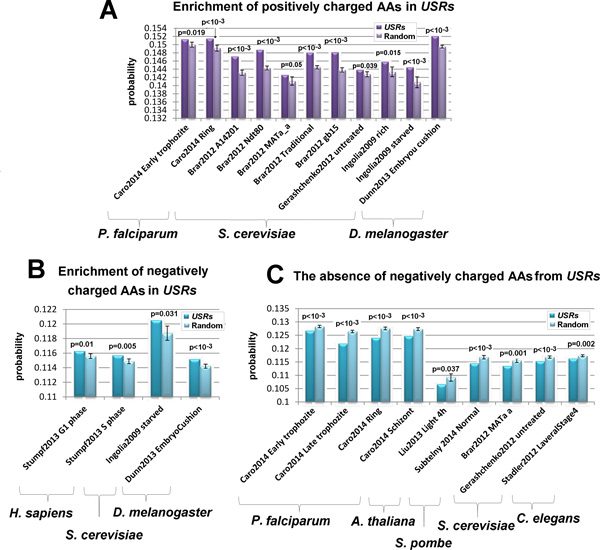
Results: By analyzing multiple ribosome profiling datasets from different organisms (including prokaryotes and eukaryotes), we report for the first time the organism-specific amino acids that significantly lead to ribosome stalling. We show that the identity of the stalling amino acids vary across the tree of life. In agreement with previous studies, we observed a remarkable stalling signal of proline and arginine in S. cerevisiae. In addition, our analysis supports the conjecture that the stalling effect of positively charged amino acids is not universal and that in certain conditions, negative charge may also induce ribosome stalling. Finally, we show that the beginning part of the tunnel tends to undergo more interactions with the translated amino acids than other positions along the tunnel.

Conclusions: The reported results support the conjecture that the ribosomal exit tunnel interacts with various amino acids and that the nature of these interactions varies among different organisms. Our findings should contribute towards better understanding of transcript and proteomic evolution and translation elongation regulation.


Figures

Figure 1
Figure 1
General description of the approach described in the study. (A) The major steps of the ribosomal profiling approach: 1) Cells are treated with cycloheximide, for example, to arrest translation; 2) Ribosomes are fixed and ribosome-protected RNA fragments are recovered; 3) After processing and reverse-transcription, these are sequenced, mapped and used to derive a ribosomal density profile. (B) An illustration of the ribosome and the exit tunnel during translation elongation. The sequence of codons upstream from the ribosomal A-site (shaded in gray) represents the amino acid sequence that occupies the exit tunnel while the codon at the P-site is being translated (depicted by pink circles). (C) The general steps of the approach described in this study: Ribo-seq and mRNA-seq profiles are normalized by the average gene coverage; new profiles are generated based on the ratio between ribo-seq reads and mRNA reads; normalized profiles with sparse coverage are filtered; peak positions in RD/mRNA are extracted; the codons USR of each peak is converted into amino acid sequence (denoted as AA) and each amino acid is analyzed based on its frequency in all USRs (see specific details in the Methods). (D) An example of ribo-seq, mRNA-seq and RD/mRNA profiles obtained from gene YAL012W in S. cerevisiae. The profiles were generated based on all S. cerevisiae datasets (see the Methods section: Merging all datasets of the organism into one aggregate). Positions along each profile represent the location of the ribosomal A-site. The first 20 codons (marked by a dashed brown frame) are excluded from the analysis (details in the Methods section: Data filtering). The 31 codons upstream from the peak are the Upstream Stalling Region of codons corresponding to the amino acid sequence in the exit tunnel.
Figure 2
Figure 2
Tests for identifying stalling amino acids. The position of peak in the RD/mRNA profile is marked by a blue arrow. The USR corresponding to the peak is the upstream sequence of 31 codons which codes for the 31 amino acid that occupy the tunnel when ribosomes stall at the peak position. (A) In the first test, the frequency of each amino acid upstream of real peak positions is compared with its frequency in the 31 codons upstream of random positions. The number of randomly drawn positions per profile is equal to the number of real peaks in the original profile (see details in the Methods). (B) The additional test is performed for bacteria. In case a sequence that resembles the SD sequence was observed 8-11 bases upstream from the peak position, the peak was excluded from the analysis.
Figure 3
Figure 3
Dataset-specific classification of the 20 amino acids. Each amino acid was classified as significantly stalling (red), significantly non-stalling (green) or insignificant (black) according to the frequency of its codons in the USRs. All analyzed datasets are listed to the left. A color bar with the different significance levels is provided to the right. Stalling amino acids that passed FDR at the 0.05 level are marked with asterisk and those that passed FDR at the 0.1 level are marked by black dots. Thick horizontal white lines are plotted to separate the different organisms which are ordered in accordance with their evolutionary tree based on iTOL [76,77].
Figure 4
Figure 4
The distribution of amino acids along the tunnel when ribosomes stall. The position-specific probabilities were calculated for the 31 positions in the tunnel (based on the USRs). Results are presented per organism based on an aggregate that merges all analyzed datasets of the organism (see details in the Methods section: Merging all datasets of the organism into one aggregate). The probabilities were standardized to have a mean of zero per amino acid. We defined a square to be red/green if the probability to observe the amino acid in the corresponding position is significantly higher/lower than other positions in the tunnel.
Figure 5
Figure 5
Enrichment of charged amino acids in USRs. The probability to observe a charged amino acid in the real USRs is compared to the probability to observe it before random peak positions (details in the Methods section: Quantifying the enrichment of charged amino acids in USRs). The probabilities in random are average values over all randomizations. Standard deviations and p-values are also presented. (A) The probability to observe a positively charged amino acid in real and random USRs for the 11 cases that exhibited a significant p-value (2 datasets of P. falciparum; 8 datasets of S. cerevisiae; and one of D. melanogaster). (B) The probability to observe a negatively charged amino acid in real and random USRs for the 4 cases that exhibited a significant p-value (2 datasets of H. sapiens, one datasets of S. cerevisiae and one datasets of D. melanogaster) (C) The probability to observe a negatively charged amino acid in real and random USRs for the 9 cases where the probability was significantly higher in random than in the real USRs (4 datasets of P. falciparum; one dataset of A. thaliana, one dataset of S. pombe; 2 datasets of S. cerevisiae and one of C. elegans).

Similar articles

Cited by

References

    1. Kanaya S, Yamada Y, Kinouchi M, Kudo Y, Ikemura T. Codon usage and tRNA genes in eukaryotes: correlation of codon usage diversity with translation efficiency and with CG-dinucleotide usage as assessed by multivariate analysis. Journal of molecular evolution. 2001;53(4-5):290–298. - PubMed
    1. dos Reis M, Savva R, Wernisch L. Solving the riddle of codon usage preferences: a test for translational selection. Nucleic acids research. 2004;32(17):5036–5044. - PMC - PubMed
    1. Gustafsson C, Govindarajan S, Minshull J. Codon bias and heterologous protein expression. Trends in biotechnology. 2004;22(7):346–353. - PubMed
    1. Sørensen MA, Kurland C, Pedersen S. Codon usage determines translation rate in Escherichia coli. Journal of molecular biology. 1989;207(2):365–377. - PubMed
    1. Varenne S, Buc J, Lloubes R, Lazdunski C. Translation is a non-uniform process: effect of tRNA availability on the rate of elongation of nascent polypeptide chains. Journal of molecular biology. 1984;180(3):549–576. - PubMed

Publication types

LinkOut - more resources