

Rumen microbial community composition varies with diet and host, but a core microbiome is found across a wide geographical range
- PMID: 26449758
- PMCID: PMC4598811
- DOI: 10.1038/srep14567
Rumen microbial community composition varies with diet and host, but a core microbiome is found across a wide geographical range
Erratum in
-
Erratum: Rumen microbial community composition varies with diet and host, but a core microbiome is found across a wide geographical range.Sci Rep. 2016 Jan 20;6:19175. doi: 10.1038/srep19175. Sci Rep. 2016. PMID: 26789699 Free PMC article. No abstract available.
Abstract
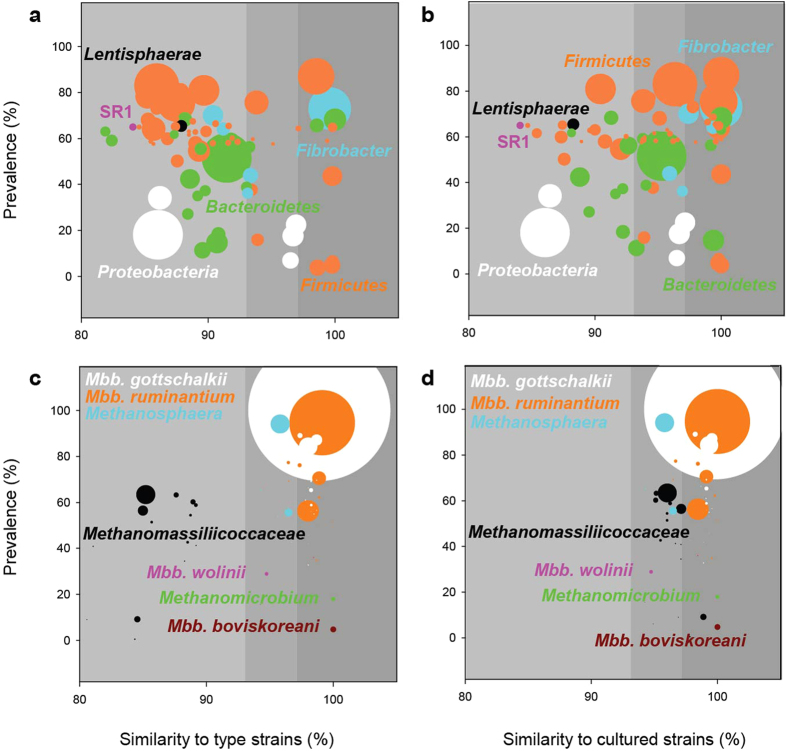
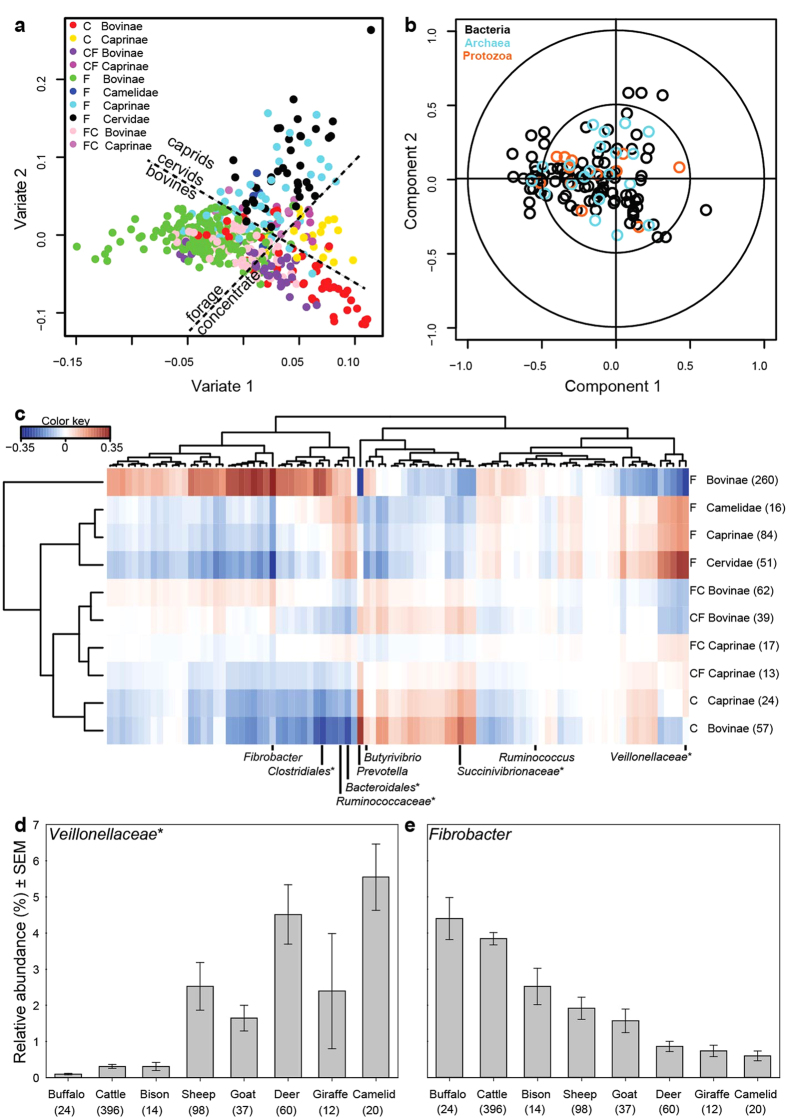
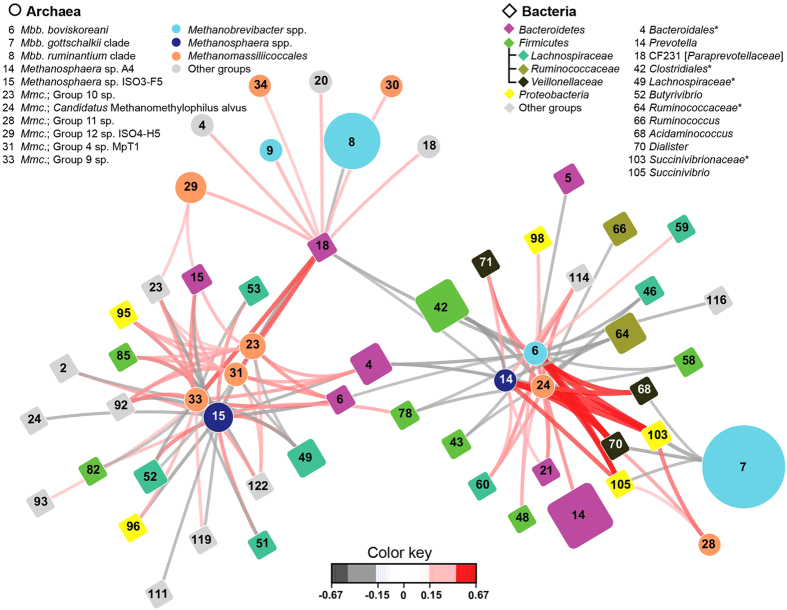
Ruminant livestock are important sources of human food and global greenhouse gas emissions. Feed degradation and methane formation by ruminants rely on metabolic interactions between rumen microbes and affect ruminant productivity. Rumen and camelid foregut microbial community composition was determined in 742 samples from 32 animal species and 35 countries, to estimate if this was influenced by diet, host species, or geography. Similar bacteria and archaea dominated in nearly all samples, while protozoal communities were more variable. The dominant bacteria are poorly characterised, but the methanogenic archaea are better known and highly conserved across the world. This universality and limited diversity could make it possible to mitigate methane emissions by developing strategies that target the few dominant methanogens. Differences in microbial community compositions were predominantly attributable to diet, with the host being less influential. There were few strong co-occurrence patterns between microbes, suggesting that major metabolic interactions are non-selective rather than specific.
Conflict of interest statement
The AgResearch component of this study was funded by the New Zealand Government via the Ministry for Primary Industries (MPI) as part of MPI’s support for the Global Research Alliance on Agricultural Greenhouse Gases. The publication of the data reported here is at the discretion of MPI. MPI did not control which data were presented or how these data were interpreted within this paper. This does not alter the authors’ adherence to all the Scientific Reports policies on sharing data and materials. Material transfer agreements, limiting the use of samples to this study, are in place between AgResearch and Global Rumen Census Collaborators from The University of Alberta (Canada), The Department of Agriculture, Fisheries and Forestry (Queensland, Australia), The University of Aberdeen (Scotland), and The National Institute of Livestock and Grassland Science (Japan). There are no patents, products in development or marketed products to declare. No competing interests were declared by Global Rumen Census Collaborators.
Figures

References
-
- Hackmann T. J. & Spain J. N. Invited review: ruminant ecology and evolution: perspectives useful to ruminant livestock research and production. J. Dairy Sci. 93, 1320–1334 (2010). - PubMed
-
- Hofmann R. R. Evolutionary steps of ecophysiological adaptation and diversification of ruminants: a comparative view of their digestive system. Oecologia 78, 443–457 (1989). - PubMed
-
- Hungate R. E. The Rumen and its Microbes. (Academic Press, 1966).
-
- Ripple W. J. et al. Ruminants, climate change and climate policy. Nat. Clim. Change 4, 2–5 (2014).
-
- Johnson D. E. & Ward G. M. Estimates of animal methane emissions. Environ. Monit. Assess. 42, 113–141 (1996). - PubMed
Publication types
MeSH terms
Substances
LinkOut - more resources
Full Text Sources
Other Literature Sources
