. 2015;16 Suppl 10(Suppl 10):S10.
doi: 10.1186/1471-2164-16-S10-S10. Epub 2015 Oct 2.

A maximum pseudo-likelihood approach for phylogenetic networks

A maximum pseudo-likelihood approach for phylogenetic networks

Yun Yu et al. BMC Genomics. 2015.

Abstract

Background: Several phylogenomic analyses have recently demonstrated the need to account simultaneously for incomplete lineage sorting (ILS) and hybridization when inferring a species phylogeny. A maximum likelihood approach was introduced recently for inferring species phylogenies in the presence of both processes, and showed very good results. However, computing the likelihood of a model in this case is computationally infeasible except for very small data sets.

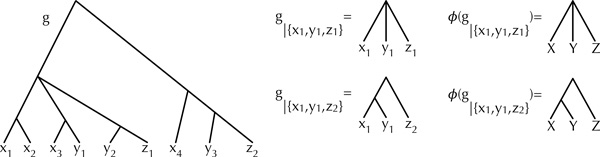
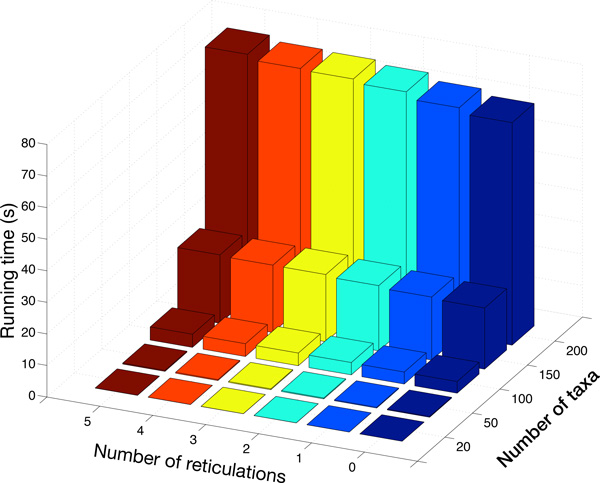
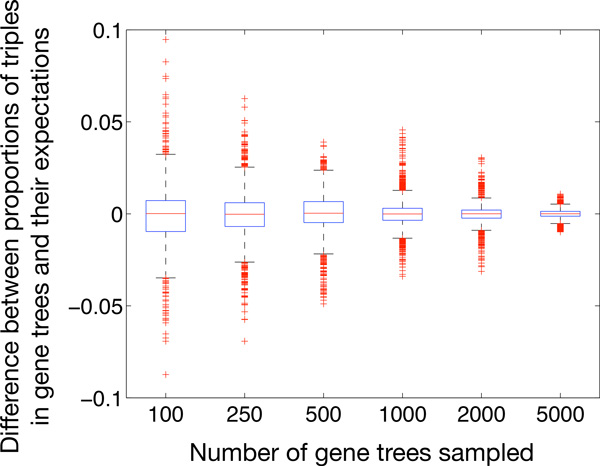
Results: Inspired by recent work on the pseudo-likelihood of species trees based on rooted triples, we introduce the pseudo-likelihood of a phylogenetic network, which, when combined with a search heuristic, provides a statistical method for phylogenetic network inference in the presence of ILS. Unlike trees, networks are not always uniquely encoded by a set of rooted triples. Therefore, even when given sufficient data, the method might converge to a network that is equivalent under rooted triples to the true one, but not the true one itself. The method is computationally efficient and has produced very good results on the data sets we analyzed. The method is implemented in PhyloNet, which is publicly available in open source.

Conclusions: Maximum pseudo-likelihood allows for inferring species phylogenies in the presence of hybridization and ILS, while scaling to much larger data sets than is currently feasible under full maximum likelihood. The nonuniqueness of phylogenetic networks encoded by a system of rooted triples notwithstanding, the proposed method infers the correct network under certain scenarios, and provides candidates for further exploration under other criteria and/or data in other scenarios.


Figures

Figure 1
Figure 1
Gene trees and rooted triples. A gene tree g on three species X, Y , and Z, where multiple alleles are sampled per species. Two induced triples by the gene tree and their mapping to the species names are shown.
Figure 2
Figure 2
Illustration of the lack of network identifiability under the proposed pseudo-likelihood framework. Three phylogenetic networks with the same set of triples: A|BC, AB|C, A|BD, AB|D, A|CD, and B|CD. Branch lengths and inheritance probabilities are shown in blue and red, respectively, for Ψ1 and Ψ2.
Figure 3
Figure 3
Reanalysis of the 1070-gene yeast data set of [35]. Top: the species tree inferred by maximum pseudo-likelihood when no reticulations are allowed during the search. It is identical to the tree reported in [35]. The two black numbers for every internal node are gene-support frequency (left) and internode certainty (right) reported in [35]. Bottom: the species network inferred by maximum pseudo-likelihood with 2 reticulations. The red solid edge is the reticulation edge in the optimal species network with 1 reticulation. Blue and red numbers are branch lengths and inheritance probabilities, respectively, inferred by the method.
Figure 4
Figure 4
Accuracy of the method on simulated data. For every number of loci, the rightmost bar corresponds to inference from true gene trees and the other three bars, from left to right, correspond to inference from estimated gene trees from sequences of lengths 250, 500 and 1000, respectively. The dark blue region corresponds to the number of times the true network was returned as the optimal network after the search. The green region corresponds to the number of times the true network is not the optimal network found by the search, but is the optimal one among the top 5 species networks after optimizing their branch lengths and inheritance probabilities under maximum pseudo-likelihood. All other scenarios are represented by the maroon region.
Figure 5
Figure 5
Running time of computing pseudo-likelihood of a species network. We varied the species networks by the number of taxa and the number of reticulations. The running times are reported in seconds.
Figure 6
Figure 6
Convergence of the proportions of rooted triples in gene trees to their expectations. Every point is the empirical frequency of a triple minus the (theoretical) expectation of that frequency.

References

    1. Nakhleh L. Computational approaches to species phylogeny inference and gene tree reconciliation. Trends in Ecology & Evolution. 2013;28(12):719–728. - PMC - PubMed
    1. Pollard DA, Iyer VN, Moses AM, Eisen MB. Widespread discordance of gene trees with species tree in Drosophila: evidence for incomplete lineage sorting. PLoS Genet. 2006;2:1634–1647. - PMC - PubMed
    1. Kuo CH, Wares JP, Kissinger JC. The Apicomplexan whole-genome phylogeny: An analysis of incongruence among gene trees. Mol Biol Evol. 2008;25(12):2689–2698. - PMC - PubMed
    1. White MA, Ane C, Dewey CN, Larget BR, Payseur BA. Fine-scale phylogenetic discordance across the house mouse genome. PLoS Genetics. 2009;5:1000729. - PMC - PubMed
    1. Arnold ML. Natural Hybridization and Evolution. Oxford University Press, Oxford; 1997.

Publication types

LinkOut - more resources