. 2015;16 Suppl 10(Suppl 10):S11.
doi: 10.1186/1471-2164-16-S10-S11. Epub 2015 Oct 2.

Ancestral gene synteny reconstruction improves extant species scaffolding

Ancestral gene synteny reconstruction improves extant species scaffolding

Yoann Anselmetti et al. BMC Genomics. 2015.

Abstract

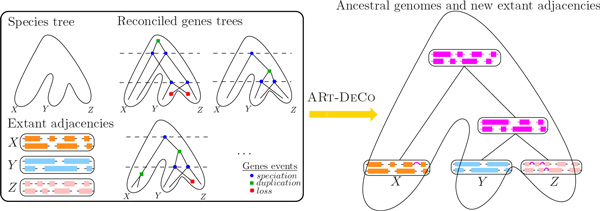
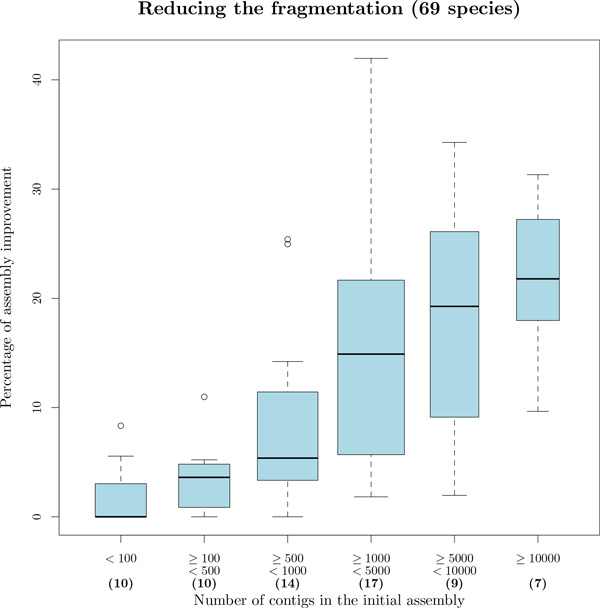
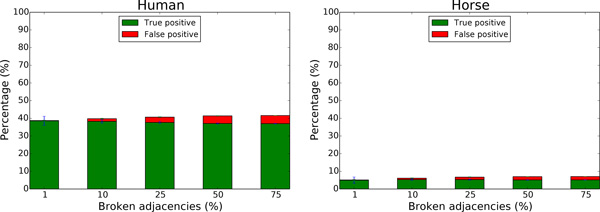
We exploit the methodological similarity between ancestral genome reconstruction and extant genome scaffolding. We present a method, called ARt-DeCo that constructs neighborhood relationships between genes or contigs, in both ancestral and extant genomes, in a phylogenetic context. It is able to handle dozens of complete genomes, including genes with complex histories, by using gene phylogenies reconciled with a species tree, that is, annotated with speciation, duplication and loss events. Reconstructed ancestral or extant synteny comes with a support computed from an exhaustive exploration of the solution space. We compare our method with a previously published one that follows the same goal on a small number of genomes with universal unicopy genes. Then we test it on the whole Ensembl database, by proposing partial ancestral genome structures, as well as a more complete scaffolding for many partially assembled genomes on 69 eukaryote species. We carefully analyze a couple of extant adjacencies proposed by our method, and show that they are indeed real links in the extant genomes, that were missing in the current assembly. On a reduced data set of 39 eutherian mammals, we estimate the precision and sensitivity of ARt-DeCo by simulating a fragmentation in some well assembled genomes, and measure how many adjacencies are recovered. We find a very high precision, while the sensitivity depends on the quality of the data and on the proximity of closely related genomes.


Figures

Figure 1
Figure 1
Input and output of the ARt-DeCo method. The left box shows the input of ARt-DeCo: a species tree (here on extant species X, Y and Z), the adjacencies in the genome of extant species (each colored block represents a contig, that is, a linear arrangement of genes, linked by adjacencies) and the reconciled genes trees for their genes. The output of ARt-DeCo is shown on the right-hand side in magenta color: the method computes both new adjacencies for extant species and contigs for the ancestral species.
Figure 2
Figure 2
Determination of a good value for base log b. We simulated 550 fissions on a data set of 7 tetrapod species (see Section Results) and evaluate the ability of ARt-DeCo to recover broken adjacencies by the simulated fissions for different values for the base log b. On the x axis is the multiplicative factor of 1-p(S)p(S)1Br, where Br = 1. As we can see on the graph, there is a phase change at 1.0, meaning that from this value a good number of adjacencies can be proposed. Increasing the multiplicative factor does not qualitatively change the results. This experiment was repeated for different numbers of simulated fissions (see Additional file 2) and different species trees, and in all cases results exhibited the same profile.
Figure 3
Figure 3
Number of syntenic neighbors of extant and ancestral genes. Distribution of the proportion of genes with a given number of neighbors in extant and ancestral genomes before and after adjacency prediction for the data set on 69 eukaryotes.
Figure 4
Figure 4
Percentage of improvement of genome assemblies, according to their initial fragmentation. Statistics are obtained for the 69 eukaryotes dataset, excluding genomes that are already well assembled (bold figures between parenthesis indicate cardinalities of classes).
Figure 5
Figure 5
Distribution of average degree of non-linearity on non-linear contigs by extant species. On this graph, only species with at least one non-linear contig are shown, representing 43 of the 69 species. 23 of these species have an average degree of non-linearity of 2, meaning that their non-linear contigs contain an extra branch (one gene of degree 3 and one extra gene with degree 1).
Figure 6
Figure 6
Density histogram of average degree of non-linearity for ancestral species on non-linear contigs. Most of the ancestral species have an average degree of non-linearity of 20 meaning that in average contigs of ancestral species reconstructed by ARt-DeCo have a degree of non-linearity less than 20. This figure shows that a large number are non-linear and additional operations are necessary to obtain linear contigs.
Figure 7
Figure 7
Evolutionary history of the adjacency between RCSD1 (turquoise) and CREG1 (light green). ARt-DeCo infers the creation of this adjacency at the root of Amniots. We integrated the different evolutionary events concerning the RCSD1-CREG1 adjacency along the species tree. Empty red crosses represents an adjacency losses (i.e., cases where both adjacent genes are lost at the same time); each full red cross represents a gene loss (only one of the genes is lost); each empty green square indicates an adjacency duplication (places where the two adjacent genes are duplicated together); a full green square indicates a gene duplication and an orange triangle represents an adjacency gain. Color code for species name gives information on adjacency status. In red species, RCSD1 and CREG1 genes are not adjacent, while blue species host the RCSD1-CREG1 adjacency as described by Ensembl, and green species have the RCSD1-CREG1 adjacency inferred by ARt-DeCo (though it is absent from Ensembl). For green species, the adjacency support is indicated. For some species, representing most of the clades in Ensembl, we illustrate the gene content around the RCSD1-CREG1 adjacency, which illustrates strong similarities in the genomes of blue and green species.
Figure 8
Figure 8
Weighted neighborhoods of extant (A) and ancestral genes (B). Distribution of the proportion of extant and ancestral genes with a given neighborhood weight in extant genomes before and after adjacency prediction, with or without support, for the data set on 39 mammals. The neighborhood weight of a gene is the sum of the supports of all adjacencies involving this gene. Continuous values are binned by intervals.
Figure 9
Figure 9
Capacity of ARt-DeCo to recover adjacencies after simulated breaks on human and horse genome.

References

    1. Raphael BJ, Volik S, Collins C, Pevzner PA. Reconstructing tumor genome architectures. Bioinformatics. 2003;19(Suppl. 2) - PubMed
    1. Fischer A, Vázquez-García I, Illingworth CJR, Mustonen V. High-definition reconstruction of clonal composition in cancer. Cell Reports. 2014;7(5):1740–1752. - PMC - PubMed
    1. McPherson A, Roth A, Ha G, Shah SP, Chauve C, Sahinalp SC. Joint inference of genome structure and content in heterogeneous tumor samples. Research in Computational Molecular Biology Lecture Notes in Computer Science. 2015;9029:256–258.
    1. Hurst L, Pál C, Lercher M. The evolutionary dynamics of eukaryotic gene order. Nat Rev Genet. 2004;5(4):299–310. - PubMed
    1. Swenson K, Arndt W, Tang J, Moret B. Phylogenetic reconstruction from complete gene orders of whole genomes. Proceedings of the 6th Asia Pacific Bioinformatics Conference. 2008. pp. 241–250.

Publication types

LinkOut - more resources