. 2015 Dec;5(12):1314-27.
doi: 10.1158/2159-8290.CD-15-0493. Epub 2015 Oct 8.

Dual Roles of RNF2 in Melanoma Progression

Affiliations

Dual Roles of RNF2 in Melanoma Progression

Kunal Rai et al. Cancer Discov. 2015 Dec.

Abstract

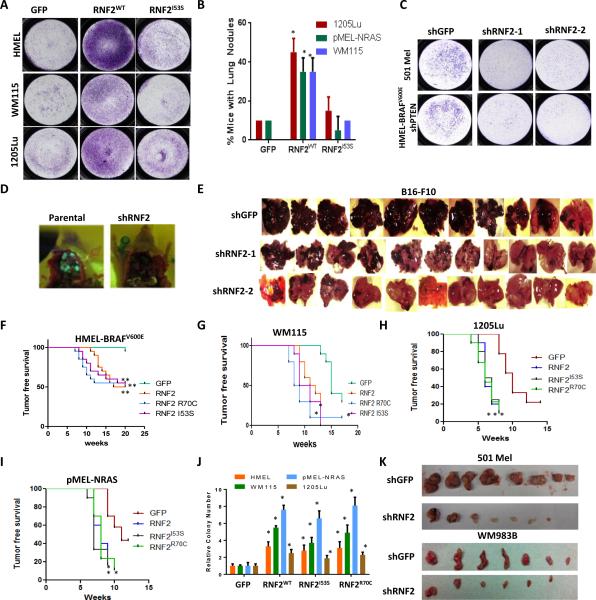
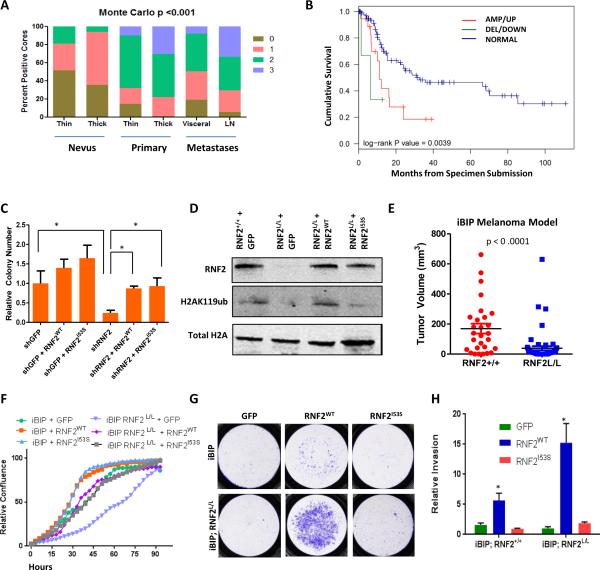
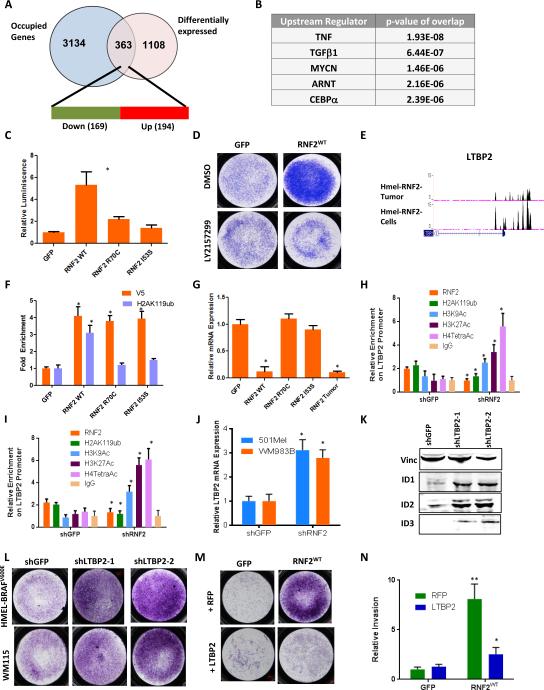
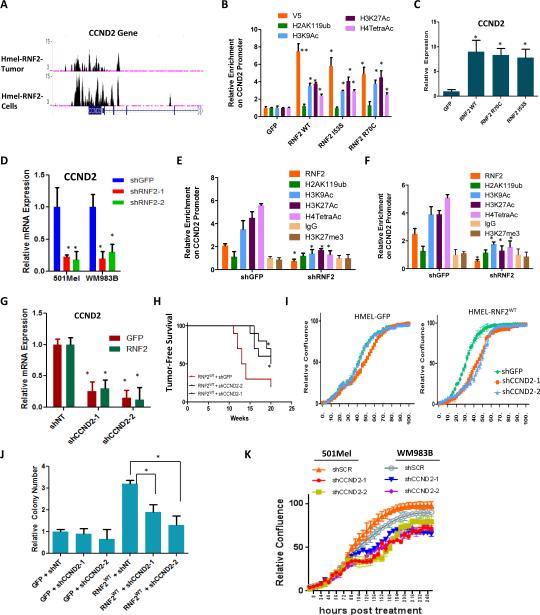
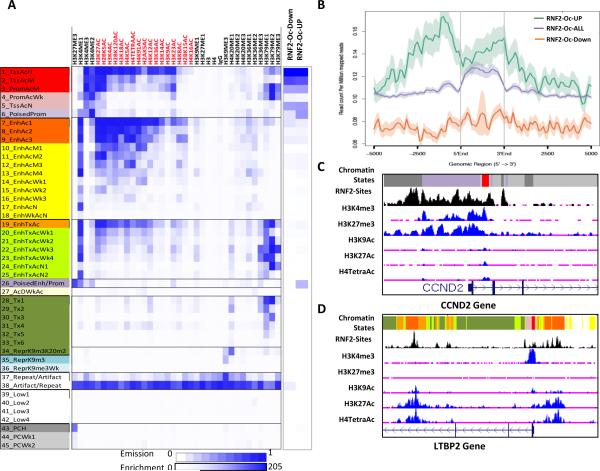
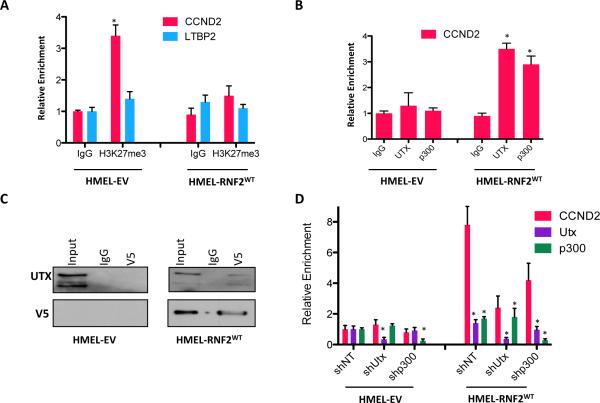
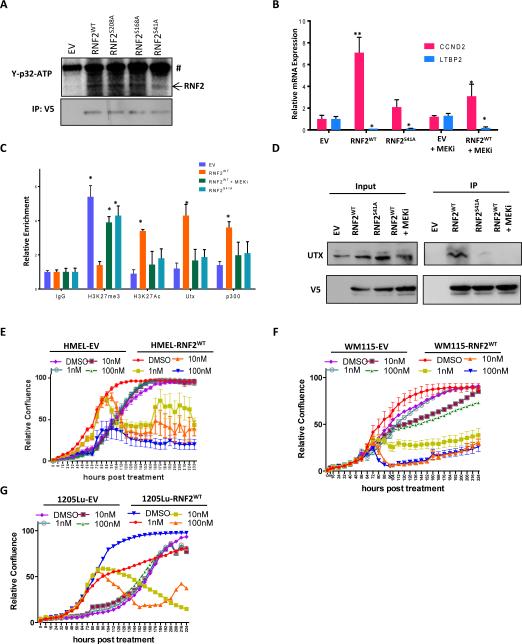
Epigenetic regulators have emerged as critical factors governing the biology of cancer. Here, in the context of melanoma, we show that RNF2 is prognostic, exhibiting progression-correlated expression in human melanocytic neoplasms. Through a series of complementary gain-of-function and loss-of-function studies in mouse and human systems, we establish that RNF2 is oncogenic and prometastatic. Mechanistically, RNF2-mediated invasive behavior is dependent on its ability to monoubiquitinate H2AK119 at the promoter of LTBP2, resulting in silencing of this negative regulator of TGFβ signaling. In contrast, RNF2's oncogenic activity does not require its catalytic activity nor does it derive from its canonical gene repression function. Instead, RNF2 drives proliferation through direct transcriptional upregulation of the cell-cycle regulator CCND2. We further show that MEK1-mediated phosphorylation of RNF2 promotes recruitment of activating histone modifiers UTX and p300 to a subset of poised promoters, which activates gene expression. In summary, RNF2 regulates distinct biologic processes in the genesis and progression of melanoma via different molecular mechanisms.

Significance: The role of epigenetic regulators in cancer progression is being increasingly appreciated. We show novel roles for RNF2 in melanoma tumorigenesis and metastasis, albeit via different mechanisms. Our findings support the notion that epigenetic regulators, such as RNF2, directly and functionally control powerful gene networks that are vital in multiple cancer processes.


Figures

Figure 1
Figure 1. RNF2 overexpression promotes invasion and metastasis in catalytic activity dependent manner
(A) RNF2 overexpression promotes invasion in multiple melanocytic and melanoma-derived cell lines in catalytic activity dependent manner. GFP, RNF2WT or RNF2I53S were overexpressed by lentiviral transduction in HMELBRAFV600E (primary melanocytes), WM115 and 1205Lu cells and invasion capacity measured using Boyden Chamber matrigel invasion assay. Representative image of invasive cells is shown. pMEL-NRASG12D cells were not tested in invasion assay due to high background. (B) RNF2 overexpression promotes metastasis. Percentage of mice with lung nodules (at the time of euthanasia due to tumor burden) is shown in the graph. HMEL-BRAFV600E cells were not used in the metastasis assay due to high latency. (* denotes significant change t-test p < 0.05). (C) 501Mel and HMEL-BRAF-shPTEN cells with stably integrated shGFP, shRNF2-1, shRNF2-2 were subjected to Boyden chamber matrigel invasion assay. Representative images of invaded cells are shown. (D) Representative image showing lung seeding of HMEL-BRAFV600E-shPTEN cells alone or with shRNF2. Cells are labeled with GFP and hence the lung seeding noted by green nodules in the lung. (E) B16-F10 mouse cells with stably integrated shGFP, shRNF2-1 or shRNF2-2 were injected intravenously in C57BL/6 mice. Mice were sacrificed after 16 days and lung seeding noted by color of black melanocytes in lung. (F-I) Kaplan-Meier curve showing tumor free survival of mice following intradermal injection of (F) HMEL-BRAFV600E cells, (G) WM115 cells, (H) 1205Lu cells and (I) pMEL-NRASG12D overexpressing GFP, RNF2 wild type or catalytic mutant derivative (R70C or I53S). Mantel-Cox p values for graph comparisons between GFP and individual RNF2 derivatives are as follows: HMEL-BRAFV600E = p<0.005; WM115 = p < 0.01; 1205Lu = p< 0.01; pMEL-NRASG12D = p<0.01. Asterisk (*) represents p < 0.01 and double asterisk (**) represents p < 0.005. (J) Graph showing relative colony number from a soft-agar colony formation assay in HMEL-BRAFV600E, pMEL-NRASG12D, WM115 cells and 1205Lu cells overexpressing GFP, RNF2 wild type or catalytic mutant derivative (R70C or I53S). Asterisk (*) denotes significant change t-test p < 0.05. (K) 501Mel or WM983B cells stably expressing shGFP or shRNF2 were subjected to tumor formation assay by intradermal injection in immunodeficient mice. Image shows subcutaneous tumors after 8 weeks post injection.
Figure 2
Figure 2. RNF2 promotes tumorigenesis in catalytic activity independent manner
(A) Bar plot showing distribution of RNF2 immunoreactive intensity counts (0,1,2,3) in nevi (thin and thick), primary (thin and thick) and metastasis (visceral and lymph node). (B) Kaplan-Meier curve showing cumulative survival of three groups of patients defined by copy number change and expression in a TCGA cohort with available survival data (108): amplified/upregulated (AMP/UP, 12/18, Red), deleted/downregulated (DEL/DOWN, 2/4, Green) and no copy number/expression change (‘Normal’, 44/104, Blue). (C) Graph shows relative number of soft agar colonies in WM983B cells rescues with GFP, RNF2 wild type or catalytic mutant derivative (R70C or I53S) (* denotes significant change t-test p < 0.05). (D) Western blot showing levels of Rnf2, H2AK119ub and total H2A in iBIP mice tumor cells with (Rnf2+/+) or without RNF2 (Rnf2L/L) overexpressing GFP, RNF2WT and RNF2I53S. (E) Scatter plot showing ear tumor volume in iBIP mice with iBIP;RNF2+/+ or iBIP;RNF2L/L genotype after doxycycline (2mg/ml) administration and treatment with 4-hydroxytamoxifen (1μM). t-test p<0.0001. (F-H) (F) Proliferation assay, (G) Invasion assay images and (H) invasion assay quantitation in iBIP mice tumor cells with (Rnf2+/+) or without RNF2 (Rnf2L/L) overexpressing GFP, RNF2WT and RNF2I53S. Asterisk denotes significant change t-test p < 0.05.
Figure 3
Figure 3. RNF2 promotes TGFβ signaling
(A) Overlap of genes with corresponding promoters occupied by RNF2 (using ChIP-Seq data) and differentially expressed genes. 363 genes show overlap of which 169 (47%, green) are downregulated and 194 (53%, red) are upregulated. (B) Top 5 pathways from upstream regulating factor enrichment by IPA (Ingenuity Pathway Analysis). Note that TGFβ target genes were one of the most significantly deregulated and occupied genes. (C) Luciferase assay showing increased TGFβ responsive promoter activity in HEK293 cells with overexpression of RNF2WT, but not with RNF2R70C and RNF2I53S. (D) Representative image from a Boyden chamber matrigel invasion experiment in HMEL-BRAFV600E cells overexpressing GFP or RNF2WT and treated with DMSO or LY2157299 (TGFβRI Inhibitor). Invaded cells stained with Crystal Violet are shown. (E) Occupancy of RNF2 on the LTBP2 promoter. Two ChIP-Seq tracks are shown: top: HMEL-BRAFV600E-RNF2WT tumor cells; bottom: HMELBRAFV600E-RNF2WT cells. (F-G) (F) qPCR validation showing enrichment of V5-RNF2 (V5 antibody) and H2AK119ub on LTBP2 promoter and (G) mRNA expression of LTBP2 in HMEL-BRAFV600E cells overexpressing GFP, RNF2 wild type or catalytic mutant (R70C and I53S) derivative. (H-I) Graph shows relative occupancy enrichment of RNF2 (endogenous), H2AK119ub, H3K9Ac, H3K27Ac, H4TetraAc and IgG on LTBP2 promoter as obtained by ChIP-qPCR in shGFP or shRNF2 infected 501Mel (H) and WM983B (I) cells. (J) Relative mRNA expression of LTBP2 in shGFP or shRNF2 infected 501Mel or WM983B cells. (K) Western blot showing protein levels of TGFβ target genes ID1, ID2 and ID3 in HMEL-BRAFV600E cells with knockdown of LTBP2 using two shRNAs. (L-M) Representative image of invaded cells from a triplicate Boyden chamber matrigel invasion experiment in (L) HMEL-BRAFV600E or WM115 cells with knockdown of LTBP2 using two shRNAs and (M) HMEL-BRAFV600E cells overexpressing GFP or RNF2WT along with either RFP or LTBP2. (N) Graph showing quantitation of experiment shown in panel (M). Across all panels “*” denotes significant change t-test p < 0.05 and “**” represents p value <0.01.
Figure 4
Figure 4. Oncogenic activity of RNF2 depends on upregulation of CCND2
(A) Occupancy of RNF2 on the promoter of CCND2. Two ChIP-Seq tracks are shown: top: HMEL-BRAFV600E-RNF2WT tumor cells; bottom: HMEL-BRAFV600E-RNF2WT cells. (B) Graph shows relative occupancy enrichment of V5-RNF2 (using V5 antibody), H2AK119ub, H3K9Ac, H3K27Ac and H4TetraAc on CCND2 promoter as obtained by ChIP-qPCR in GFP or RNF2WT or RNF2I53S or RNF2R70C overexpressing HMELBRAFV600E cells. (C) Graph shows relative CCND2 expression in HMEL-BRAFV600E cells overexpressing GFP, RNF2 wild type or catalytic mutant derivative (R70C or I53S). Values were normalized to GFP cells as 1. (D) Graph showing mRNA expression levels of CCND2 in 501Mel and WM983B cells with RNF2 knockdown. (E-F) Graph shows relative occupancy enrichment of RNF2(endogenous), H2AK119ub, H3K9Ac, H3K27Ac, H4TetraAc, H3K27me3 and IgG on CCND2 promoter as obtained by ChIP-qPCR in shGFP or shRNF2 infected 501Mel (E) and WM983B (F) cells. (G) Graph shows mRNA expression of CCND2 in HMEL-BRAFV600E cells with GFP or RNF2WT overexpression with two stably integrated CCND2 shRNAs. (H-J) Assays for tumorigenicity in RNF2WT overexpressing HMEL-BRAFV600E cells with CCND2 knockdown (two shRNAs). (H) Kaplan-Meier curve showing tumor free survival (Mantel Cox p < 0.05), (I) relative cell density from in vitro proliferation assay and (J) soft agar colony counts (K) Proliferation curves for 501Mel and WM983B cells infected with shRNAs for GFP (shGFP) or CCND2 (shCCND2-1 and shCCND2-2). Across all panels “*” denotes significant change t-test p < 0.05 and “**” represents p value <0.01.
Figure 5
Figure 5. RNF2 activated genes harbor H3K27me3 poised chromatin state
(A) Overlap of RNF2 binding sites, upregulated and downregulated promoters with 45-State model predicted by ChromHMM of occupancy of 35-histone marks in HMEL-BRAFV600E cells (data described in Rai et al unpublished). X-axis shows histone modification antibodies used for modeling; Y-axis shows chromatin states and description of each state (also in Supplementary Table 3). Blue is enrichment. Scale is shown on the bottom. (B) Graph showing enrichment of H3K27me3 on all genes (RNF2-Oc-ALL), upregulated genes (RNF2-Oc-UP) and downregulated (RNF2-Oc-Down) containing RNF2 binding sites in their promoters. 5’ end, 3’ end and the distance from TSS is shown on the x-axis. Shadow represents standard error of mean. (C-D) UCSC genome browser view of CCND2 promoter (C) and LTBP2 promoter (D) showing chromatin state enrichment as well as RNF2 binding sites.
Figure 6
Figure 6. RNF2 recruits and requires UTX and p300 for CCND2 activation
(A) Relative occupancy of H3K27me3 on CCND2 and LTBP2 promoters in HMELBRAFV600E-EV and HMEL-BRAFV600E-RNF2WT cells. (B) Relative occupancy of UTX and p300 on CCND2 promoter. (C) Western blot showing co-immunoprecipitation of UTX upon immunoprecipitation of RNF2 (using anti-V5) from HMEL-BRAFV600E-EV and HMEL-BRAFV600E-RNF2WT cells. (D) Relative expression of CCND2, UTX and p300 in HMEL-BRAFV600E-EV and HMEL-BRAFV600E-RNF2WT cells upon control (shNT), Utx (shUtx) and p300 (shp300) knockdown. Asterisk denotes significant change t-test p < 0.05.
Figure 7
Figure 7. MEK dependent phosphorylation of RNF2 at Serine 41 is required for recruitment of UTX and p300 to CCND2 promoter
(A) Western blot image showing γ-p32-ATP signal from in vitro kinase assay (upper panel) performed using purified MEK1 kinase and immunoprecipitated GFP/RNF2WT/RNF2S41A proteins from HEK293 cells (loading control in bottom panel) as substrate. # denotes non-specific band. (B) Relative mRNA expression of CCND2 and LTBP2 upon MEKi (Trametinib, 5nM) in HMEL-BRAFV600E-EV and HMEL-BRAFV600E-RNF2WT cells or HMEL-BRAFV600E-RNF2S41A cells. (C) Relative occupancy of UTX and p300 on CCND2 promoter in untreated or MEKi (Trametinib, 5nM) treated HMEL-BRAFV600E-EV and HMEL-BRAFV600E-RNF2WT cells or HMEL-BRAFV600E-RNF2S41A cells. (D) Co-immunoprecipitation of UTX with RNF2 (anti-V5) in untreated or MEKi (Trametinib, 5nM) treated HMEL-BRAFV600E-EV and HMEL-BRAFV600E-RNF2WT cells or HMEL-BRAFV600E-RNF2S41A cells. (E-G) Proliferation curves for EV and RNF2WT expressing HMEL-BRAFV600E, WM115 and 1205Lu cells after treatment with DMSO or MEKi (Trametinib at 1nM, 10nM and 100nM). Across all panels “*” denotes significant change t-test p < 0.05 and “**” represents p value <0.01.

Comment in

Similar articles

Cited by

References

    1. Chi P, Allis CD, Wang GG. Covalent histone modifications--miswritten, misinterpreted and mis-erased in human cancers. Nature reviews Cancer. 2010;10:457–69. - PMC - PubMed
    1. Leong SP, Gershenwald JE, Soong SJ, Schadendorf D, Tarhini AA, Agarwala S, et al. Cutaneous melanoma: a model to study cancer metastasis. Journal of surgical oncology. 2011;103:538–49. - PubMed
    1. Scott KL, Nogueira C, Heffernan TP, van Doorn R, Dhakal S, Hanna JA, et al. Proinvasion metastasis drivers in early-stage melanoma are oncogenes. Cancer cell. 2011;20:92–103. - PMC - PubMed
    1. Tyler JK, Adams CR, Chen SR, Kobayashi R, Kamakaka RT, Kadonaga JT. The RCAF complex mediates chromatin assembly during DNA replication and repair. Nature. 1999;402:555–60. - PubMed
    1. Thomas JO, Stott K. H1 and HMGB1: modulators of chromatin structure. Biochemical Society transactions. 2012;40:341–6. - PubMed

Publication types

MeSH terms