. 2015 Oct 13;6(31):31740-57.
doi: 10.18632/oncotarget.5033.

Genotoxic stress inhibits Ewing sarcoma cell growth by modulating alternative pre-mRNA processing of the RNA helicase DHX9

Affiliations

Genotoxic stress inhibits Ewing sarcoma cell growth by modulating alternative pre-mRNA processing of the RNA helicase DHX9

Marco Fidaleo et al. Oncotarget. .

Abstract

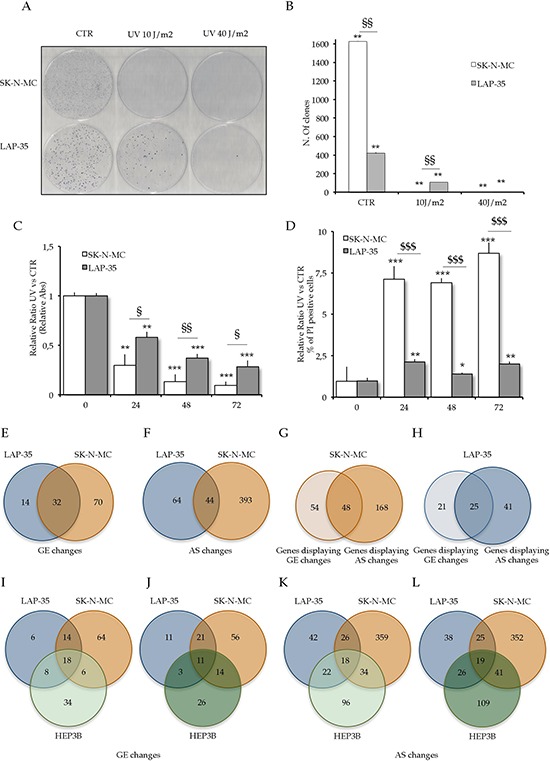
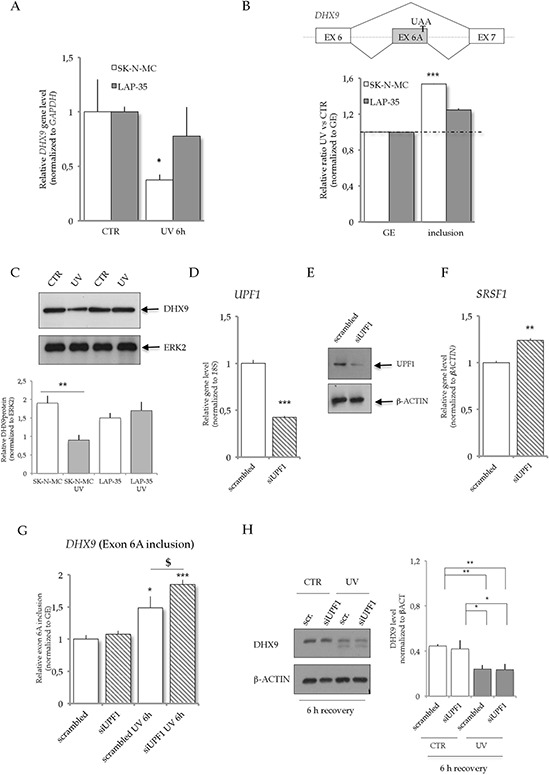
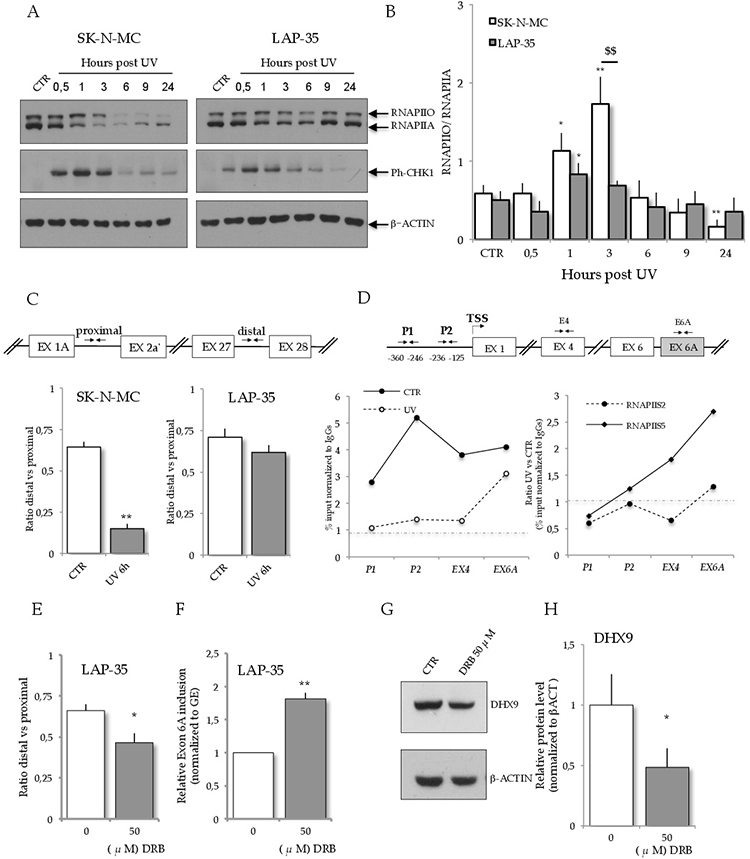
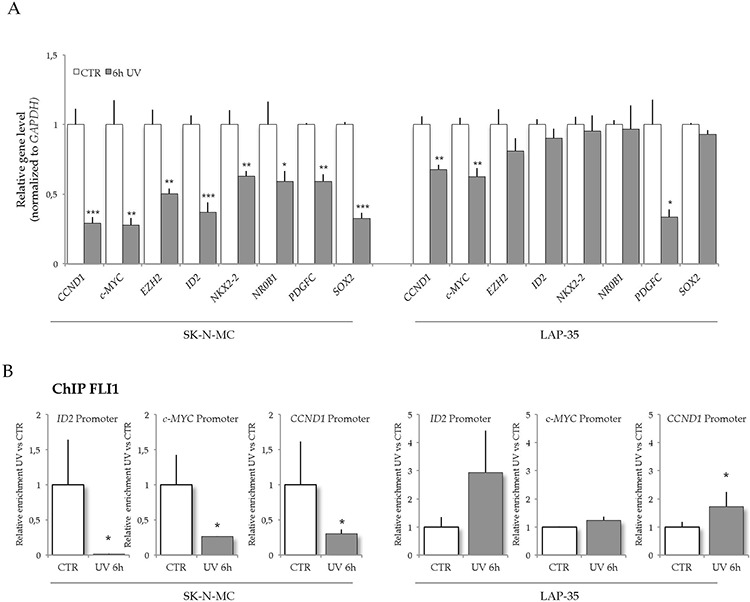
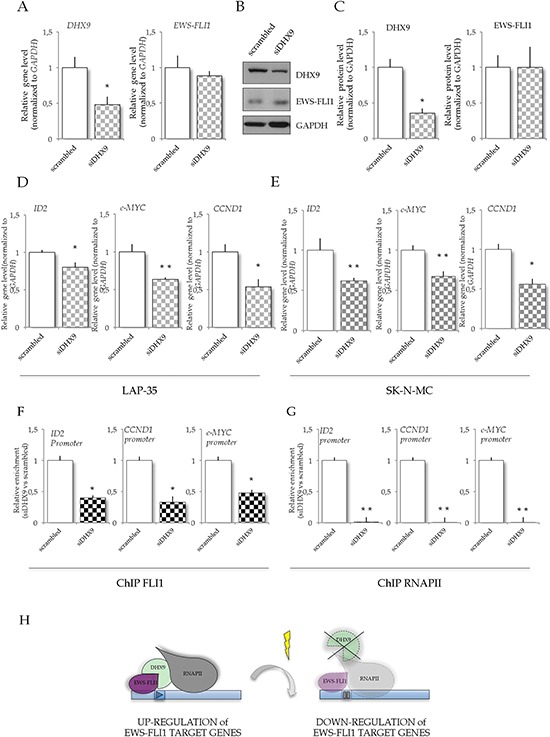
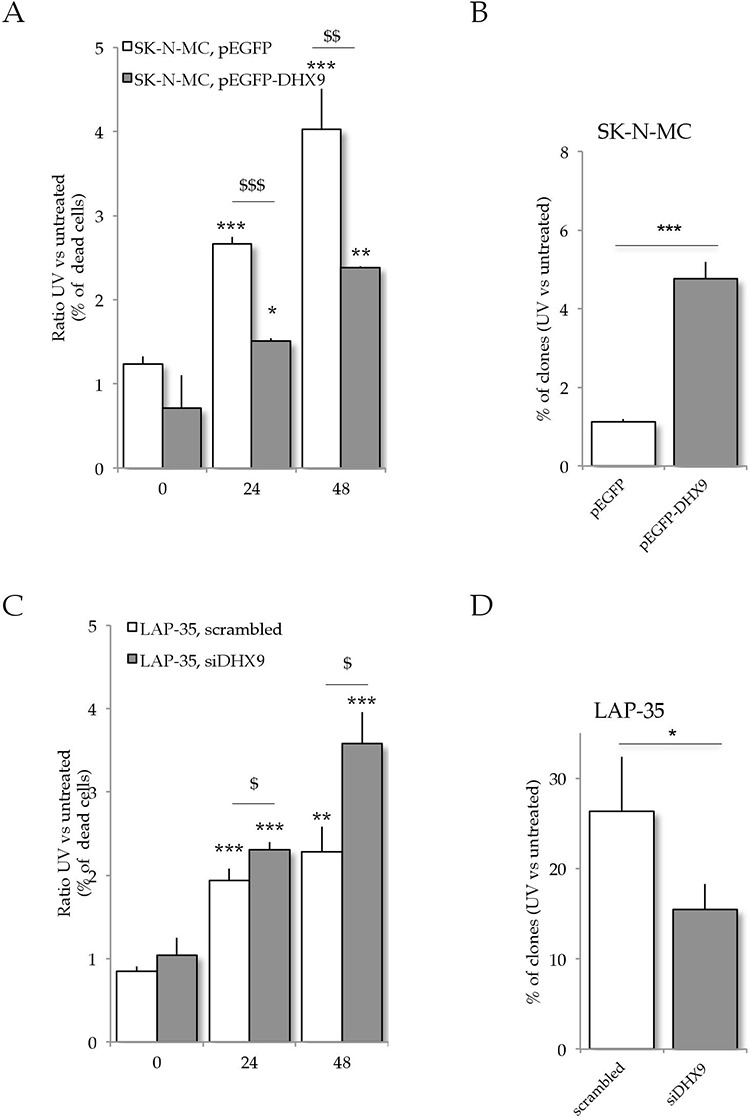
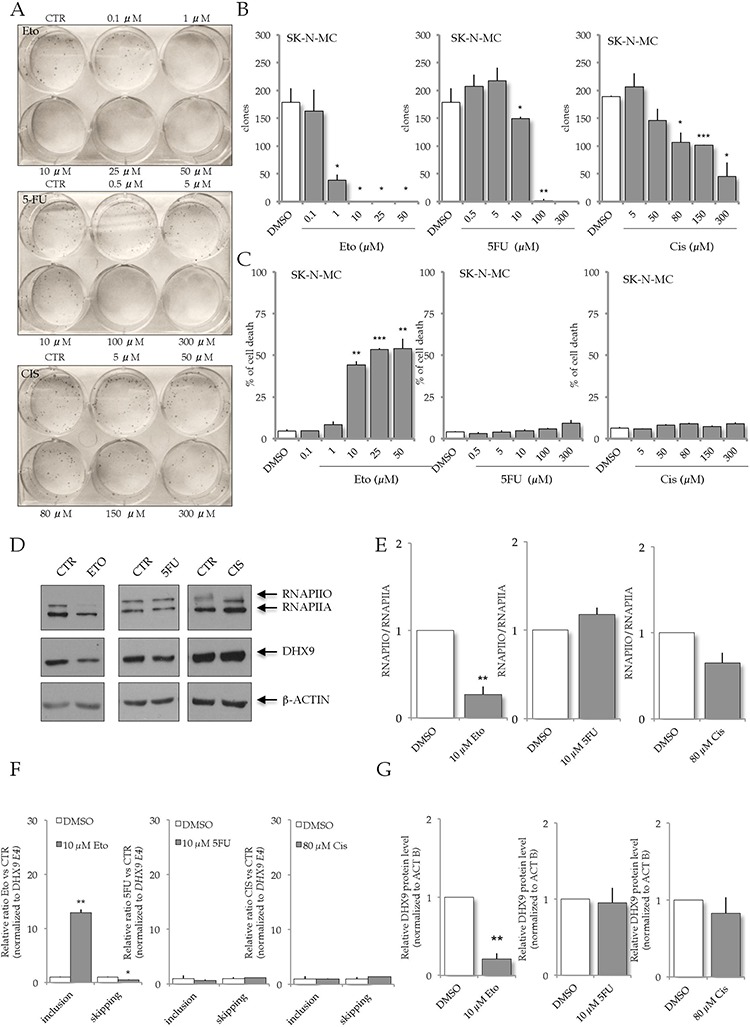
Alternative splicing plays a key role in the DNA damage response and in cancer. Ewing Sarcomas (ES) are aggressive tumors caused by different chromosomal translocations that yield in-frame fusion proteins driving transformation. RNA profiling reveals genes differentially regulated by UV light irradiation in two ES cell lines exhibiting different sensitivity to genotoxic stress. In particular, irradiation induces a new isoform of the RNA helicase DHX9 in the more sensitive SK-N-MC cells, which is targeted to nonsense-mediated decay (NMD), causing its downregulation. DHX9 protein forms a complex with RNA polymerase II (RNAPII) and EWS-FLI1 to enhance transcription. Silencing of DHX9 in ES cells sensitizes them to UV treatment and impairs recruitment of EWS-FLI1 to target genes, whereas DHX9 overexpression protects ES cells from genotoxic stress. Mechanistically, we found that UV light irradiation leads to enhanced phosphorylation and decreased processivity of RNAPII in SK-N-MC cells, which in turn causes inclusion of DHX9 exon 6A. A similar effect on DHX9 splicing was also elicited by treatment with the chemotherapeutic drug etoposide, indicating a more general mechanism of regulation in response to DNA damage. Our data identify a new NMD-linked splicing event in DHX9 with impact on EWS-FLI1 oncogenic activity and ES cell viability.

Keywords: DHX9; DNA damage; Ewing sarcoma; alternative splicing.


Conflict of interest statement

CONFLICTS OF INTEREST

The authors declare no conflict of interest.

Figures

Figure 1
Figure 1. UV light irradiation triggers cytotoxic effect in Ewing Sarcoma cells
A. Representative images of clonogenic assays of SK-N-MC and LAP-35 cells upon UV light irradiation. B. Histograms represent colony numbers (n = 3; mean ± s.d.) carried out on SK-N-MC (white bars) and LAP-35 cells (gray). C. Cell survival rates detected by MTS cell proliferation assay after 10 J/m2 UV light treatment in SK-N-MC (white) and LAP-35 cells (gray). D. Propidium Iodide (PI) viability assay; the decrease in viability was expressed as relative percentage of dead cells in treated versus control cells after 10 J/m2 UV light treatment in SK-N-MC (white) and LAP-35 cells (gray). In all panels statistical analysis was performed by Student's t-test: *p < 0.05, **p < 0.01, ***p < 0.001 for CTR vs UV treatment; $p < 0.05, $$p < 0.01, $$$p < 0.001 for SK-N-MC vs LAP-35 cells. E. Venn diagram shows the overlap of gene expression signatures at gene level induced by 10 J/m2 UV light irradiation in SK-N-MC and LAP-35 cells, as indicated. F. Venn diagram shows the overlap of gene expression signatures at AS level induced by 10 J/m2 UV light irradiation in SK-N-MC and LAP-35 cells, as indicated. G. and H. Venn diagrams represent the overlap of gene affected both at gene expression and AS level upon UV light irradiation in the SK-N-MC (G) and in the LAP-35 (H) cells. I. to L. Venn diagram shows the overlap of gene expression signatures at gene and AS levels induced by 10 J/m2 (I and K respectively) and 40 J/m2 (J and L respectively) UV light irradiation in ES cells (SK-N-MC and LAP-35) and HEP3B cells, as indicated.
Figure 2
Figure 2. UV light irradiation affects DHX9 mRNA expression and alternative splicing in SK-N-MC cells, but not in LAP-35
A. RT-qPCR validation of microarray-predicted GE changes in DHX9 mRNA (exon 4), normalized to GAPDH. B. Scheme of DHX9 AS event (top panel). The alternative exon 6A is upregulated in SK-N-MC cells upon UV light treatment. UAA indicates the stop codon within exon 6A. Histograms represent levels of expression of exon 6A as relative ratio of cells treated with 10 J/m2 UV light versus untreated normalized to a constitutive exon (GE). White bars indicate SK-N-MC cells while gray bars indicate LAP-35 cells. (n = 3; mean ± s.d.). C. Western blot analysis of DHX9 and ERK2 expression in LAP-35 and SK-N-MC cells upon UV light irradiation. 10 μg of proteins from SK-N-MC and LAP-35 cell extracts after UV light (10 J/m2) treatment were loaded. Histograms represent the quantification of DHX9 protein normalized to ERK2. D. RT-qPCR analysis of UPF1 expression in SK-N-MC cells transfected with either scrambled (white) or siUPF1 (filled) oligonucleotides. Histograms represent UPF1 mRNA levels normalized to 18S expression (n = 3; mean ± s.d). E. Western blot of UPF1 and β-actin expression in SK-N-MC cells transfected with either scrambled (white) or siUPF1 (filled) oligonucleotides. 10 μg of proteins were loaded. F. RT-qPCR analysis to detect the expression of SRSF1, a known NMD target [23], in SK-N-MC cells transfected with either scrambled (white) or siUPF1 (filled) oligonucleotides. Histograms represent SRSF1 mRNA levels normalized to β-ACTIN expression (n = 3; mean ± s.d). G. Relative DHX9 exon 6A inclusion (normalized to GE) in SK-N-MC cells, transfected either with scrambled or siUPF1 oligonucleotides, with or without UV treatment. H. Western blot analysis of DHX9 and β-ACTIN expression in SK-N-MC cells at 6 hours of recovery after UV light irradiation. 10 μg of proteins from SK-N-MC cell extracts were loaded transfected either with scrambled or siUPF1 oligonucleotides. Upon UV light treatment a slower band of DHX9 protein is also induced due to caspase cleavage of the first 95 aminoacids of the protein and correlating with early stage of apoptosis, cell apoptosis as previously described [24]. On the right, histograms represent the quantification of DHX9 protein normalized to β-ACTIN from three independent experiments (n = 3; mean ± s.d.). In all panels statistical analysis was performed by Student's t-test: *p < 0.05, **p < 0.01, ***p < 0.001; $p < 0.05, $$p < 0.01, $$$p < 0.001.
Figure 3
Figure 3. RNAPII dynamics in ES cells upon UV light treatment
A. Western blot analysis of RNAPII, Phospho-CHK1 (in order to control the activation of a protein kinase-signaling cascade initiated by ATM and ATR protein kinases upon DNA damage) and β-ACTIN expression in SK-N-MC and LAP-35 cells after UV light (10 J/m2) treatment. B. Histograms represent the ratio between the hyper-phosphorylated (RNAPIIO) and the hypo-phosphorylated (RNAPIIA) RNAPII from three independent experiments in SK-N-MC (white bars) and LAP-35 (grey bars) cells (mean ± s.d.). Statistical analysis was performed by Student's t-test: *p < 0.05, **p < 0.01, for treated vs untreated; $$p < 0.01 for SK-N-MC vs LAP-35 cells. C. In the upper part, scheme of DHX9 transcription unit showing the primers (arrows) designed to amplify proximal and distal amplicons in RT-qPCR analysis. Histograms represent RNAPII processivity, determined as a ratio between the distal and proximal amplicons in DHX9 pre-mRNA in control (white) and UV (10 J/m2) treated (grey) SK-N-MC (on the left) and LAP-35 cells (on the right). D. ChIP analysis of RNAPII occupancy on DHX9 transcription unit in normal condition and upon UV light treatment. In the upper part, scheme of DHX9 transcription unit showing the primers (arrows) designed to amplify the promoter and amplicons in the constitutive exon 4 and in the alternative exon 6A. On the left, chart represents total RNAPII binding as input percentage normalized to IgGs in normal conditions (continuous line) and at 6 hours upon UV light treatment (dashed line). On the right, chart represents PhosphoSer2-RNAPII (continuous line) and PhosphoSer5-RNAPII (dashed line) binding to DHX9 transcription unit. Binding is expressed as input percentage of UV versus CTR. E–F. RNAPII processivity and relative exon 6A inclusion after 12-hours 50 μM-DRB treatment in LAP-35 cells. Exon 6A inclusion rises and RNAPII processivity decreases in DRB-treated LAP-35. Histograms represent mean ± s.d. from three independent biological replicas (treated vs untreated: *p < 0.05, **p < 0.01). G. Western blot analysis of DHX9 and β-ACTIN expression in extracts (10 μg) from LAP-35 treated with 50 μM DRB (12 hours). H. Histograms represent quantification of DHX9 protein normalized to β-ACTIN (n = 3; mean ± s.d.; **p < 0.01).
Figure 4
Figure 4. UV light treatment down-regulates EWS-FLI1 target genes in SK-N-MC cells
A. Histograms represent RT-qPCR analysis of ID2, c-MYC, CCND1 EZH2, NKX2–2, NR0B1, PDGFC, SOX2 expression in control (white bar) or UV-treated (gray bar) LAP-35 and SK-N-MC cells. GE values of are normalized to GAPDH expression (n = 3; mean ± s.d.; treated vs untreated *p < 0.05, **p < 0.01, ***p < 0.001). B. Association of EWS-FLI1 to the promoters of ID2, CCND1 and c-MYC genes. qPCR analysis of EWS-FLI1 ChIP signals for SK-N-MC and LAP-35 cells with or without UV treatment. Histograms represent relative fold enrichment of EWS-FLI1 normalized versus the IgGs content (n = 3; mean ± s.d.; *p < 0.05, **p < 0.01, ***p < 0.001).
Figure 5
Figure 5. DHX9 knockdown in LAP-35 cells affects EWS-FLI1 target genes
A. RT-qPCR analysis to monitor DHX9 and EWS-FLI1 mRNA expression in LAP-35 cells knockdown for DHX9. B. Western blot analysis of DHX9, FLI1 and GAPDH expression in extracts (10 μg) from cells transfected with either scrambled or siDHX9 oligonucleotides, prepared 72 hr after transfection. C. Histograms represent quantification of western blot signals shown in (B) from three independent experiments (mean ± s.d.). D. RT-qPCR analysis of EWS-FLI1 target genes upon DHX9 knockdown in LAP-35 cells. Histograms represent expression (GE) of ID2, c-MYC, and CCND1 normalized to GAPDH expression in cells transfected with either scrambled (white bars) or siDHX9 oligonucleotides (checked filled bars) (n = 3; mean ± s.d.; treated vs untreated: *p < 0.05). E. RT-qPCR analysis of EWS-FLI1 target genes upon DHX9 knockdown in SK-N-MC cells. Histograms represent expression (GE) of ID2, c-MYC, CCND1 normalized to GAPDH expression in cells transfected with either scrambled (white bars) or siDHX9 oligonucleotides (checked filled bars) (n = 3; mean ± s.d.). In all panels statistical analysis was performed by Student's t-test: *p < 0.05, **p < 0.01, ***p < 0.001). F. and G. Association of EWS-FLI1 (F) and RNAPII (G) to the promoters of ID2, CCND1 and c-MYC genes. qPCR analysis of EWS-FLI1 and RNAPII ChIP signals for LAP-35 knocked down for DHX9. Histograms represent relative fold enrichment of EWS-FLI1 and RNAPII binding normalized versus the IgGs content (n = 3; mean ± s.d.; *p < 0.05, **p < 0.01, ***p < 0.001). H. Hypothetical model of DHX9 regulation of gene expression upon UV light treatment. In ES cells DHX9, acting as hinge between EWS-FLI1 and RNAPII, is involved in EWS-FLI1 target gene expression; upon UV irradiation, the DHX9 expression is down-regulated in SK-N-MC cells, thus decreasing DHX9 availability and, in turn, interfering with EWS-FLI1 target gene expression. In LAP-35 cells, UV light treatment does not affect DHX9 expression and does not impair the recruitment of RNAPII on the promoters of EWS-FLI1 target genes.
Figure 6
Figure 6. DHX9 expression affects ES resistance to UV light irradiation
A. SK-N-MC cells were transfected with either pEGFP or pEGFP-DHX9 constructs and exposed to 10 J/m2 UV light 48 hours after transfection. Cell death was detected at 0, 24 and 48 hours after the UV treatment by PI staining and flow cytometry analysis; histograms represent the ratio of UV treated vs untreated PI positive cells in the GFP population (n = 3; mean ± s.d.; *p < 0.05, **p < 0.01, ***p < 0.001 for treated vs untreated; and: $p < 0.05, $$p < 0.01, $$$p < 0.001 for pEGFP vs pEGFP-DHX9). B. GFP-positive SK-N-MC cells transfected as in (A) were sorted and plated (2000 cells per 10-mm plate) in IMDM complete medium. 12 days after 10 J/m2 UV-light treatment cells were scored for clonogenic activity. Histograms represent the percentage of colonies formed after UV treatment versus untreated carried out on pEGFP (white) or pEGFP-DHX9 (gray) (n = 3; mean ± s.d.; pEGFP vs pEGFP-DHX9: ***p < 0.001). C. LAP-35 cells were transfected with either scrambled or siDHX9 oligonucleotides and exposed to 10 J/m2 UV light 48 hours after transfection. Cell death was detected at 0, 24 and 48 hours after treatment by PI staining and flow cytometry analysis; histograms represent the ratio of UV treated vs untreated PI positive cells (n = 3, mean ± s.d.; treated vs untreated: *p < 0.05, **p < 0.01, ***p < 0.001, for treated vs untreated; and: $p < 0.05, $$p < 0.01, $$$p < 0.001 for scrambled vs siDHX9. D. LAP-35 cells were transfected with either scrambled or siDHX9 oligonucleotides together with pEGFP plasmid; GFP positive cells were sorted and plated as above. 12 days after 10 J/m2 UV light treatment, cells were scored for clonogenic activity. Histograms represent the percentage of colonies after UV treatment versus untreated cells carried out on scrambled (white bars) or siDHX9 (gray) LAP-35 cells (n = 3, mean ± s.d.; scrambled vs siDHX9: *p < 0.05).
Figure 7
Figure 7. Etoposide treatment affects DHX9 expression and ES sensitivity
A. Representative images of clonogenic assays of SK-N-MC cells upon treatment with different concentration of etoposide (Eto; from 0,1 to 50 μM), 5-fluorouracile (5-FU; from 0,5 to 300 μM), and cisplatin (CIS; from 5 to 300 μM). B. Histograms represent colony numbers (n = 3; mean ± s.d.) carried out on SK-N-MC treated with Eto, 5-FU and CIS (grey bars) versus DMSO treatment (white bars). C. Propidium Iodide (PI) viability assay; the decrease in viability was expressed as relative percentage of dead cells in treated (grey bars) versus control (white bars, DMSO) cells after 16 hours of Eto, 5FU and CIS treatment. In all panels statistical analysis was performed by Student's t-test: *p < 0.05, **p < 0.01, ***p < 0.001. D. Western blot analysis of RNAPII, DHX9 and β-ACTIN expression in SK-N-MC after 16 hours treatment with DMSO, Eto (10 μM), 5-FU (10 μM), and CIS (80 μM). 10 μg of extracts were loaded in each lane of a 6% SDS PAGE. E. Histograms represent the ratio between the hyper-phosphorylated (RNAPIIO) and the hypo-phosphorylated (RNAPIIA) RNAPII from three independent experiments in SK-N-MC after 16 hours treatment with DMSO (white bars) or Eto (10 μM), 5FU (10 μM), and CIS (80 μM) (grey bars), as in (D) (mean ± s.d.). Statistical analysis was performed by Student's t-test: *p < 0.05, **p < 0.01, ***p < 0.001 F. RT-qPCR analysis to monitor DHX9 AS upon Eto (10 μM), 5-FU (10 μM), and CIS (80 μM) treatment. Histograms represent levels of expression of DHX9 exon 6A normalized to a constitutive exon (E4) in SK-N-MC cells. G. Histograms represent DHX9 expression from three independent experiments in SK-N-MC treated for 16 hours with DMSO (white bars) or Eto (10 μM), 5-FU (10 μM), and CIS (80 μM) (grey bars), as in (D) Statistical analysis was performed by Student's t-test: *p < 0.05, **p < 0.01, ***p < 0.001.

Similar articles

Cited by

References

    1. Delattre O, Zucman J, Plougastel B, Desmaze C, Melot T, Peter M, Kovar H, Joubert I, de Jong P, Rouleau G, Aurias A, Thomas G. Gene fusion with an ETS DNA-binding domain caused by chromosome translocation in human tumours. Nature. 1992;359:162–5. - PubMed
    1. Riggi N, Stamenkovic I. The Biology of Ewing sarcoma. Cancer Lett. 2007;254:1–10. - PubMed
    1. Jedlicka P. Ewing Sarcoma, an enigmatic malignancy of likely progenitor cell origin, driven by transcription factor oncogenic fusions. Int J Clin Exp Pathol. 2010;3:338–47. - PMC - PubMed
    1. Sanchez G, Bittencourt D, Laud K, Barbier J, Delattre O, Auboeuf D, Dutertre M. Alteration of cyclin D1 transcript elongation by a mutated transcription factor up-regulates the oncogenic D1b splice isoform in cancer. Proc Natl Acad Sci U S A. 2008;105:6004–9. - PMC - PubMed
    1. Paronetto MP. Ewing sarcoma protein: a key player in human cancer. Int J Cell Biol. 2013;2013:642853. - PMC - PubMed

Publication types

MeSH terms